| Param | Original file | Final file |
|---|---|---|
| Filename | modeM0/AS1A05_117T01_9000002958_19782cztM0_level2.evt | modeM0/AS1A05_117T01_9000002958_19782cztM0_level2_quad_clean.evt |
| Size (bytes) | 487,791,360 | 68,546,880 |
| Size | 465.2 MB | 65.4 MB |
| Events in quadrant A | 3,390,211 | 417,374 |
| Events in quadrant B | 3,536,212 | 418,137 |
| Events in quadrant C | 3,957,689 | 395,214 |
| Events in quadrant D | 3,450,291 | 394,622 |
| Mode M9 | |||
|---|---|---|---|
| Quadrant | BADHDUFLAG | Total packets | Discarded packets |
| A | 0 | 11 | 0 |
| B | 0 | 11 | 0 |
| C | 0 | 11 | 0 |
| D | 0 | 11 | 0 |
| Mode M0 | |||
|---|---|---|---|
| Quadrant | BADHDUFLAG | Total packets | Discarded packets |
| A | 0 | 14323 | 154 |
| B | 0 | 14919 | 155 |
| C | 0 | 16160 | 237 |
| D | 0 | 14698 | 195 |
| Mode SS | |||
|---|---|---|---|
| Quadrant | BADHDUFLAG | Total packets | Discarded packets |
| A | 0 | 132 | 0 |
| B | 0 | 132 | 0 |
| C | 0 | 132 | 0 |
| D | 0 | 132 | 0 |
| Quadrant | Total seconds | Saturated seconds | Saturation percentage |
|---|---|---|---|
| A | 6450 | 92 | 1.426357% |
| B | 6456 | 152 | 2.354399% |
| C | 6441 | 290 | 4.502406% |
| D | 6447 | 114 | 1.768264% |
Noise dominated data is calculated using 1-second bins in cleaned event files. If a bin has >2000 counts, and if more than 50% of those come from <1% of pixels, then it is considered to be noise-dominated and hence unusable.
| Quadrant | # 1 sec bins | Bins with >0 counts | Bins with >2000 counts | High rate bins dominated by noise | Noise dominated (total time) | Noise dominated (detector-on time) | Marked lightcurve |
|---|---|---|---|---|---|---|---|
| A | 7567 | 6497 | 15 | 15 | 0.20% | 0.23% | 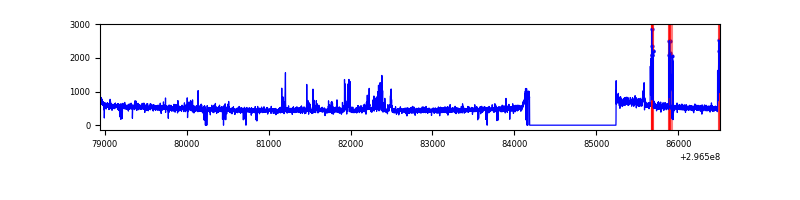 |
| B | 7567 | 6496 | 55 | 55 | 0.73% | 0.85% | 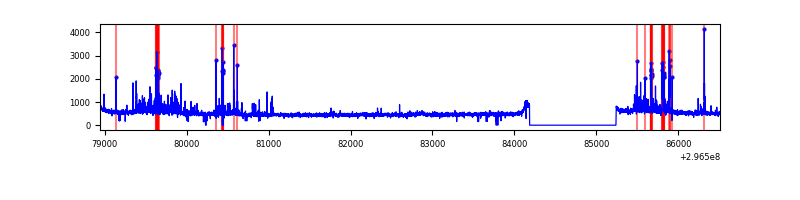 |
| C | 7567 | 6487 | 116 | 116 | 1.53% | 1.79% | 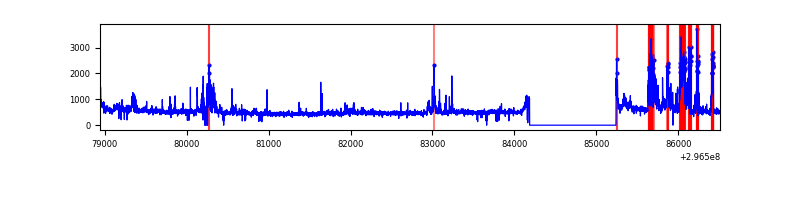 |
| D | 7568 | 6492 | 61 | 61 | 0.81% | 0.94% | 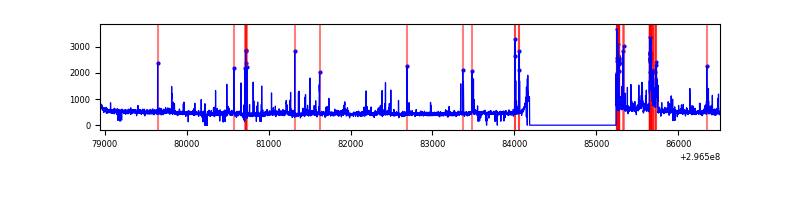 |
Top three noisy pixels from each quadrant. If the there are fewer than three noisy pixels in the level2.evt file, extra rows are filled as -1
| Pixel properties | Quadrant properties | ||||||
|---|---|---|---|---|---|---|---|
| Quadrant | DetID | PixID | Counts | Sigma | Mean | Median | Sigma |
| A | 0 | 23 | 129919 | 789.46 | 811 | 794 | 163.6 |
| A | 6 | 16 | 127686 | 775.81 | 811 | 794 | 163.6 |
| A | 0 | 226 | 15689 | 91.07 | 811 | 794 | 163.6 |
| B | 7 | 220 | 302953 | 1989.41 | 802 | 783 | 151.9 |
| B | 0 | 197 | 30125 | 193.18 | 802 | 783 | 151.9 |
| B | 0 | 190 | 22561 | 143.38 | 802 | 783 | 151.9 |
| C | 3 | 233 | 817579 | 4618.3 | 760 | 764 | 176.9 |
| C | 14 | 238 | 125647 | 706.09 | 760 | 764 | 176.9 |
| C | 7 | 247 | 33093 | 182.79 | 760 | 764 | 176.9 |
| D | 1 | 52 | 291991 | 1533.17 | 780 | 756 | 190.0 |
| D | 7 | 96 | 83035 | 433.15 | 780 | 756 | 190.0 |
| D | 12 | 218 | 63624 | 330.96 | 780 | 756 | 190.0 |
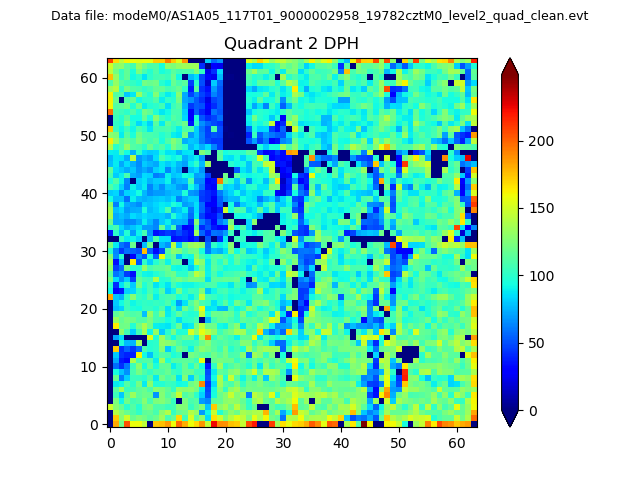
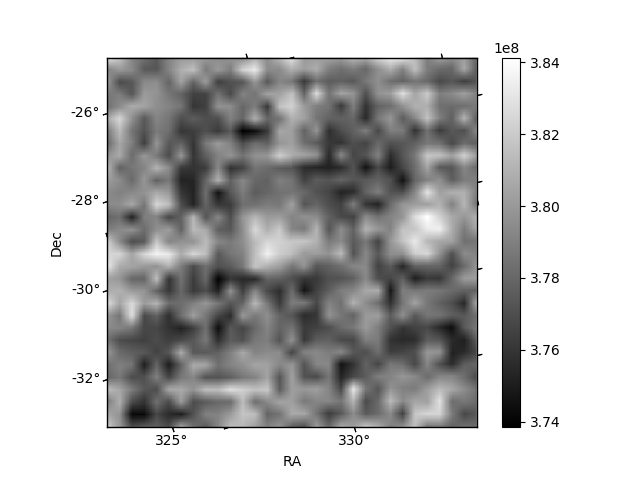
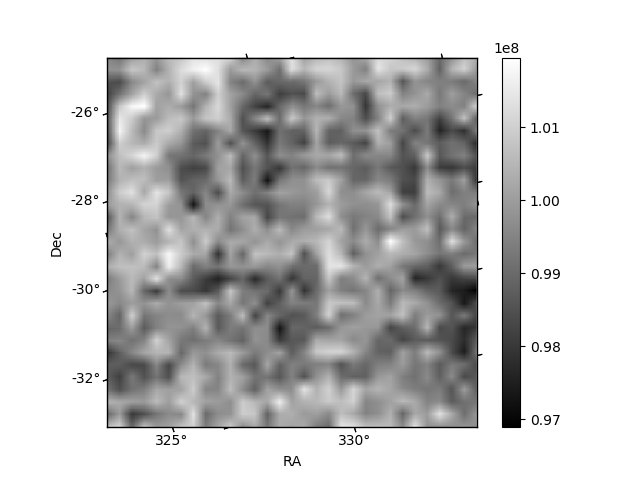
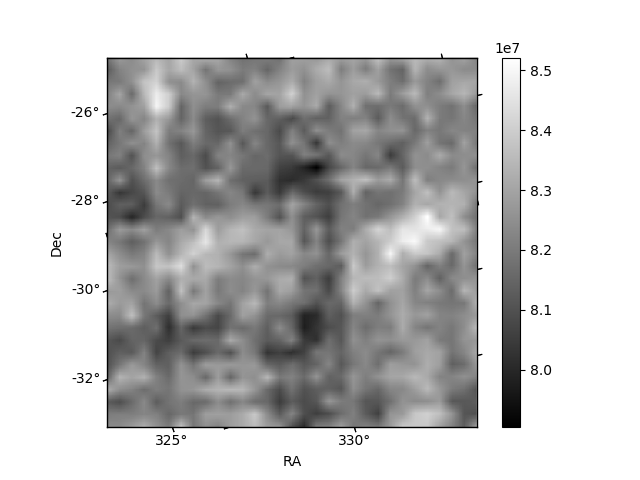
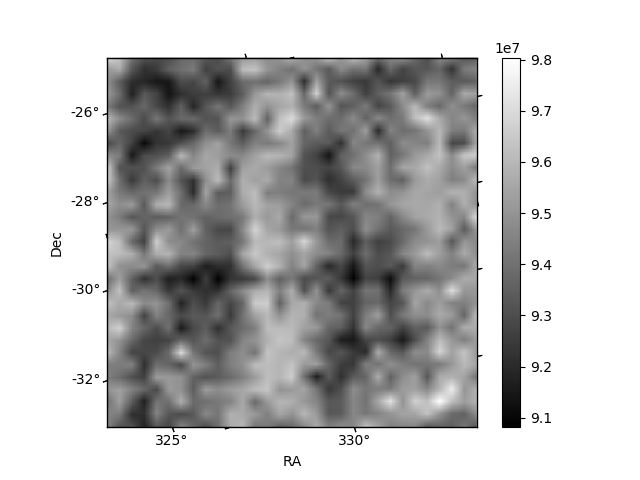
Histogram calculated using DETX and DETY for each event in the final _common_clean file
| Quadrant A | 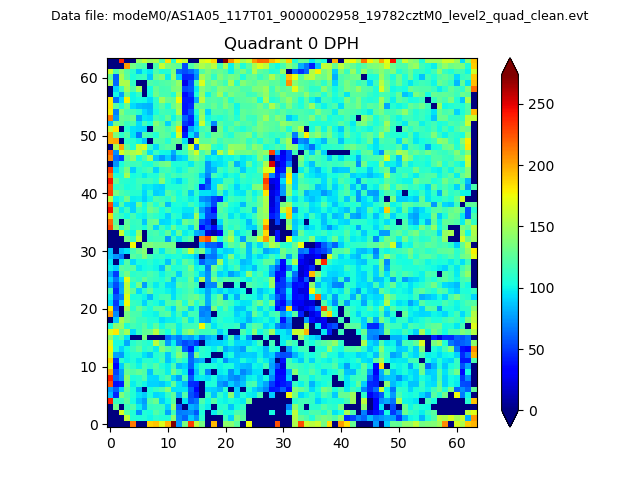 |
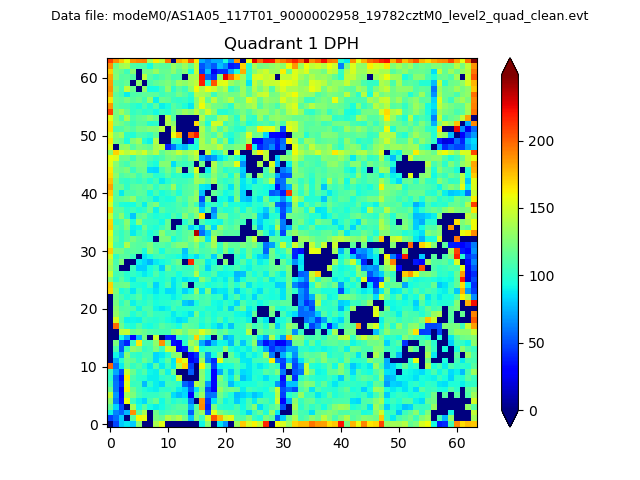 |
Quadrant B |
|---|---|---|---|
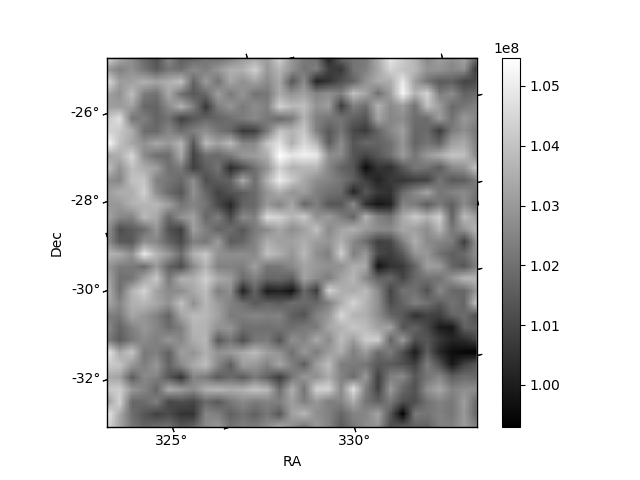
| Quadrant D | 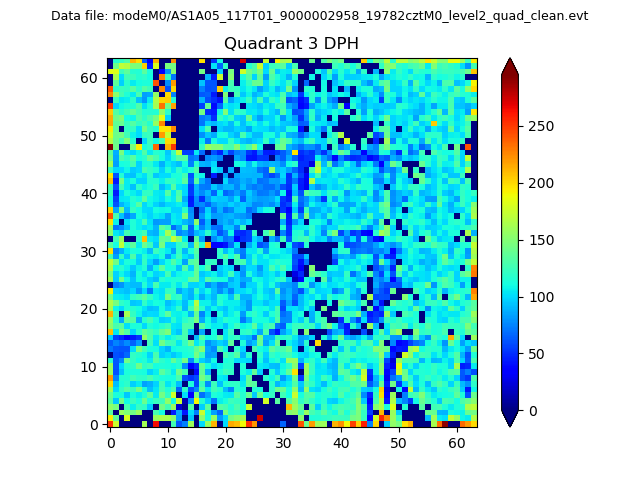 |
 |
Quadrant C |
| Plot type | Count rate plots | Images |
|---|---|---|
| Comparison with Poisson distribution Blue bars denote a histogram of data divided into 1 sec bins. Red curve is a Poisson curve with rate = median count rate of data. |
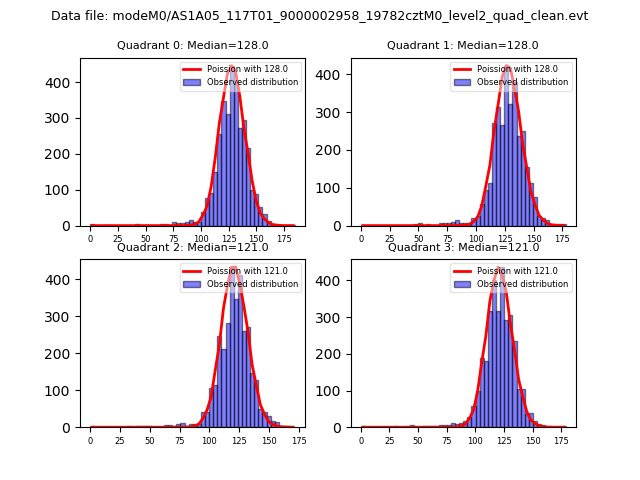 |
 |
| Quadrant-wise count rates Data is divided into 100 sec bins |
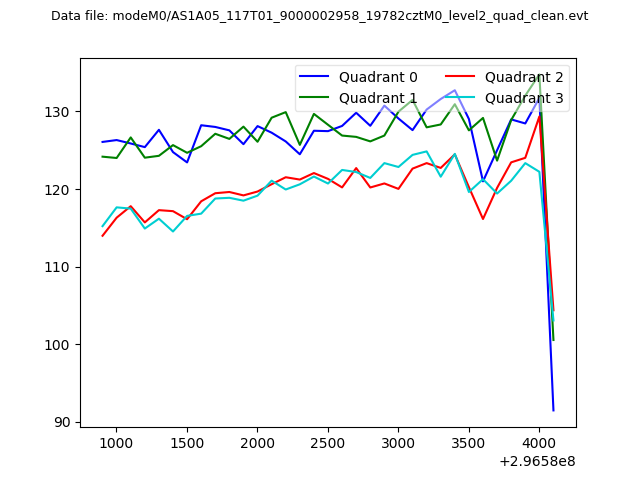 |
|
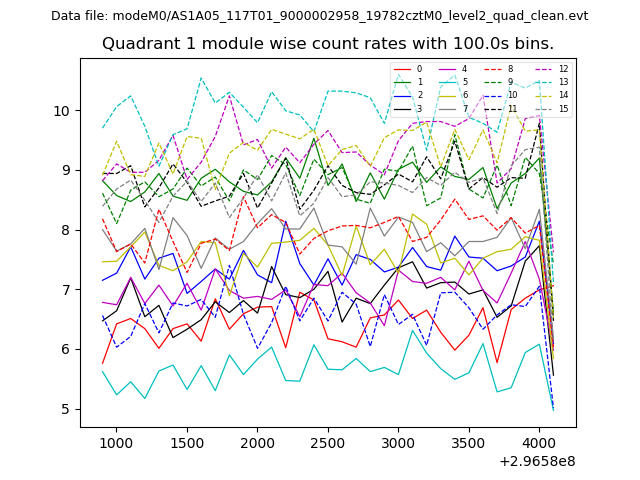
| Module-wise count rates for Quadrant A Data is divided into 100 sec bins |
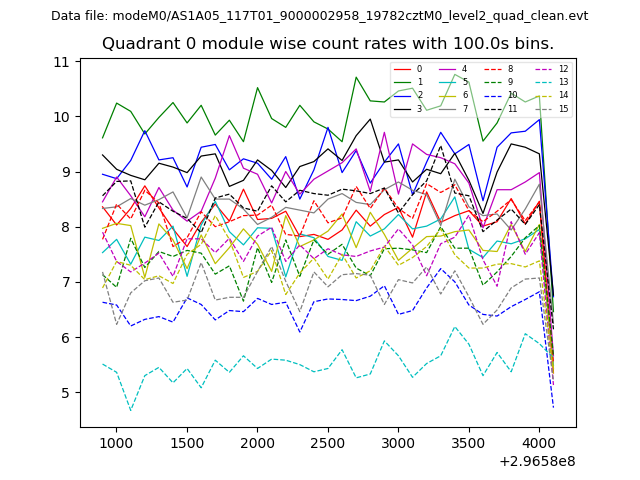 |
 |
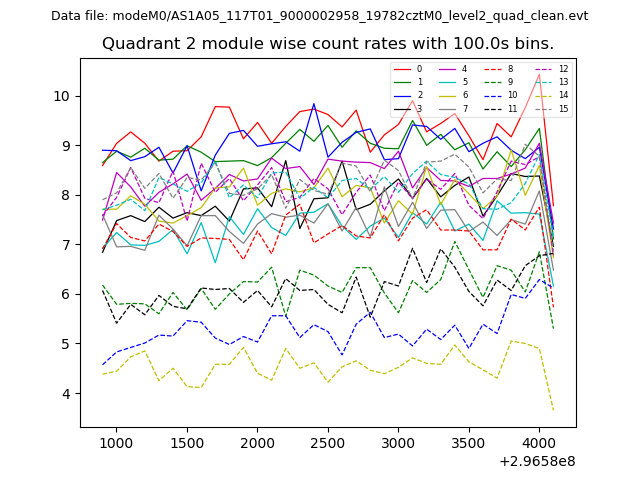
| Module-wise count rates for Quadrant B Data is divided into 100 sec bins |
 |
 |
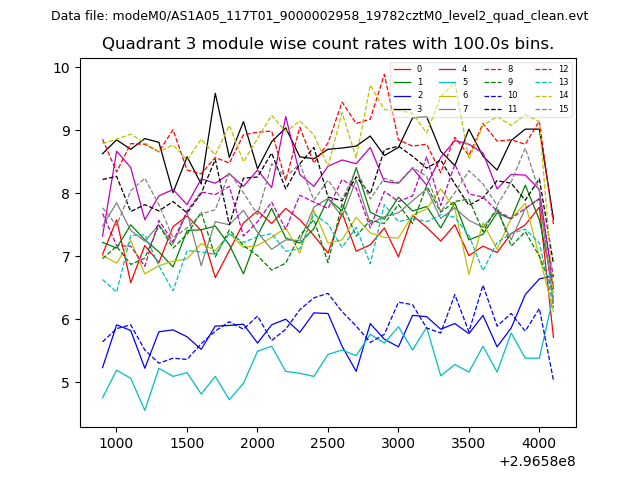
| Module-wise count rates for Quadrant C Data is divided into 100 sec bins |
 |
 |
| Module-wise count rates for Quadrant D Data is divided into 100 sec bins |
 |
 |
| Parameter | Plot |
|---|---|
| CZT HV Monitor | 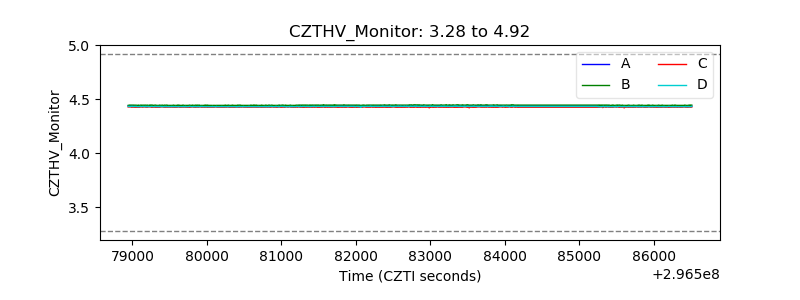 |
| D_VDD | 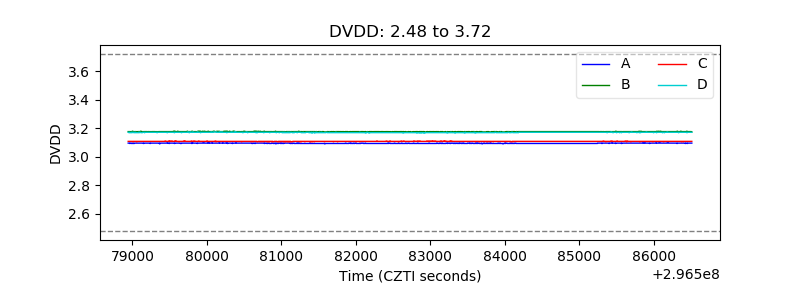 |
| Temperature 1 | 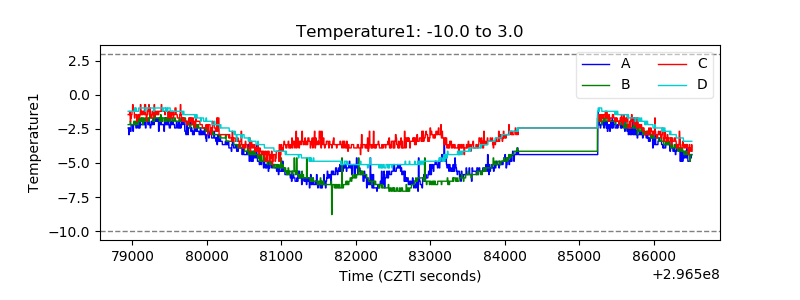 |
| Veto HV Monitor | 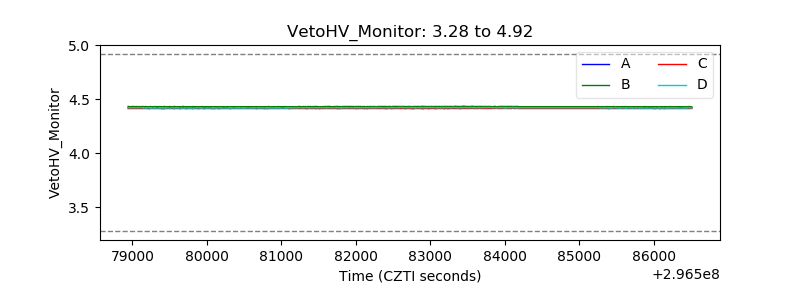 |
| Veto LLD | 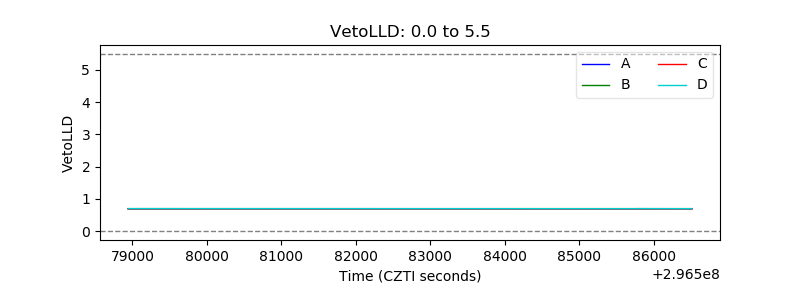 |
| Alpha Counter | 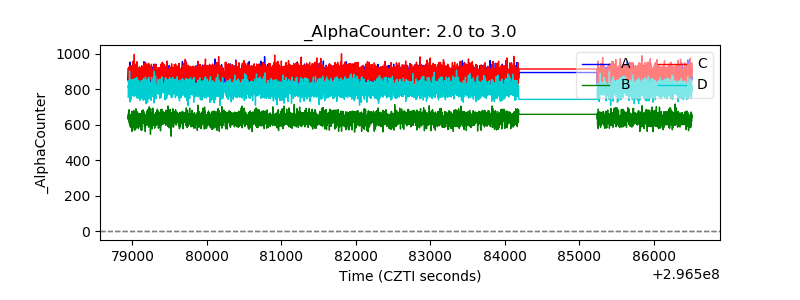 |
| _CPM_Rate |  |
| CZT Counter | 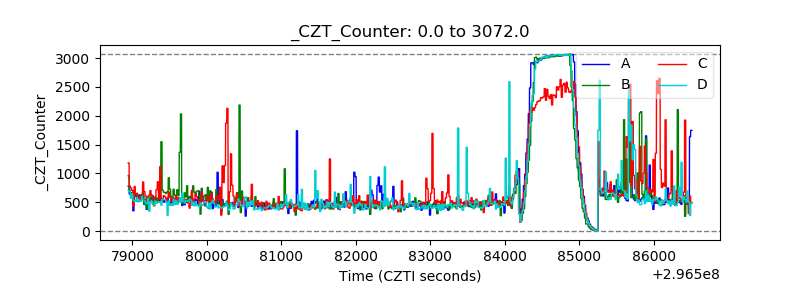 |
| +2.5 Volts monitor |  |
| +5 Volts monitor |  |
| _ROLL_ROT | 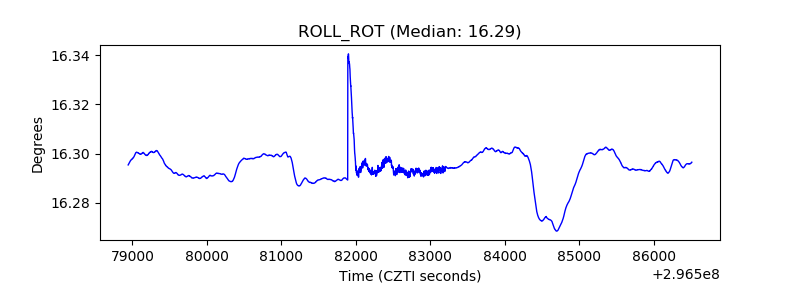 |
| _Roll_DEC | 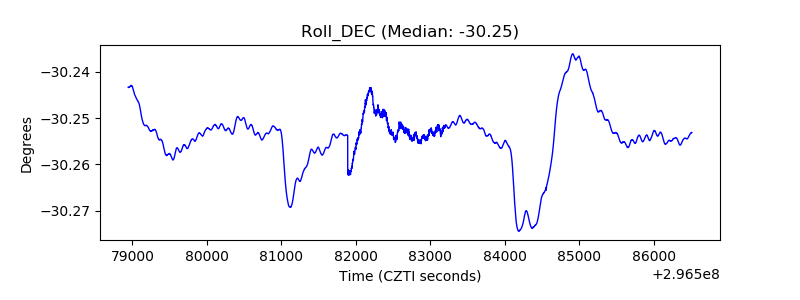 |
| _Roll_RA | 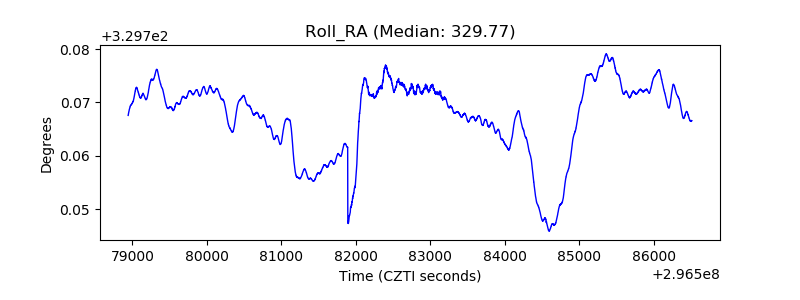 |
| Veto Counter | 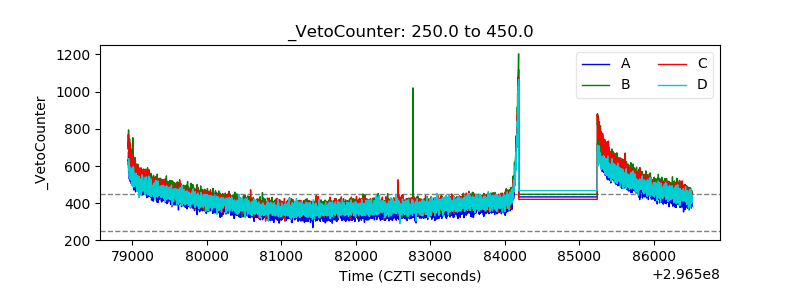 |