| Param | Original file | Final file |
|---|---|---|
| Filename | modeM0/AS1A05_117T01_9000002958_19784cztM0_level2.evt | modeM0/AS1A05_117T01_9000002958_19784cztM0_level2_quad_clean.evt |
| Size (bytes) | 847,281,600 | 144,178,560 |
| Size | 808.0 MB | 137.5 MB |
| Events in quadrant A | 6,119,208 | 935,216 |
| Events in quadrant B | 5,628,178 | 942,696 |
| Events in quadrant C | 7,372,725 | 877,310 |
| Events in quadrant D | 5,832,221 | 886,566 |
| Mode M9 | |||
|---|---|---|---|
| Quadrant | BADHDUFLAG | Total packets | Discarded packets |
| A | 0 | 23 | 0 |
| B | 0 | 23 | 0 |
| C | 0 | 23 | 0 |
| D | 0 | 23 | 0 |
| Mode M0 | |||
|---|---|---|---|
| Quadrant | BADHDUFLAG | Total packets | Discarded packets |
| A | 0 | 25179 | 2 |
| B | 0 | 23593 | 2 |
| C | 0 | 28708 | 2 |
| D | 0 | 24602 | 2 |
| Mode SS | |||
|---|---|---|---|
| Quadrant | BADHDUFLAG | Total packets | Discarded packets |
| A | 0 | 212 | 0 |
| B | 0 | 212 | 0 |
| C | 0 | 212 | 0 |
| D | 0 | 212 | 0 |
| Quadrant | Total seconds | Saturated seconds | Saturation percentage |
|---|---|---|---|
| A | 10468 | 196 | 1.872373% |
| B | 10468 | 288 | 2.751242% |
| C | 10468 | 818 | 7.814291% |
| D | 10469 | 188 | 1.795778% |
Noise dominated data is calculated using 1-second bins in cleaned event files. If a bin has >2000 counts, and if more than 50% of those come from <1% of pixels, then it is considered to be noise-dominated and hence unusable.
| Quadrant | # 1 sec bins | Bins with >0 counts | Bins with >2000 counts | High rate bins dominated by noise | Noise dominated (total time) | Noise dominated (detector-on time) | Marked lightcurve |
|---|---|---|---|---|---|---|---|
| A | 12708 | 10468 | 71 | 71 | 0.56% | 0.68% | 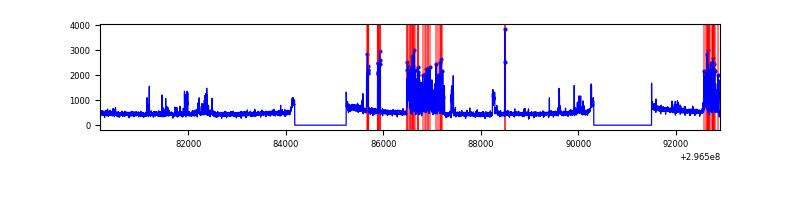 |
| B | 12708 | 10468 | 98 | 98 | 0.77% | 0.94% | 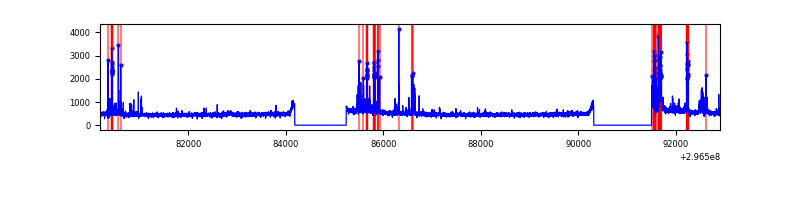 |
| C | 12708 | 10469 | 476 | 476 | 3.75% | 4.55% | 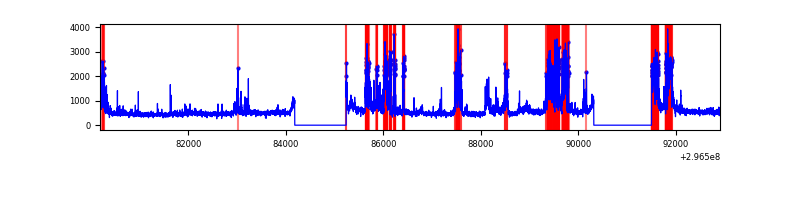 |
| D | 12709 | 10470 | 93 | 93 | 0.73% | 0.89% | 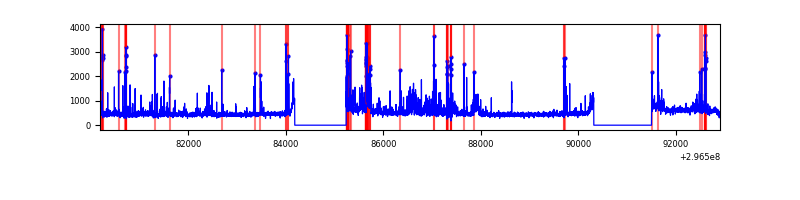 |
Top three noisy pixels from each quadrant. If the there are fewer than three noisy pixels in the level2.evt file, extra rows are filled as -1
| Pixel properties | Quadrant properties | ||||||
|---|---|---|---|---|---|---|---|
| Quadrant | DetID | PixID | Counts | Sigma | Mean | Median | Sigma |
| A | 0 | 23 | 625597 | 2370.87 | 1308 | 1279 | 263.3 |
| A | 15 | 192 | 245491 | 927.4 | 1308 | 1279 | 263.3 |
| A | 6 | 16 | 170612 | 643.05 | 1308 | 1279 | 263.3 |
| B | 7 | 220 | 228028 | 934.6 | 1298 | 1269 | 242.6 |
| B | 4 | 216 | 181042 | 740.94 | 1298 | 1269 | 242.6 |
| B | 0 | 197 | 113987 | 464.57 | 1298 | 1269 | 242.6 |
| C | 3 | 233 | 2387304 | 8464.51 | 1215 | 1226 | 281.9 |
| C | 14 | 238 | 196627 | 693.18 | 1215 | 1226 | 281.9 |
| C | 7 | 247 | 42292 | 145.68 | 1215 | 1226 | 281.9 |
| D | 1 | 52 | 702115 | 2280.69 | 1264 | 1227 | 307.3 |
| D | 12 | 218 | 159796 | 515.98 | 1264 | 1227 | 307.3 |
| D | 7 | 96 | 131215 | 422.98 | 1264 | 1227 | 307.3 |
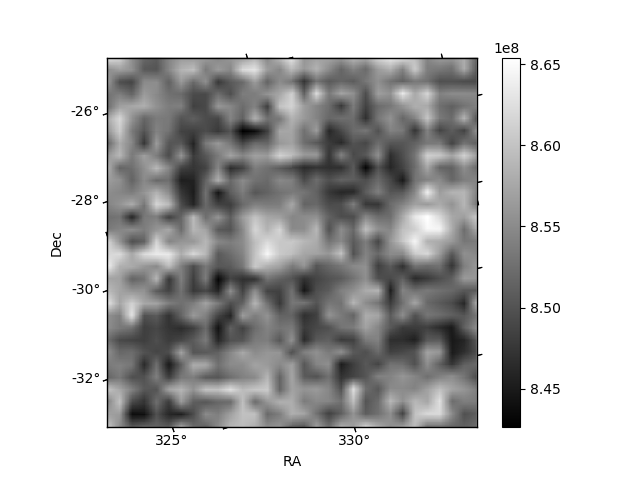
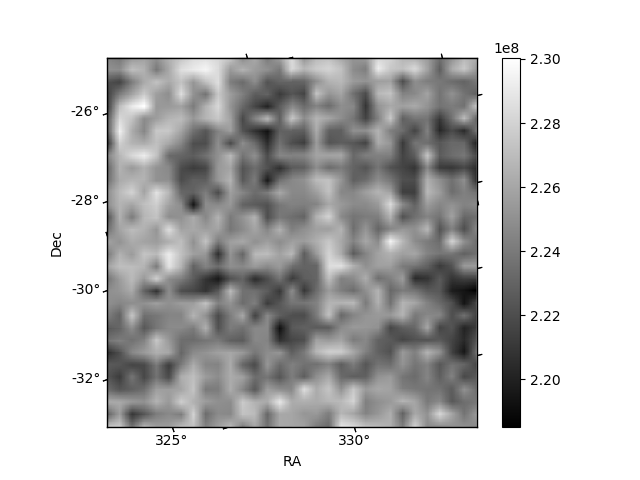
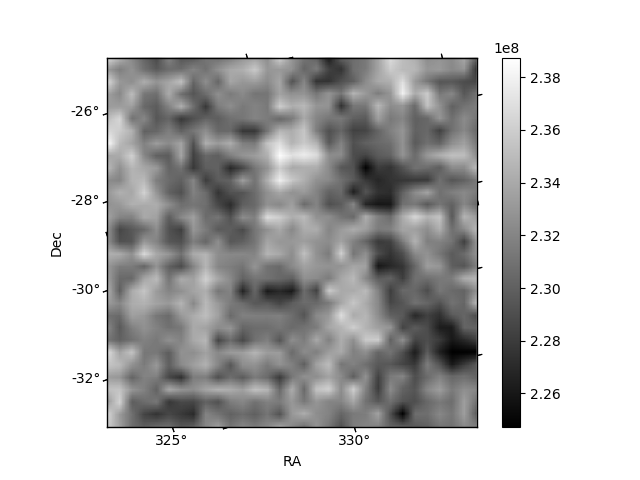
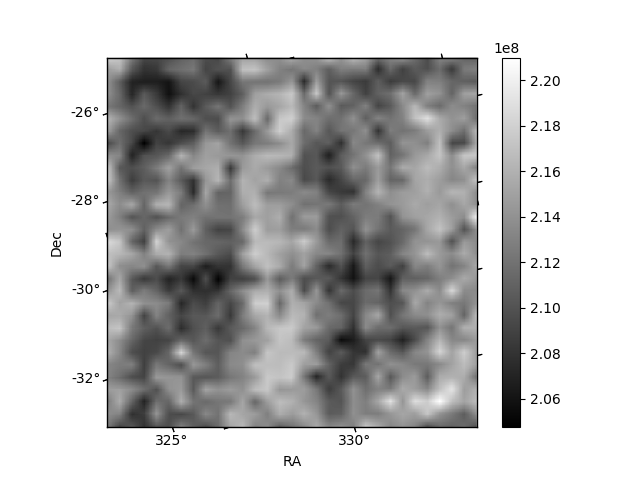
Histogram calculated using DETX and DETY for each event in the final _common_clean file
| Quadrant A | 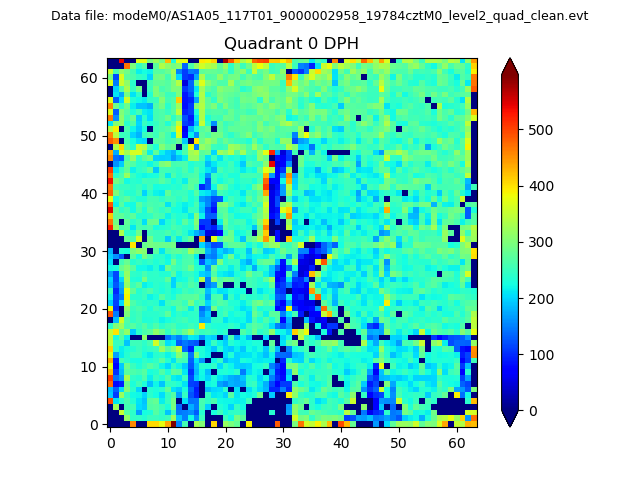 |
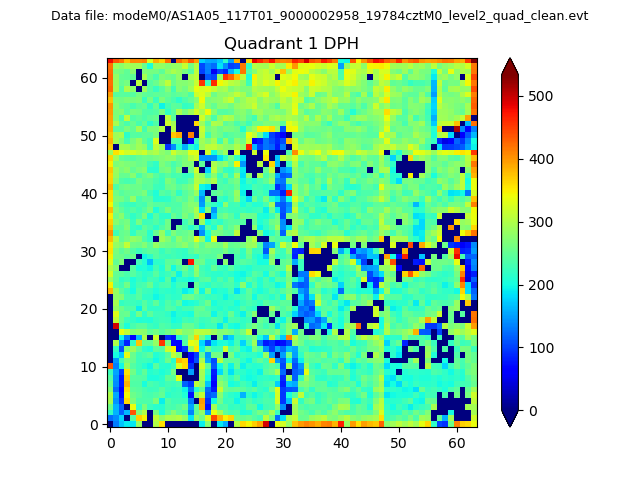 |
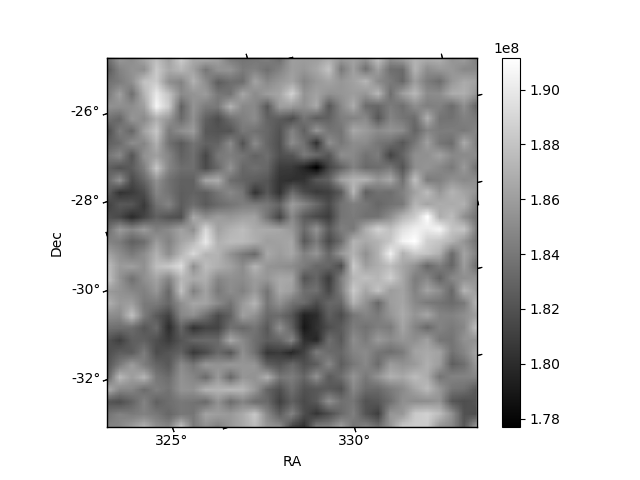
Quadrant B |
|---|---|---|---|
| Quadrant D |  |
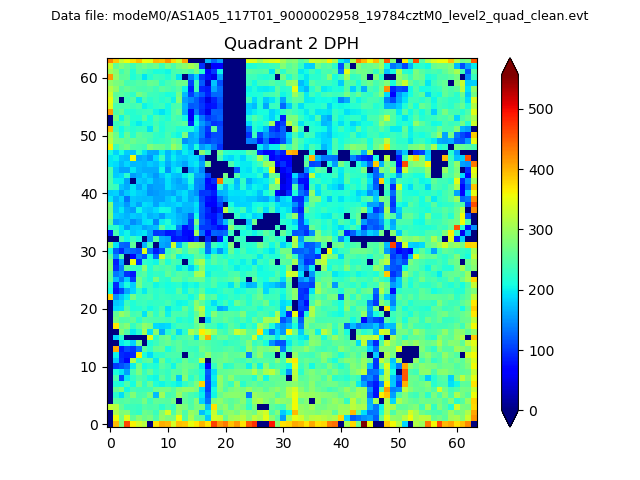 |
Quadrant C |
| Plot type | Count rate plots | Images |
|---|---|---|
| Comparison with Poisson distribution Blue bars denote a histogram of data divided into 1 sec bins. Red curve is a Poisson curve with rate = median count rate of data. |
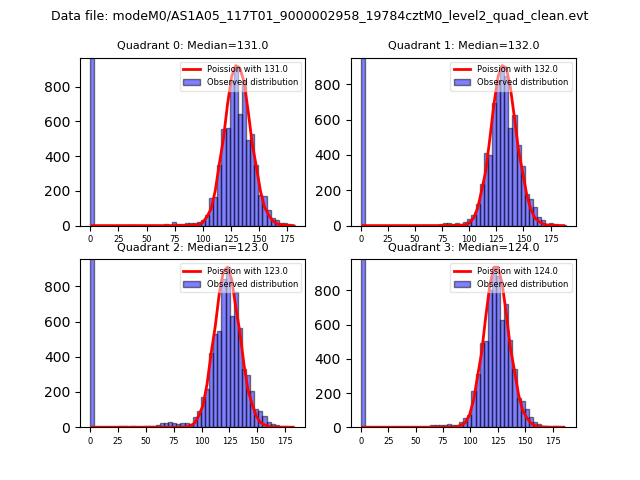 |
 |
| Quadrant-wise count rates Data is divided into 100 sec bins |
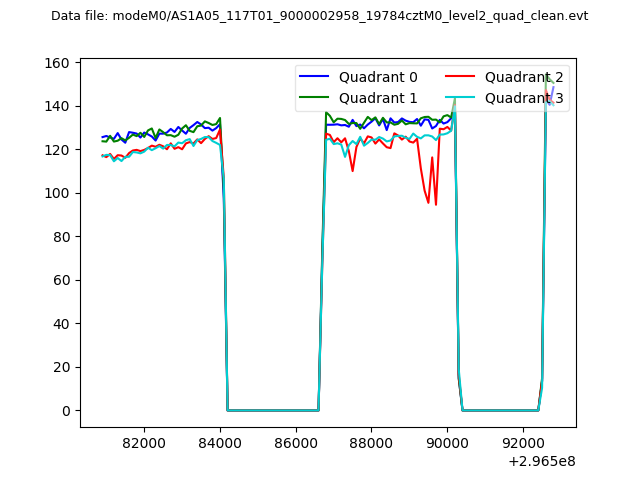 |
|
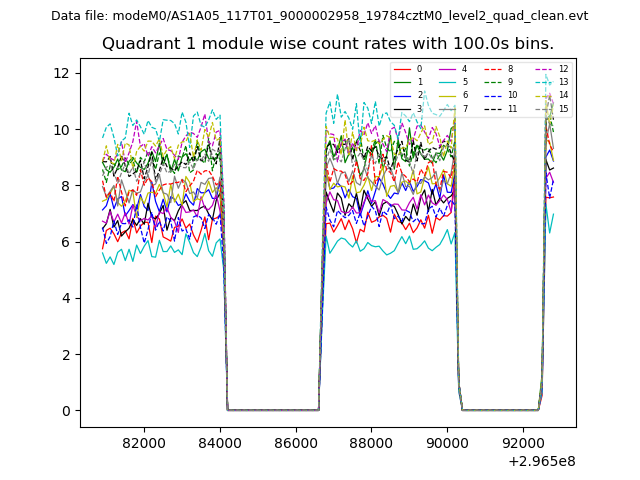
| Module-wise count rates for Quadrant A Data is divided into 100 sec bins |
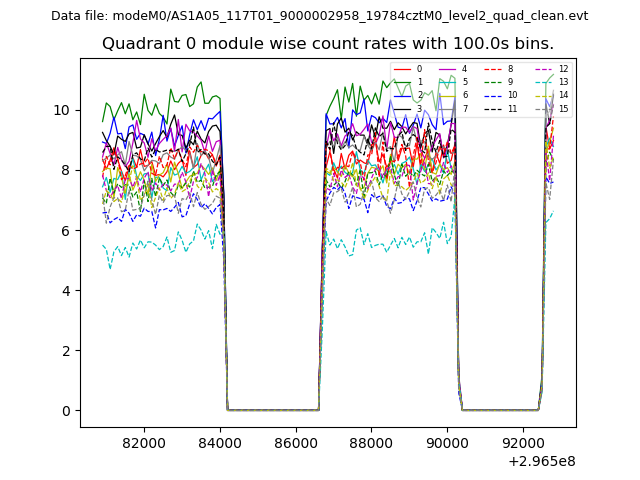 |
 |
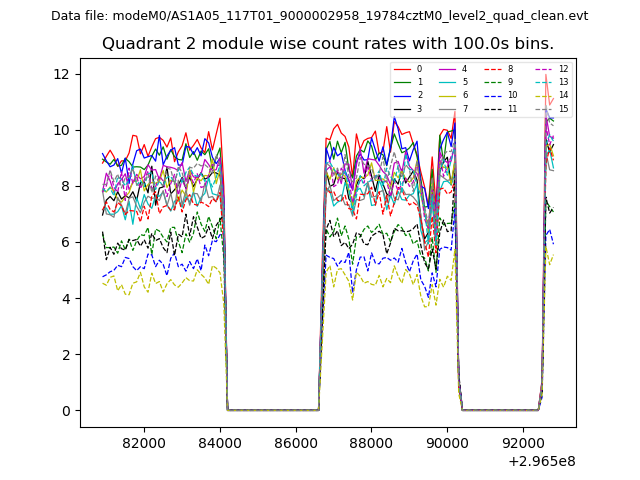
| Module-wise count rates for Quadrant B Data is divided into 100 sec bins |
 |
 |
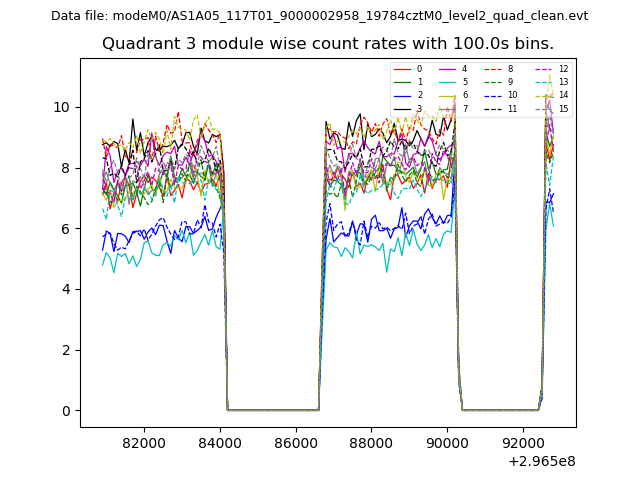
| Module-wise count rates for Quadrant C Data is divided into 100 sec bins |
 |
 |
| Module-wise count rates for Quadrant D Data is divided into 100 sec bins |
 |
 |
| Parameter | Plot |
|---|---|
| CZT HV Monitor | 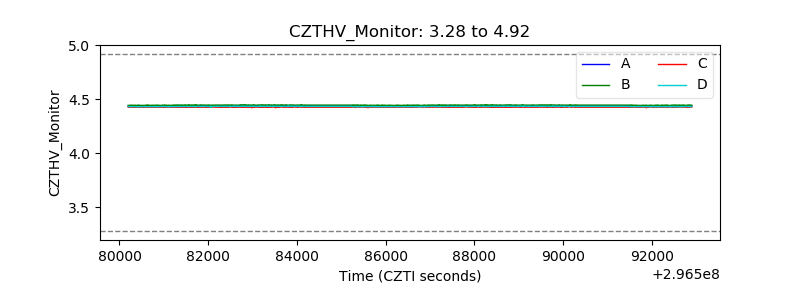 |
| D_VDD | 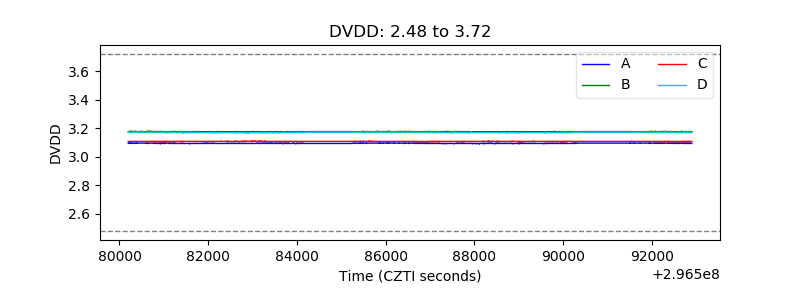 |
| Temperature 1 | 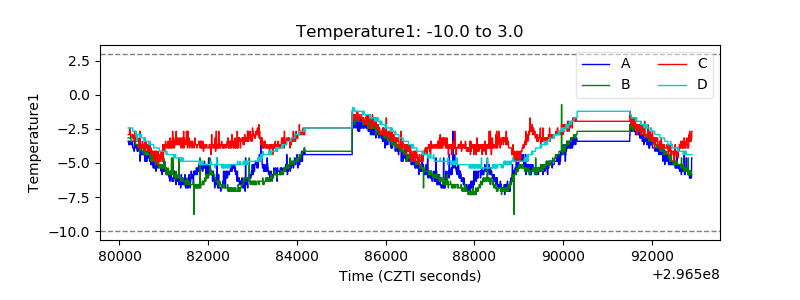 |
| Veto HV Monitor |  |
| Veto LLD | 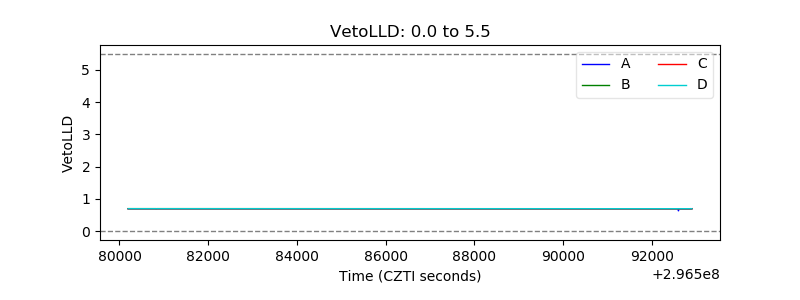 |
| Alpha Counter | 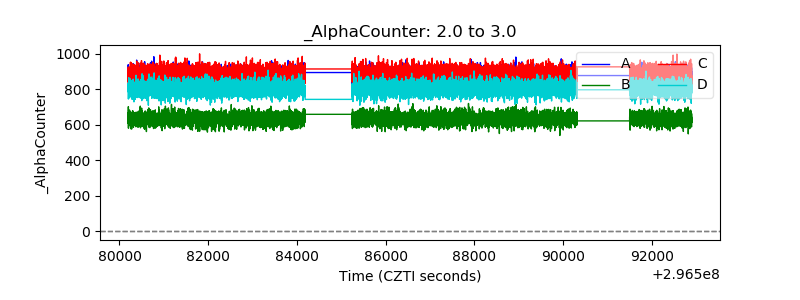 |
| _CPM_Rate | 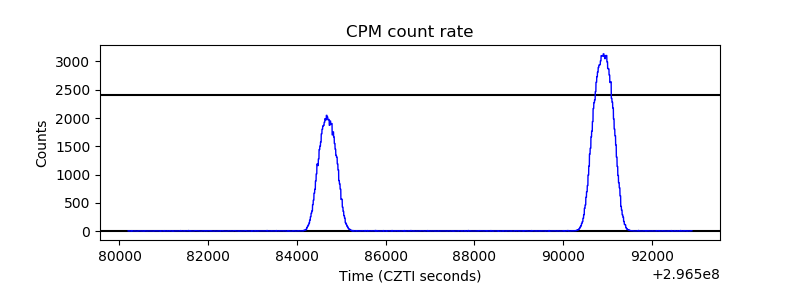 |
| CZT Counter |  |
| +2.5 Volts monitor |  |
| +5 Volts monitor |  |
| _ROLL_ROT | 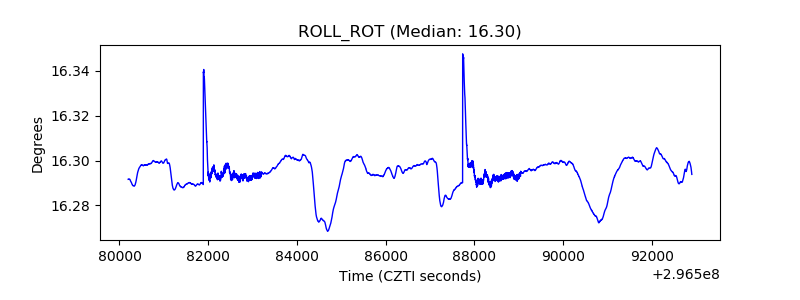 |
| _Roll_DEC | 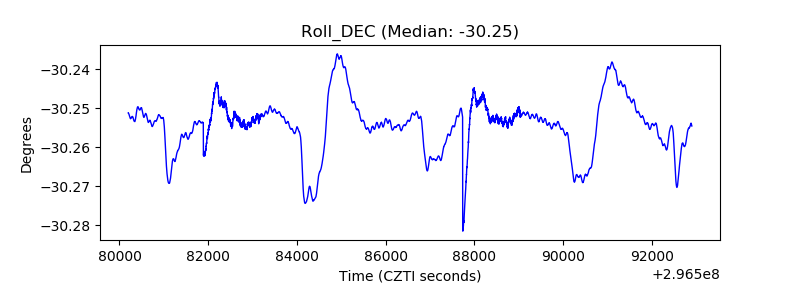 |
| _Roll_RA | 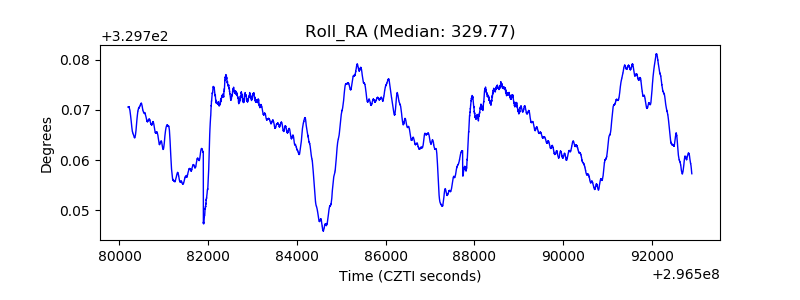 |
| Veto Counter | 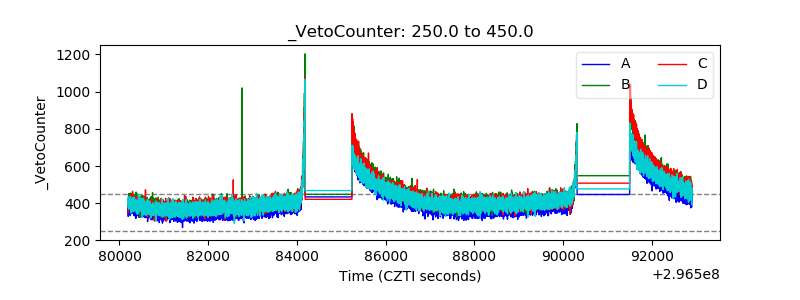 |