| Param | Original file | Final file |
|---|---|---|
| Filename | modeM0/AS1A05_117T01_9000002958_19786cztM0_level2.evt | modeM0/AS1A05_117T01_9000002958_19786cztM0_level2_quad_clean.evt |
| Size (bytes) | 468,354,240 | 103,296,960 |
| Size | 446.7 MB | 98.5 MB |
| Events in quadrant A | 3,185,906 | 690,378 |
| Events in quadrant B | 3,374,389 | 705,191 |
| Events in quadrant C | 3,440,075 | 663,413 |
| Events in quadrant D | 3,773,746 | 647,687 |
| Mode M9 | |||
|---|---|---|---|
| Quadrant | BADHDUFLAG | Total packets | Discarded packets |
| A | 0 | 25 | 0 |
| B | 0 | 26 | 0 |
| C | 0 | 26 | 0 |
| D | 0 | 26 | 0 |
| Mode M0 | |||
|---|---|---|---|
| Quadrant | BADHDUFLAG | Total packets | Discarded packets |
| A | 0 | 13236 | 3 |
| B | 0 | 13869 | 2 |
| C | 0 | 13995 | 2 |
| D | 0 | 15254 | 2 |
| Mode SS | |||
|---|---|---|---|
| Quadrant | BADHDUFLAG | Total packets | Discarded packets |
| A | 0 | 122 | 0 |
| B | 0 | 122 | 0 |
| C | 0 | 122 | 0 |
| D | 0 | 122 | 0 |
| Quadrant | Total seconds | Saturated seconds | Saturation percentage |
|---|---|---|---|
| A | 6042 | 61 | 1.009599% |
| B | 6042 | 127 | 2.101953% |
| C | 6042 | 114 | 1.886792% |
| D | 6042 | 137 | 2.267461% |
Noise dominated data is calculated using 1-second bins in cleaned event files. If a bin has >2000 counts, and if more than 50% of those come from <1% of pixels, then it is considered to be noise-dominated and hence unusable.
| Quadrant | # 1 sec bins | Bins with >0 counts | Bins with >2000 counts | High rate bins dominated by noise | Noise dominated (total time) | Noise dominated (detector-on time) | Marked lightcurve |
|---|---|---|---|---|---|---|---|
| A | 7392 | 6043 | 1 | 1 | 0.01% | 0.02% | 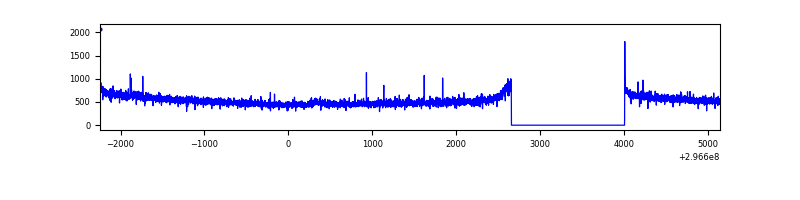 |
| B | 7392 | 6043 | 29 | 29 | 0.39% | 0.48% | 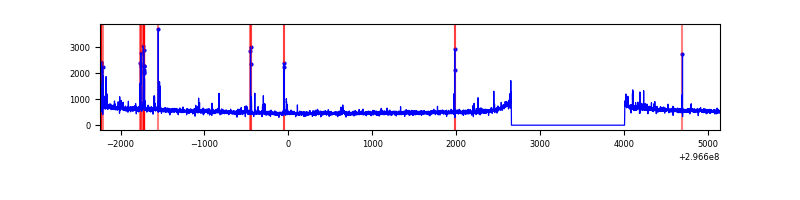 |
| C | 7392 | 6042 | 13 | 13 | 0.18% | 0.22% | 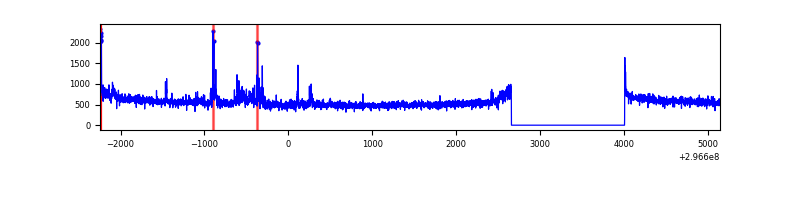 |
| D | 7392 | 6043 | 71 | 71 | 0.96% | 1.17% | 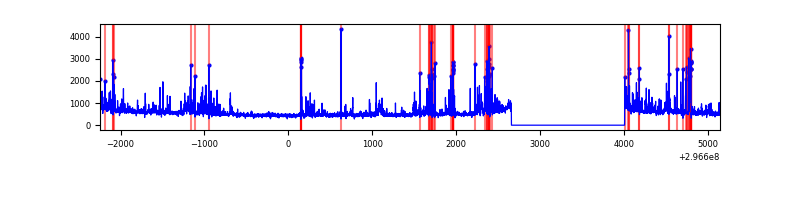 |
Top three noisy pixels from each quadrant. If the there are fewer than three noisy pixels in the level2.evt file, extra rows are filled as -1
| Pixel properties | Quadrant properties | ||||||
|---|---|---|---|---|---|---|---|
| Quadrant | DetID | PixID | Counts | Sigma | Mean | Median | Sigma |
| A | 6 | 16 | 26078 | 155.34 | 818 | 802 | 162.7 |
| A | 8 | 192 | 7776 | 42.86 | 818 | 802 | 162.7 |
| A | 0 | 226 | 7136 | 38.93 | 818 | 802 | 162.7 |
| B | 7 | 220 | 85354 | 564.71 | 819 | 803 | 149.7 |
| B | 0 | 197 | 29742 | 193.28 | 819 | 803 | 149.7 |
| B | 3 | 64 | 21700 | 139.57 | 819 | 803 | 149.7 |
| C | 3 | 233 | 219580 | 1200.78 | 791 | 798 | 182.2 |
| C | 14 | 238 | 125306 | 683.36 | 791 | 798 | 182.2 |
| C | 7 | 247 | 12069 | 61.86 | 791 | 798 | 182.2 |
| D | 1 | 52 | 719603 | 3750.04 | 796 | 775 | 191.7 |
| D | 12 | 218 | 32813 | 167.14 | 796 | 775 | 191.7 |
| D | 2 | 234 | 24730 | 124.97 | 796 | 775 | 191.7 |
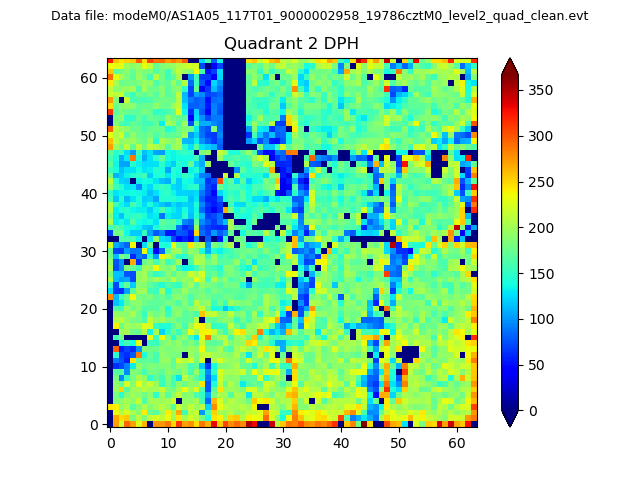
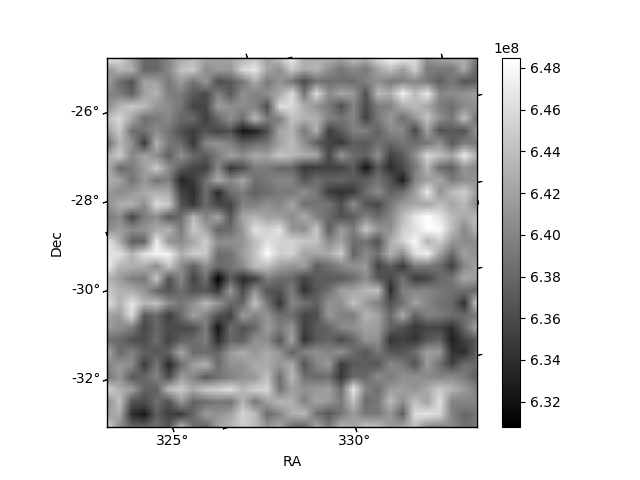
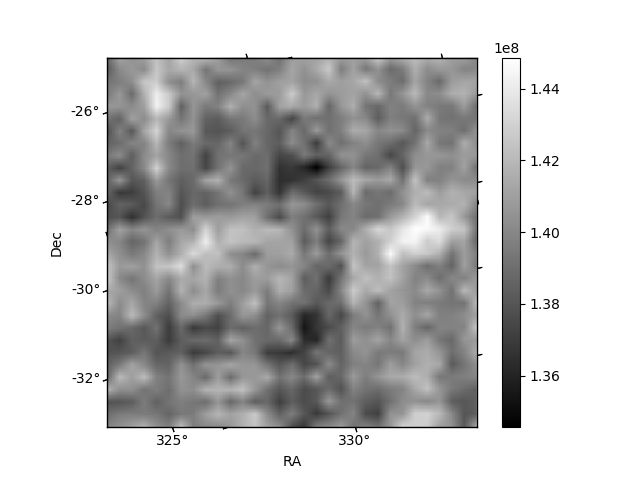
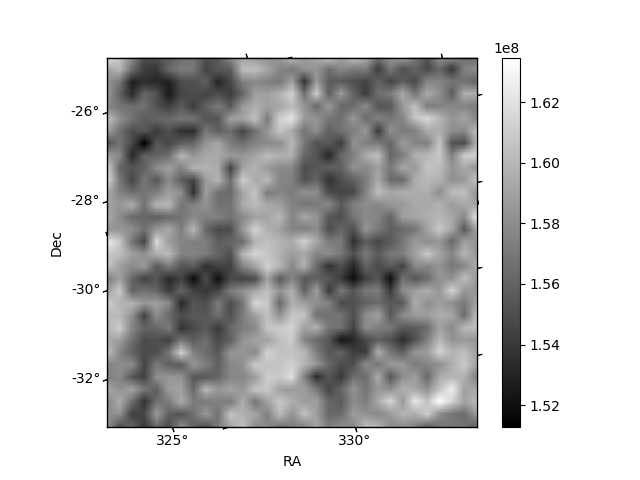
Histogram calculated using DETX and DETY for each event in the final _common_clean file
| Quadrant A | 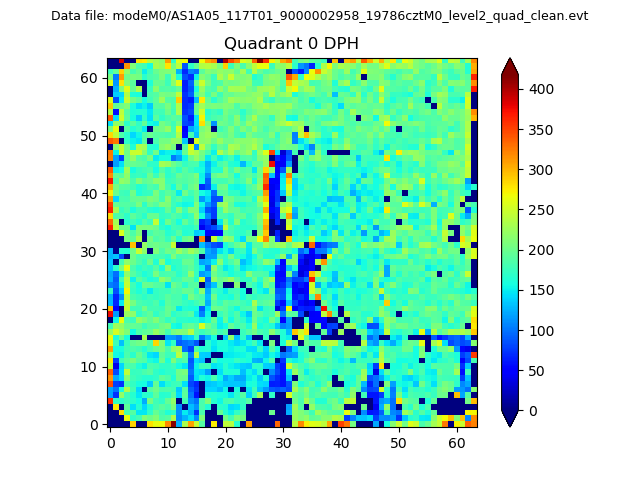 |
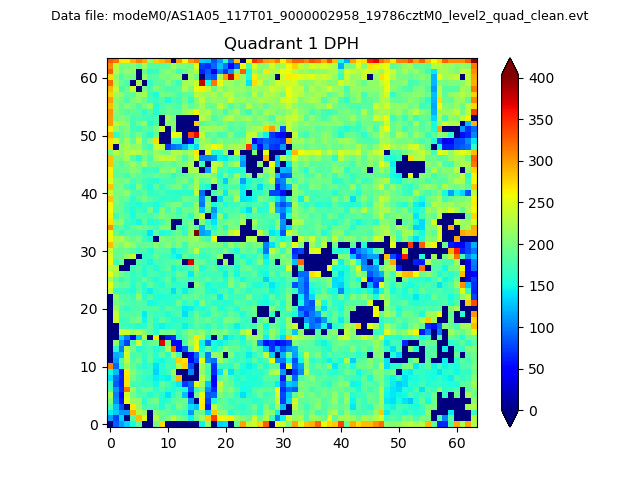 |
Quadrant B |
|---|---|---|---|
| Quadrant D | 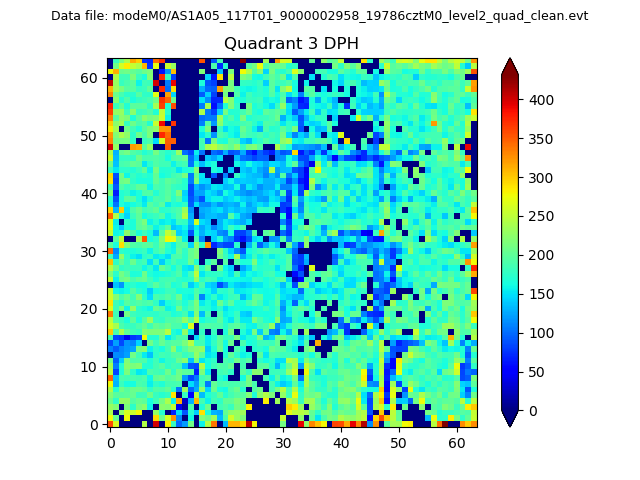 |
 |
Quadrant C |
| Plot type | Count rate plots | Images |
|---|---|---|
| Comparison with Poisson distribution Blue bars denote a histogram of data divided into 1 sec bins. Red curve is a Poisson curve with rate = median count rate of data. |
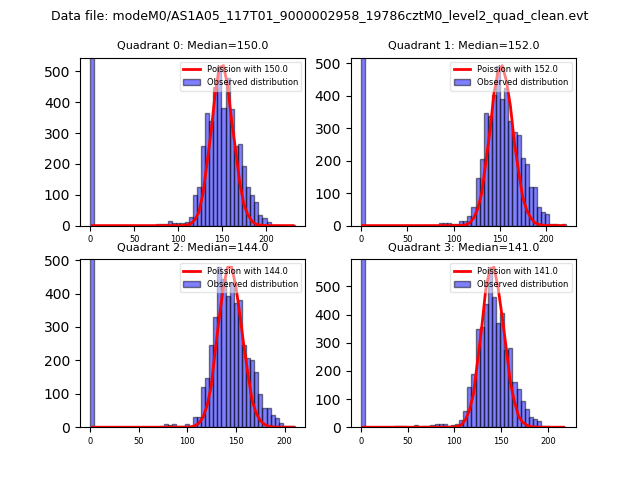 |
 |
| Quadrant-wise count rates Data is divided into 100 sec bins |
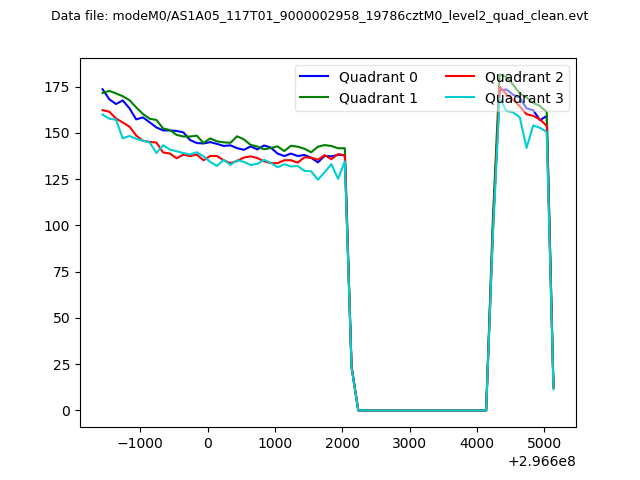 |
|
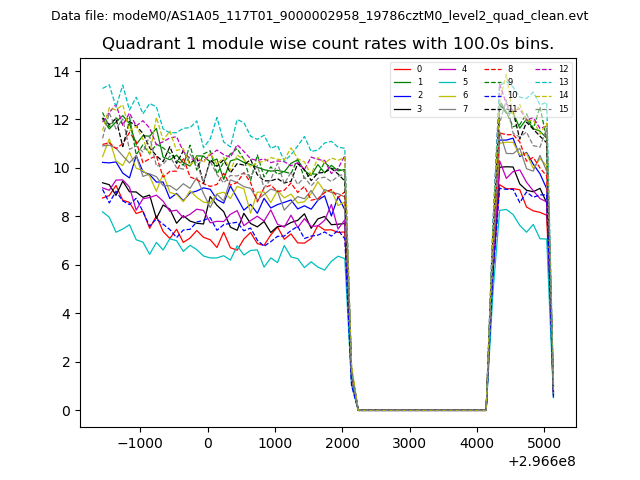
| Module-wise count rates for Quadrant A Data is divided into 100 sec bins |
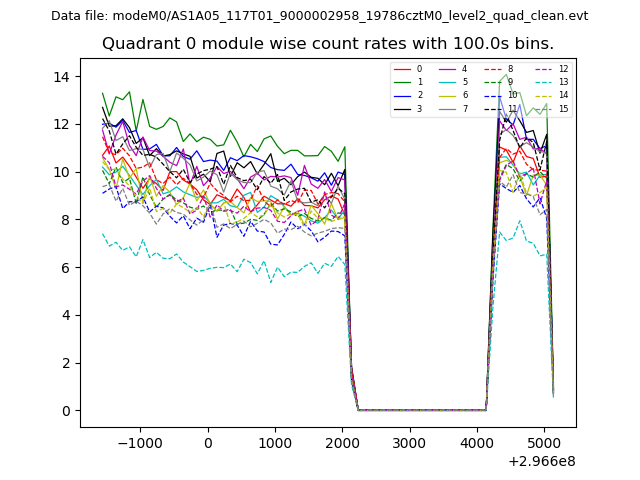 |
 |
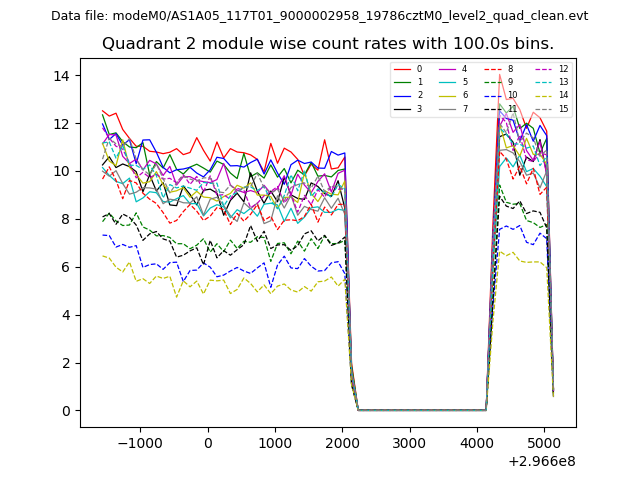
| Module-wise count rates for Quadrant B Data is divided into 100 sec bins |
 |
 |
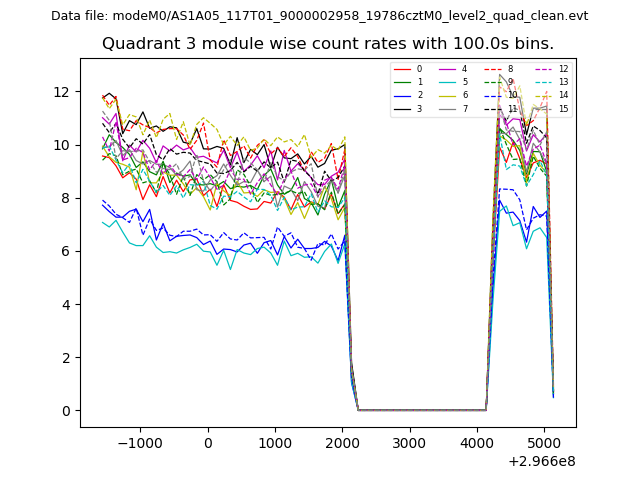
| Module-wise count rates for Quadrant C Data is divided into 100 sec bins |
 |
 |
| Module-wise count rates for Quadrant D Data is divided into 100 sec bins |
 |
 |
| Parameter | Plot |
|---|---|
| CZT HV Monitor |  |
| D_VDD | 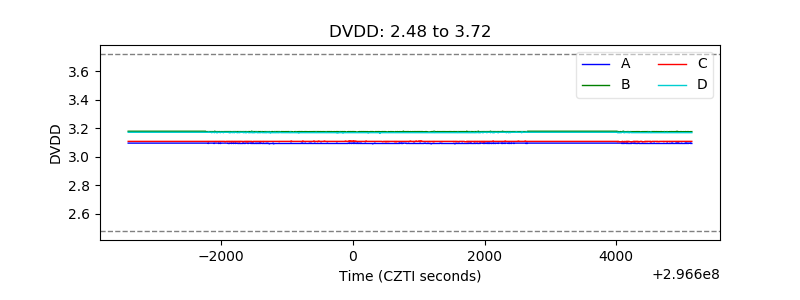 |
| Temperature 1 | 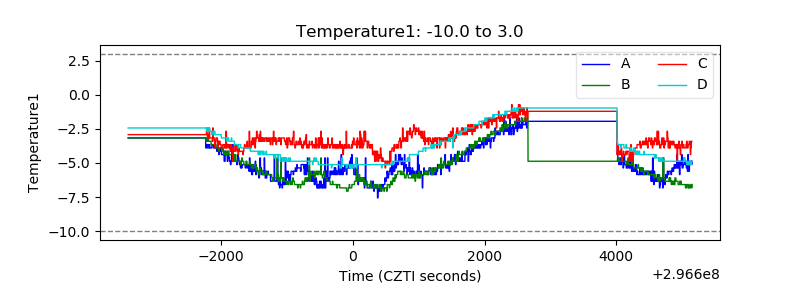 |
| Veto HV Monitor | 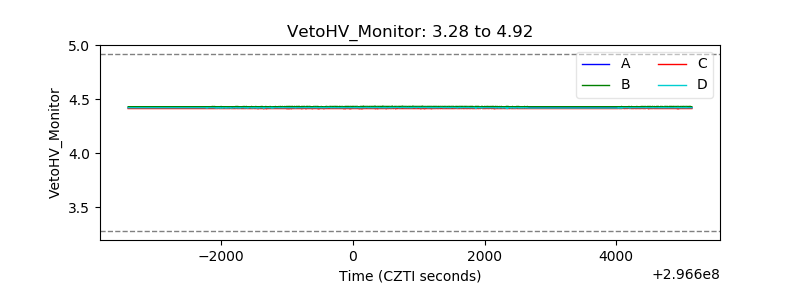 |
| Veto LLD | 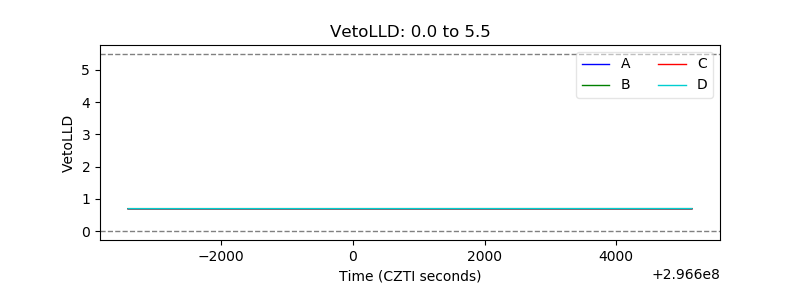 |
| Alpha Counter | 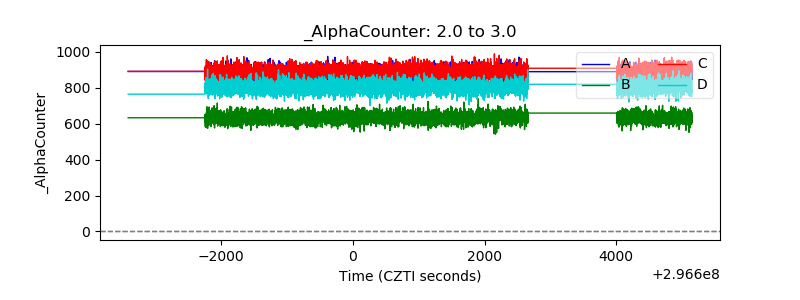 |
| _CPM_Rate | 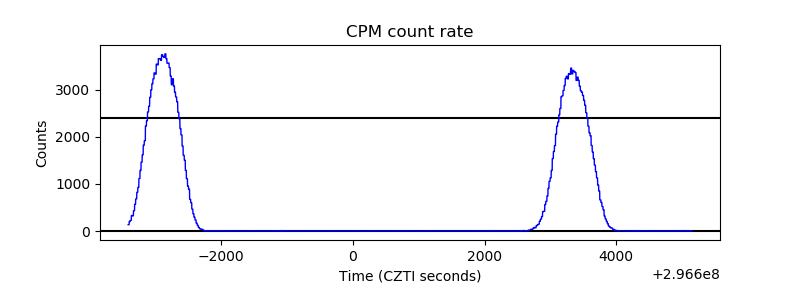 |
| CZT Counter | 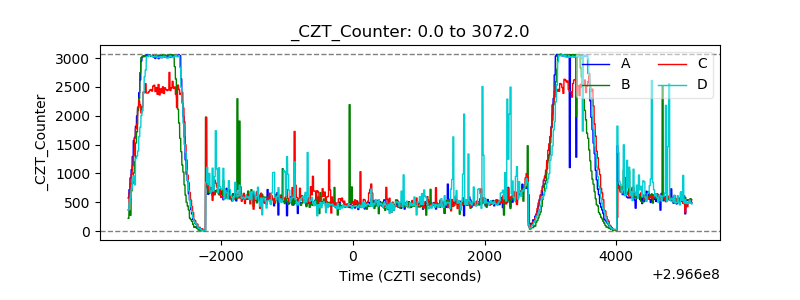 |
| +2.5 Volts monitor |  |
| +5 Volts monitor |  |
| _ROLL_ROT | 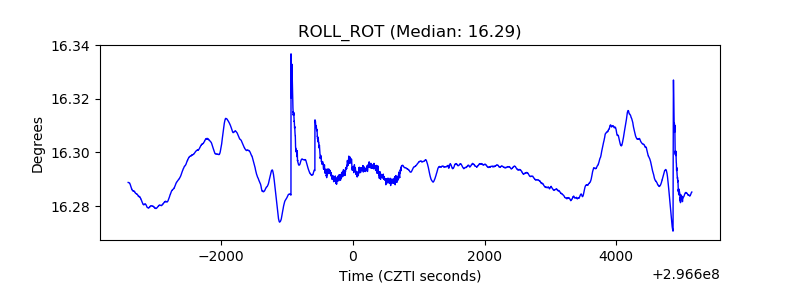 |
| _Roll_DEC | 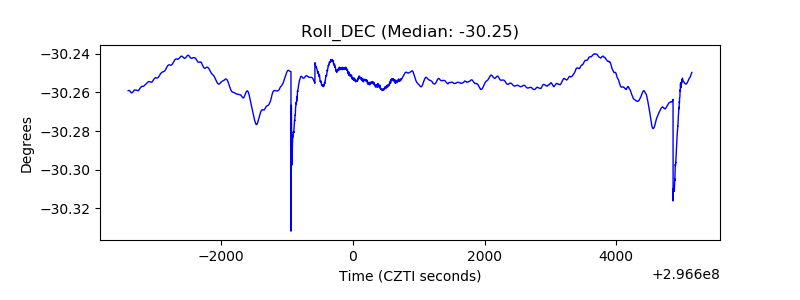 |
| _Roll_RA | 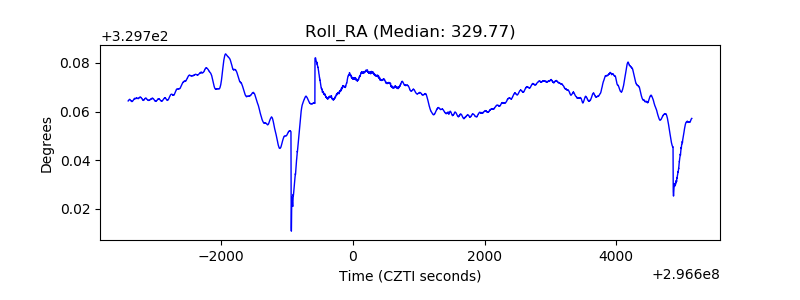 |
| Veto Counter | 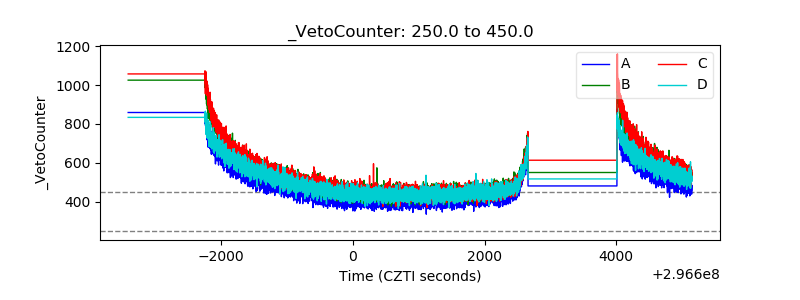 |