| Param | Original file | Final file |
|---|---|---|
| Filename | modeM0/AS1A05_117T01_9000002958_19787cztM0_level2.evt | modeM0/AS1A05_117T01_9000002958_19787cztM0_level2_quad_clean.evt |
| Size (bytes) | 533,568,960 | 111,706,560 |
| Size | 508.9 MB | 106.5 MB |
| Events in quadrant A | 3,140,257 | 753,421 |
| Events in quadrant B | 3,328,450 | 774,433 |
| Events in quadrant C | 4,977,796 | 722,528 |
| Events in quadrant D | 4,295,213 | 702,936 |
| Mode M9 | |||
|---|---|---|---|
| Quadrant | BADHDUFLAG | Total packets | Discarded packets |
| A | 0 | 24 | 0 |
| B | 0 | 25 | 0 |
| C | 0 | 25 | 0 |
| D | 0 | 25 | 0 |
| Mode M0 | |||
|---|---|---|---|
| Quadrant | BADHDUFLAG | Total packets | Discarded packets |
| A | 0 | 13112 | 2 |
| B | 0 | 13718 | 2 |
| C | 0 | 18737 | 2 |
| D | 0 | 16894 | 5 |
| Mode SS | |||
|---|---|---|---|
| Quadrant | BADHDUFLAG | Total packets | Discarded packets |
| A | 0 | 124 | 0 |
| B | 0 | 124 | 0 |
| C | 0 | 124 | 0 |
| D | 0 | 124 | 0 |
| Quadrant | Total seconds | Saturated seconds | Saturation percentage |
|---|---|---|---|
| A | 6163 | 25 | 0.405647% |
| B | 6163 | 85 | 1.379198% |
| C | 6163 | 611 | 9.914003% |
| D | 6162 | 243 | 3.943525% |
Noise dominated data is calculated using 1-second bins in cleaned event files. If a bin has >2000 counts, and if more than 50% of those come from <1% of pixels, then it is considered to be noise-dominated and hence unusable.
| Quadrant | # 1 sec bins | Bins with >0 counts | Bins with >2000 counts | High rate bins dominated by noise | Noise dominated (total time) | Noise dominated (detector-on time) | Marked lightcurve |
|---|---|---|---|---|---|---|---|
| A | 7548 | 6164 | 1 | 1 | 0.01% | 0.02% | 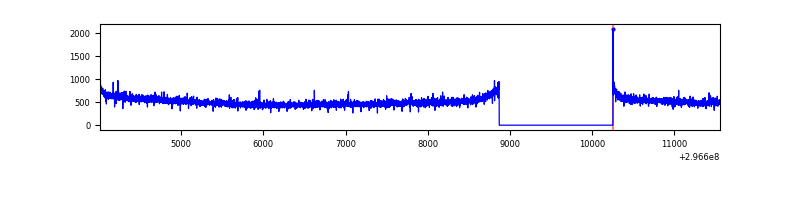 |
| B | 7548 | 6164 | 16 | 16 | 0.21% | 0.26% | 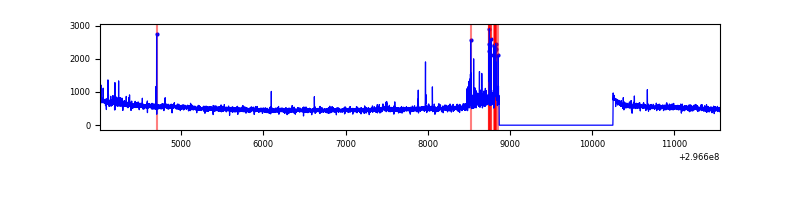 |
| C | 7548 | 6164 | 350 | 350 | 4.64% | 5.68% | 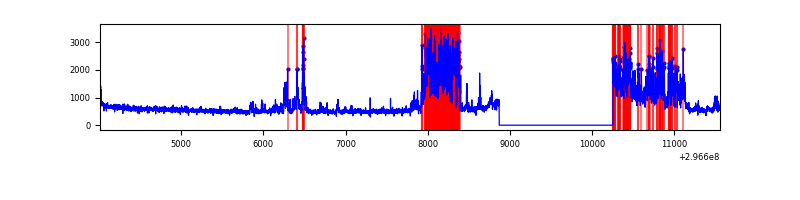 |
| D | 7547 | 6163 | 208 | 208 | 2.76% | 3.37% | 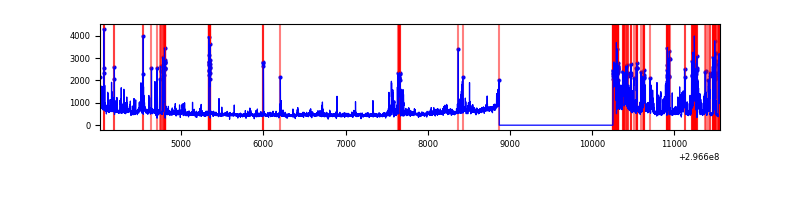 |
Top three noisy pixels from each quadrant. If the there are fewer than three noisy pixels in the level2.evt file, extra rows are filled as -1
| Pixel properties | Quadrant properties | ||||||
|---|---|---|---|---|---|---|---|
| Quadrant | DetID | PixID | Counts | Sigma | Mean | Median | Sigma |
| A | 6 | 16 | 12145 | 69.68 | 810 | 794 | 162.9 |
| A | 8 | 192 | 8437 | 46.92 | 810 | 794 | 162.9 |
| A | 0 | 226 | 6935 | 37.7 | 810 | 794 | 162.9 |
| B | 7 | 220 | 83187 | 553.71 | 813 | 797 | 148.8 |
| B | 4 | 216 | 25913 | 168.79 | 813 | 797 | 148.8 |
| B | 12 | 111 | 17555 | 112.62 | 813 | 797 | 148.8 |
| C | 3 | 233 | 1834559 | 10316.65 | 774 | 782 | 177.7 |
| C | 14 | 238 | 120696 | 674.62 | 774 | 782 | 177.7 |
| C | 13 | 61 | 5338 | 25.63 | 774 | 782 | 177.7 |
| D | 1 | 52 | 938305 | 4945.81 | 787 | 767 | 189.6 |
| D | 12 | 218 | 192756 | 1012.8 | 787 | 767 | 189.6 |
| D | 2 | 184 | 148661 | 780.19 | 787 | 767 | 189.6 |
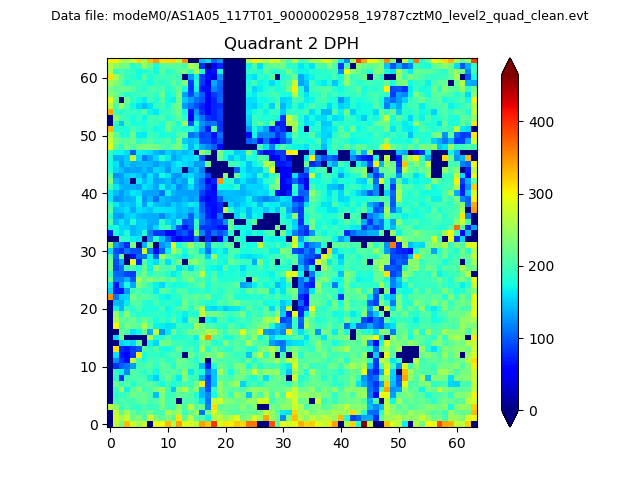
Histogram calculated using DETX and DETY for each event in the final _common_clean file
| Quadrant A | 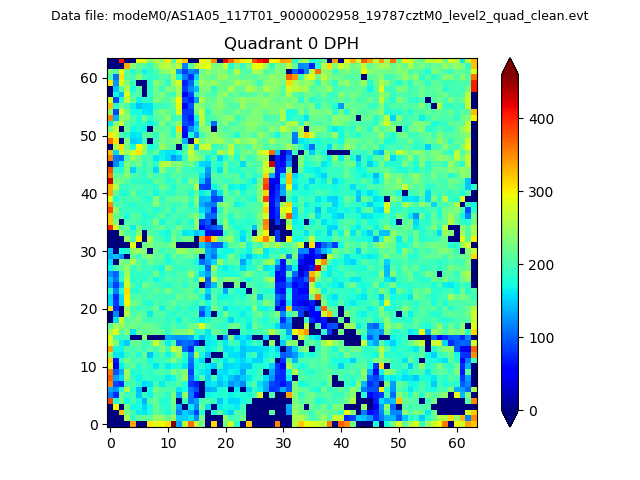 |
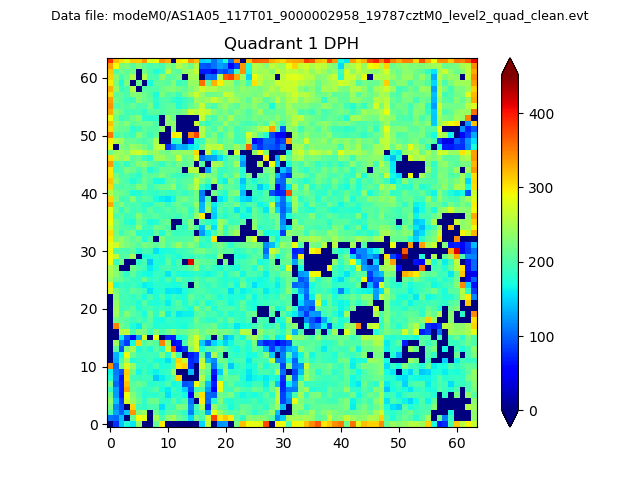 |
Quadrant B |
|---|---|---|---|
| Quadrant D | 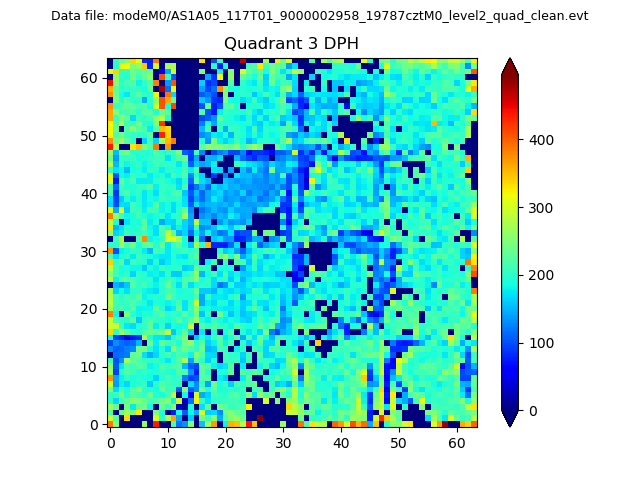 |
 |
Quadrant C |
| Plot type | Count rate plots | Images |
|---|---|---|
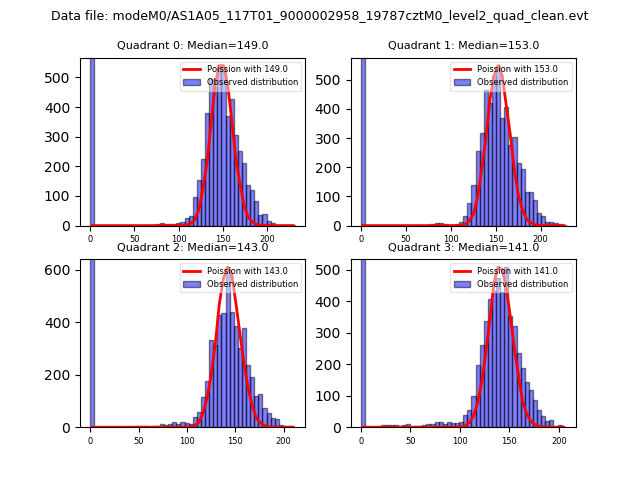
| Comparison with Poisson distribution Blue bars denote a histogram of data divided into 1 sec bins. Red curve is a Poisson curve with rate = median count rate of data. |
 |
 |
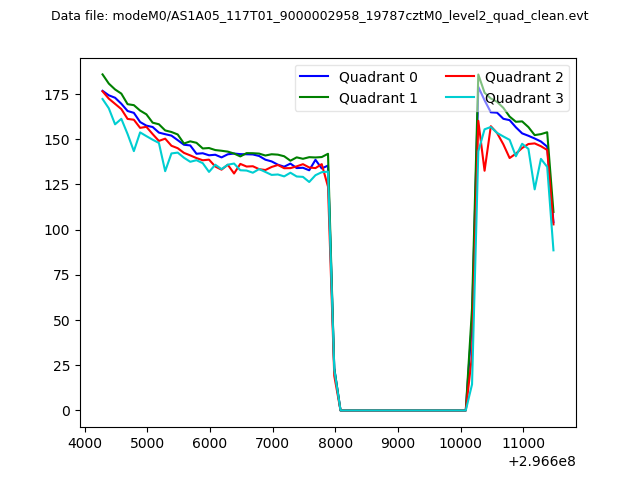
| Quadrant-wise count rates Data is divided into 100 sec bins |
 |
|
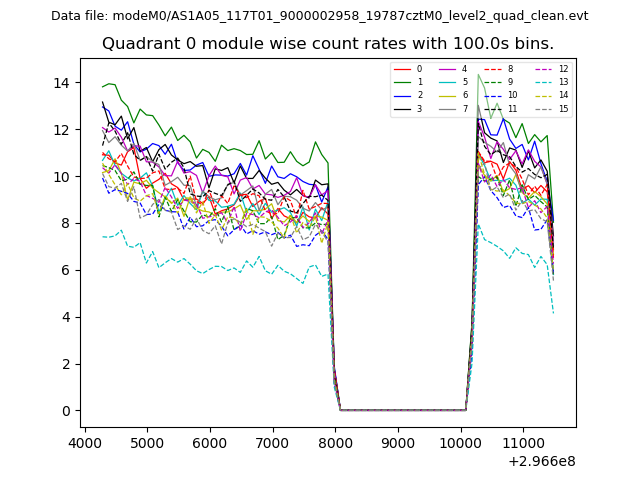
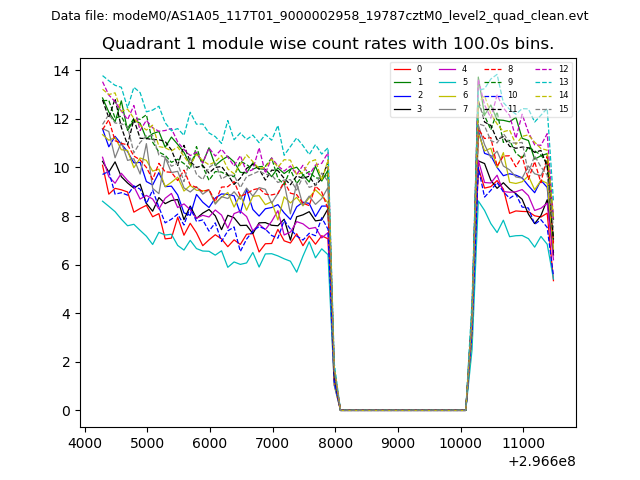
| Module-wise count rates for Quadrant A Data is divided into 100 sec bins |
 |
 |
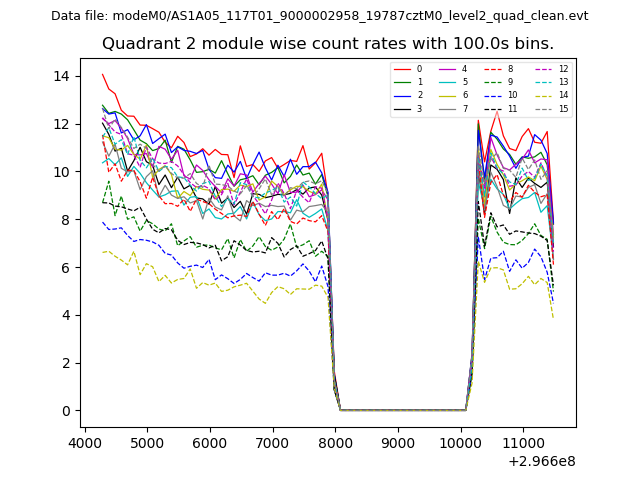
| Module-wise count rates for Quadrant B Data is divided into 100 sec bins |
 |
 |
| Module-wise count rates for Quadrant C Data is divided into 100 sec bins |
 |
 |
| Module-wise count rates for Quadrant D Data is divided into 100 sec bins |
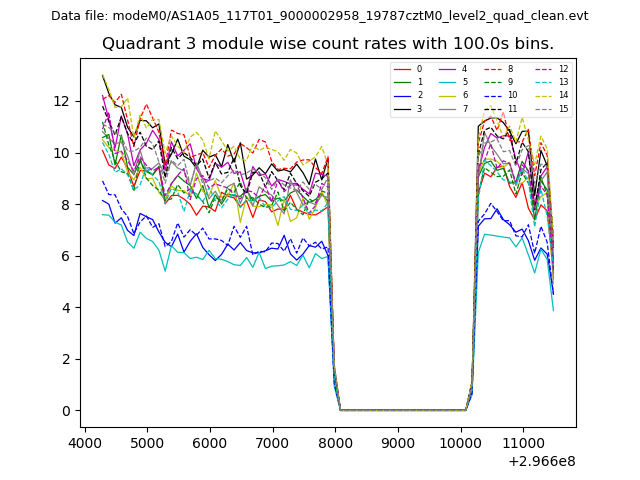 |
 |
| Parameter | Plot |
|---|---|
| CZT HV Monitor | 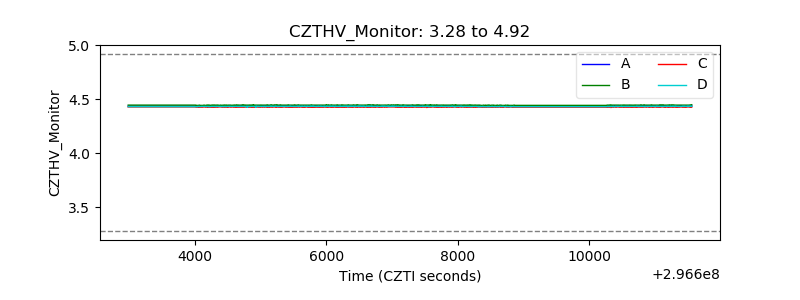 |
| D_VDD | 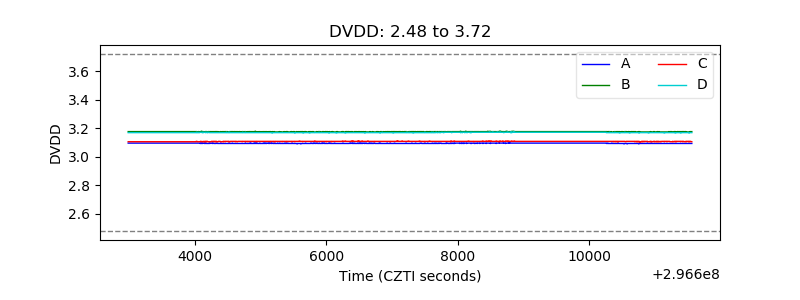 |
| Temperature 1 | 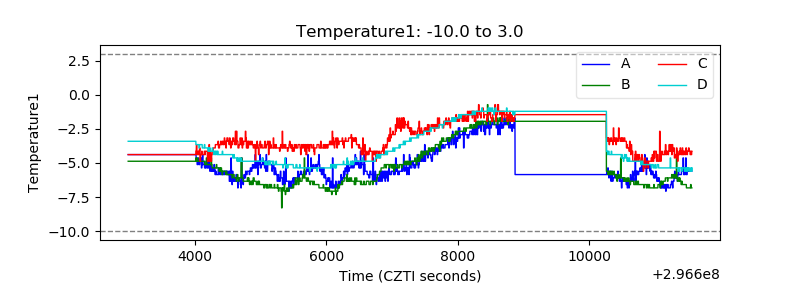 |
| Veto HV Monitor | 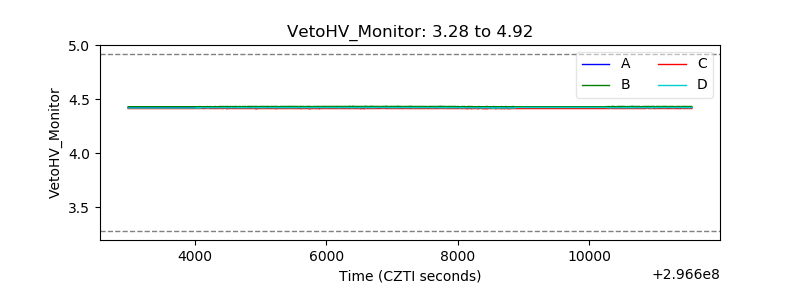 |
| Veto LLD | 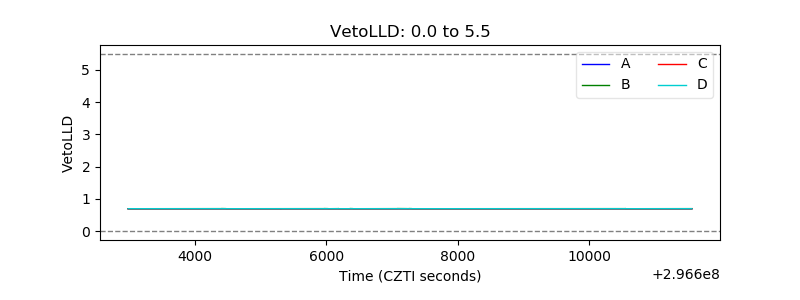 |
| Alpha Counter | 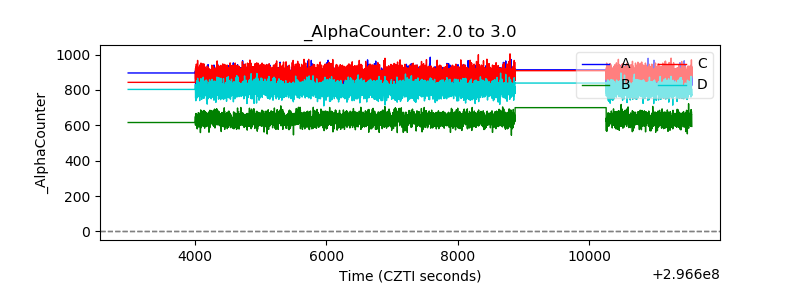 |
| _CPM_Rate | 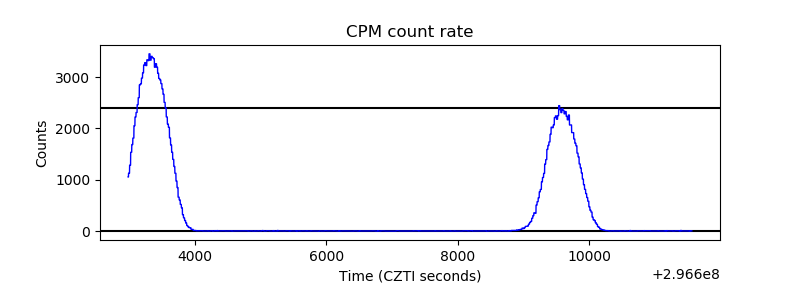 |
| CZT Counter | 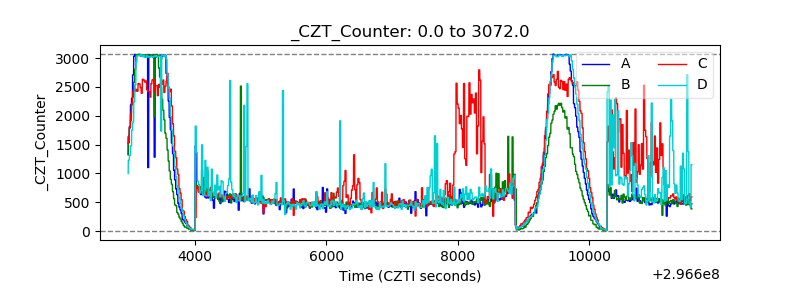 |
| +2.5 Volts monitor |  |
| +5 Volts monitor | 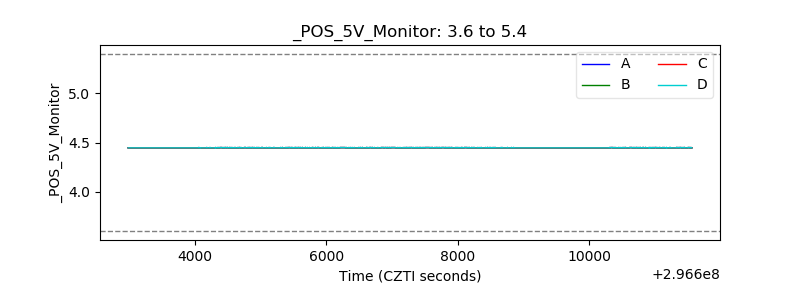 |
| _ROLL_ROT |  |
| _Roll_DEC |  |
| _Roll_RA | 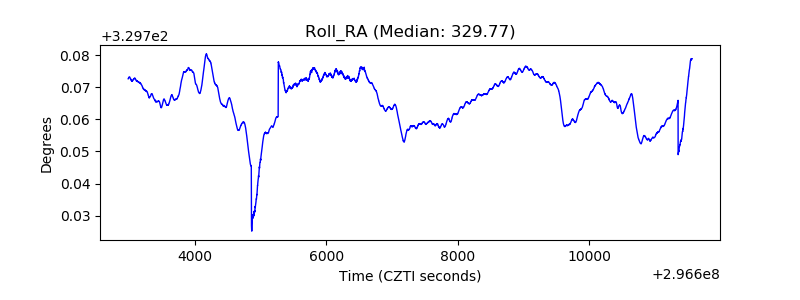 |
| Veto Counter | 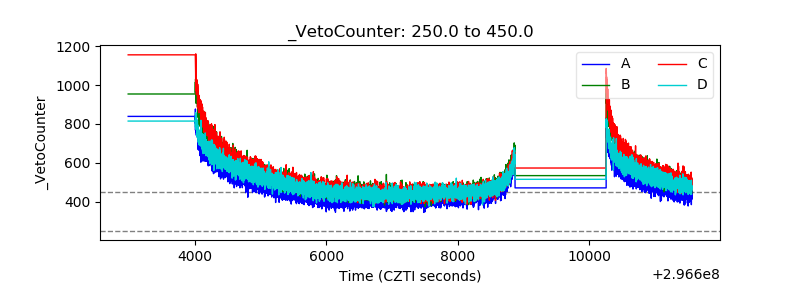 |