| Param | Original file | Final file |
|---|---|---|
| Filename | modeM0/AS1A05_117T01_9000002958_19792cztM0_level2.evt | modeM0/AS1A05_117T01_9000002958_19792cztM0_level2_quad_clean.evt |
| Size (bytes) | 1,065,147,840 | 146,799,360 |
| Size | 1015.8 MB | 140.0 MB |
| Events in quadrant A | 13,213,658 | 832,594 |
| Events in quadrant B | 5,696,609 | 968,557 |
| Events in quadrant C | 6,096,906 | 923,821 |
| Events in quadrant D | 6,461,713 | 911,508 |
| Mode M9 | |||
|---|---|---|---|
| Quadrant | BADHDUFLAG | Total packets | Discarded packets |
| A | 0 | 5 | 0 |
| B | 0 | 5 | 0 |
| C | 0 | 5 | 0 |
| D | 0 | 5 | 0 |
| Mode M0 | |||
|---|---|---|---|
| Quadrant | BADHDUFLAG | Total packets | Discarded packets |
| A | 0 | 47326 | 2 |
| B | 0 | 24474 | 2 |
| C | 0 | 25394 | 2 |
| D | 0 | 27269 | 2 |
| Mode SS | |||
|---|---|---|---|
| Quadrant | BADHDUFLAG | Total packets | Discarded packets |
| A | 0 | 236 | 0 |
| B | 0 | 236 | 0 |
| C | 0 | 236 | 0 |
| D | 0 | 236 | 0 |
| Quadrant | Total seconds | Saturated seconds | Saturation percentage |
|---|---|---|---|
| A | 11684 | 2355 | 20.155769% |
| B | 11685 | 191 | 1.634574% |
| C | 11685 | 278 | 2.379119% |
| D | 11685 | 255 | 2.182285% |
Noise dominated data is calculated using 1-second bins in cleaned event files. If a bin has >2000 counts, and if more than 50% of those come from <1% of pixels, then it is considered to be noise-dominated and hence unusable.
| Quadrant | # 1 sec bins | Bins with >0 counts | Bins with >2000 counts | High rate bins dominated by noise | Noise dominated (total time) | Noise dominated (detector-on time) | Marked lightcurve |
|---|---|---|---|---|---|---|---|
| A | 12229 | 11685 | 1872 | 1872 | 15.31% | 16.02% | 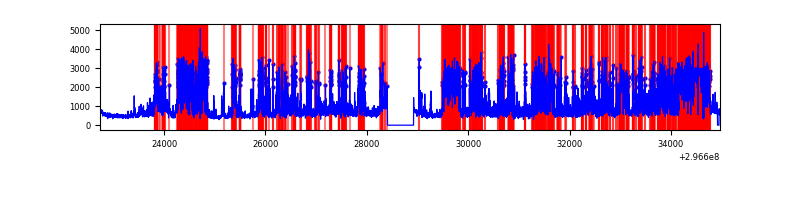 |
| B | 12230 | 11686 | 42 | 42 | 0.34% | 0.36% | 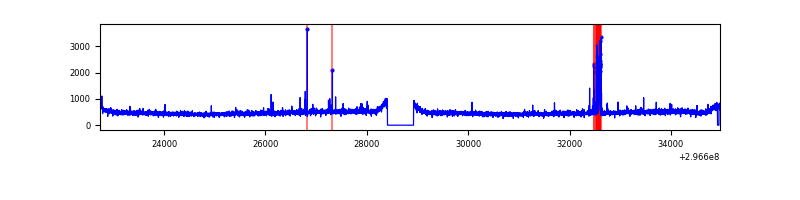 |
| C | 12231 | 11686 | 11 | 11 | 0.09% | 0.09% | 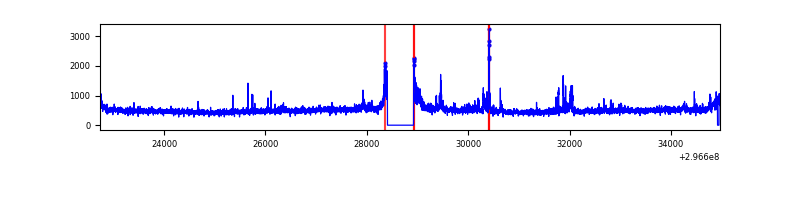 |
| D | 12231 | 11687 | 128 | 128 | 1.05% | 1.10% | 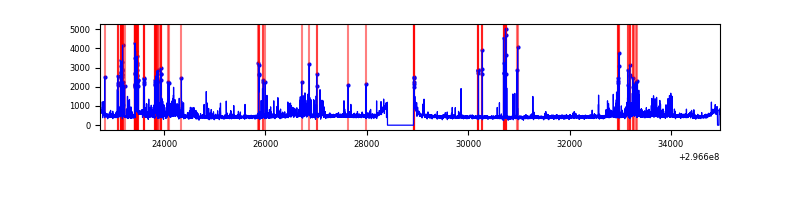 |
Top three noisy pixels from each quadrant. If the there are fewer than three noisy pixels in the level2.evt file, extra rows are filled as -1
| Pixel properties | Quadrant properties | ||||||
|---|---|---|---|---|---|---|---|
| Quadrant | DetID | PixID | Counts | Sigma | Mean | Median | Sigma |
| A | 6 | 16 | 8186354 | 30911.96 | 1303 | 1275 | 264.8 |
| A | 11 | 29 | 12055 | 40.71 | 1303 | 1275 | 264.8 |
| A | 0 | 226 | 11159 | 37.33 | 1303 | 1275 | 264.8 |
| B | 7 | 220 | 127746 | 467.7 | 1405 | 1364 | 270.2 |
| B | 12 | 111 | 32711 | 116.0 | 1405 | 1364 | 270.2 |
| B | 11 | 111 | 29140 | 102.79 | 1405 | 1364 | 270.2 |
| C | 3 | 233 | 573644 | 1806.28 | 1357 | 1367 | 316.8 |
| C | 14 | 238 | 210460 | 659.96 | 1357 | 1367 | 316.8 |
| C | 7 | 247 | 19499 | 57.23 | 1357 | 1367 | 316.8 |
| D | 1 | 52 | 923632 | 2737.55 | 1385 | 1345 | 336.9 |
| D | 7 | 238 | 185721 | 547.27 | 1385 | 1345 | 336.9 |
| D | 12 | 218 | 100293 | 293.7 | 1385 | 1345 | 336.9 |
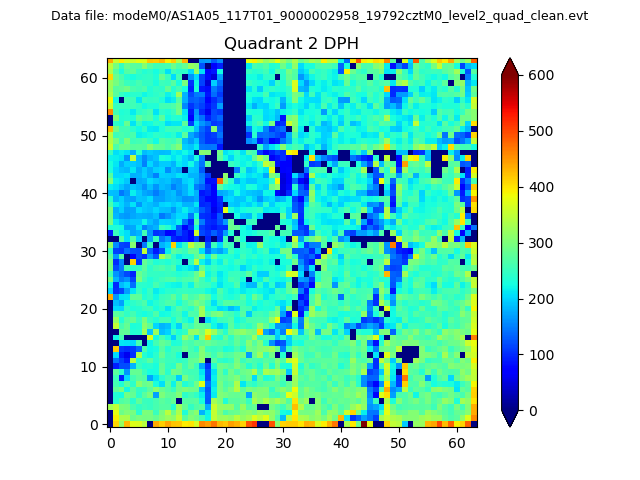
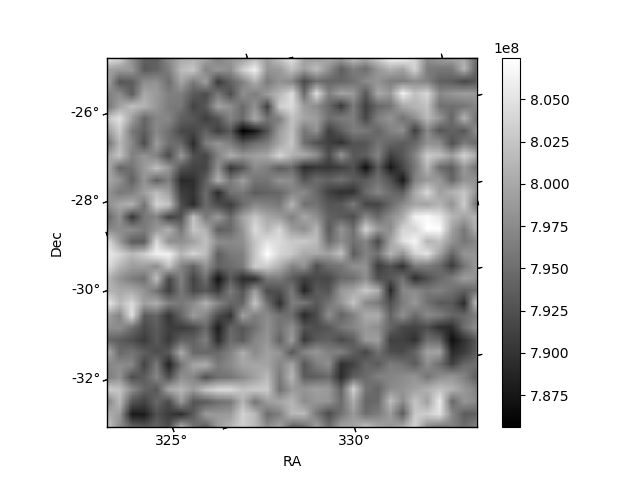
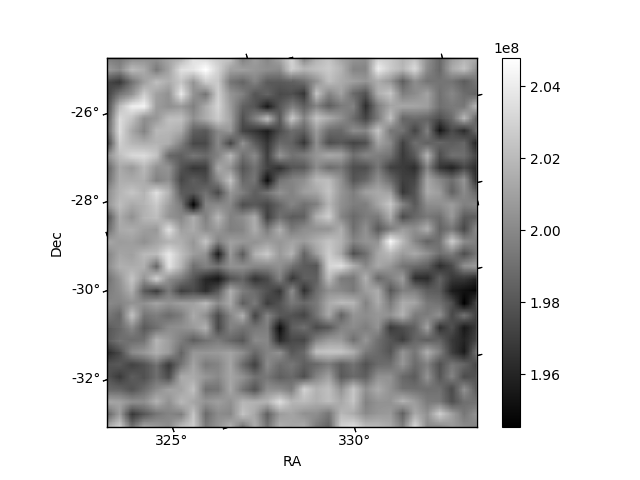
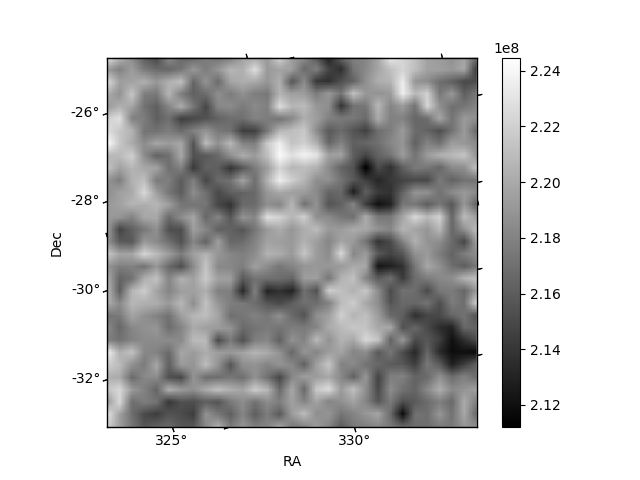
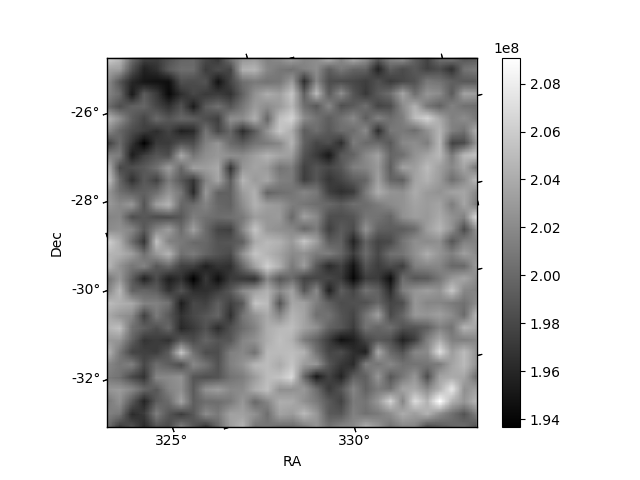
Histogram calculated using DETX and DETY for each event in the final _common_clean file
| Quadrant A | 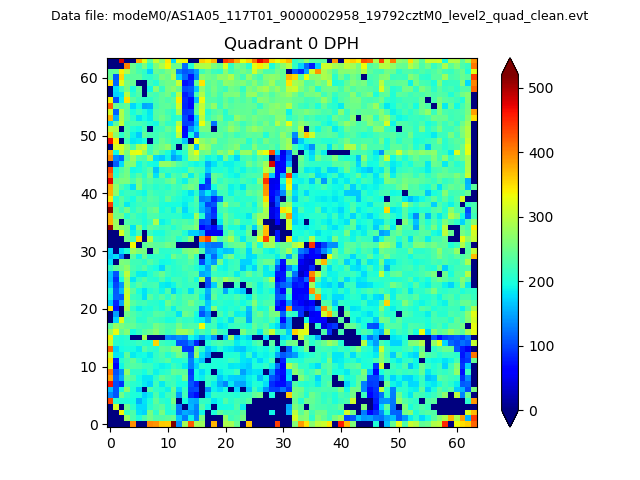 |
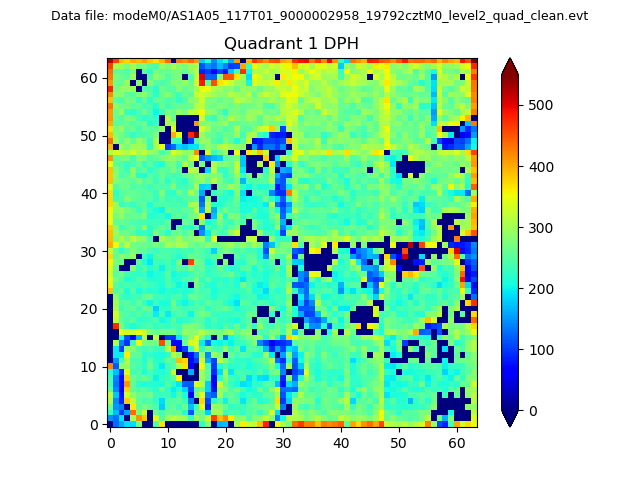 |
Quadrant B |
|---|---|---|---|
| Quadrant D | 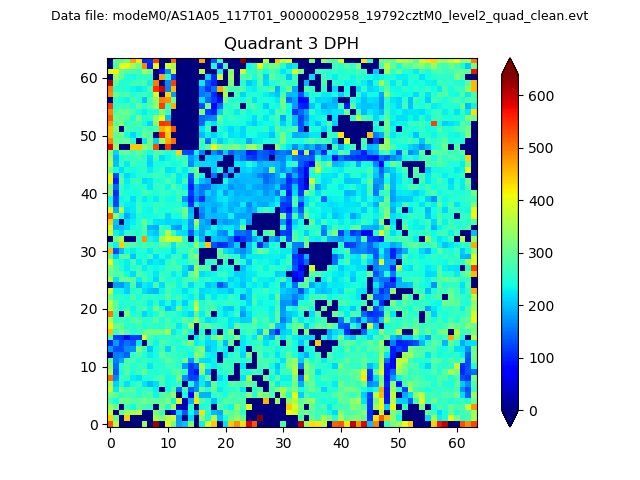 |
 |
Quadrant C |
| Plot type | Count rate plots | Images |
|---|---|---|
| Comparison with Poisson distribution Blue bars denote a histogram of data divided into 1 sec bins. Red curve is a Poisson curve with rate = median count rate of data. |
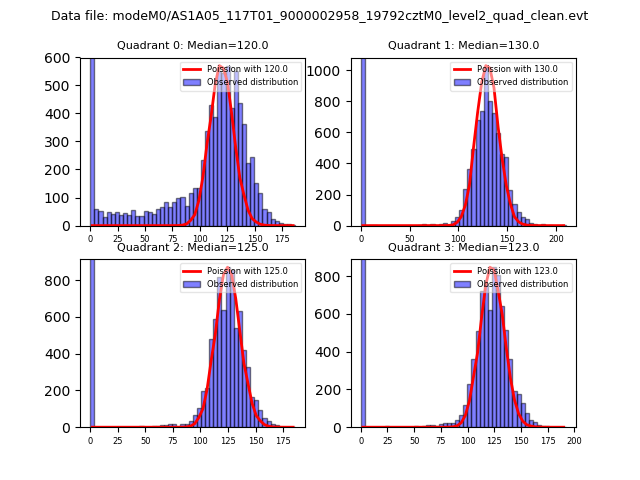 |
 |
| Quadrant-wise count rates Data is divided into 100 sec bins |
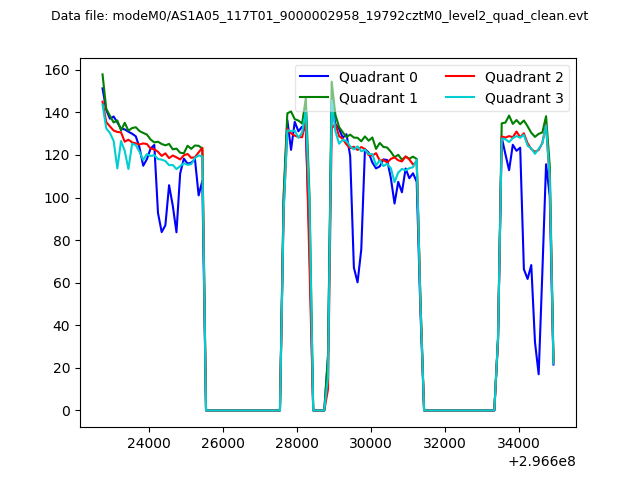 |
|
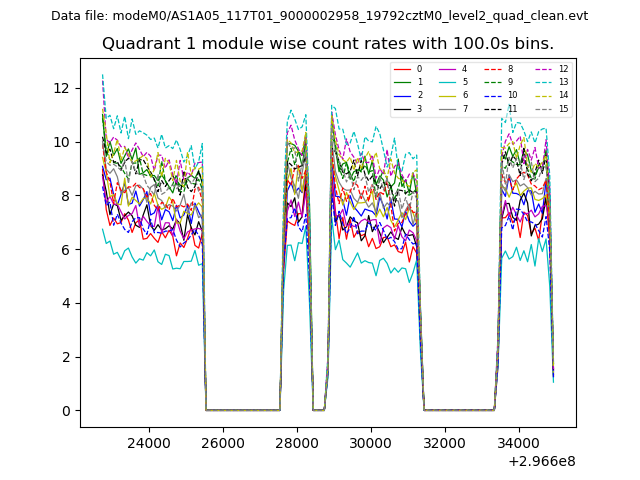
| Module-wise count rates for Quadrant A Data is divided into 100 sec bins |
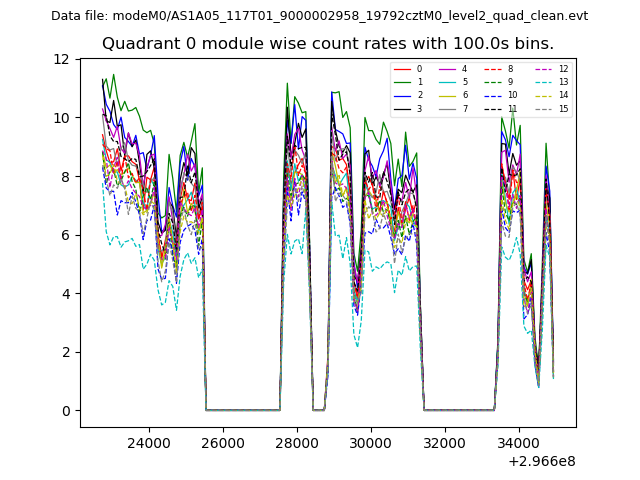 |
 |
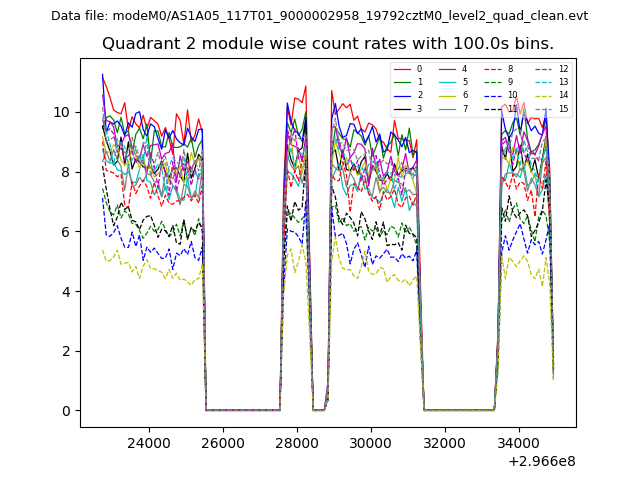
| Module-wise count rates for Quadrant B Data is divided into 100 sec bins |
 |
 |
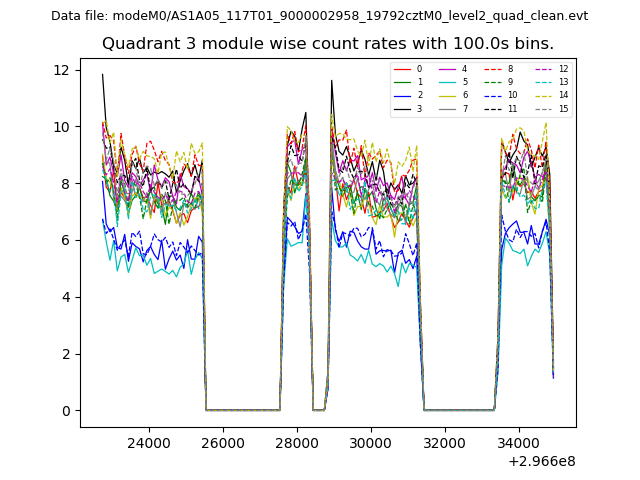
| Module-wise count rates for Quadrant C Data is divided into 100 sec bins |
 |
 |
| Module-wise count rates for Quadrant D Data is divided into 100 sec bins |
 |
 |
| Parameter | Plot |
|---|---|
| CZT HV Monitor | 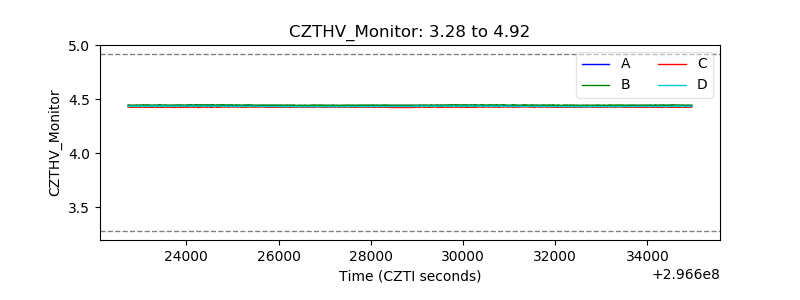 |
| D_VDD | 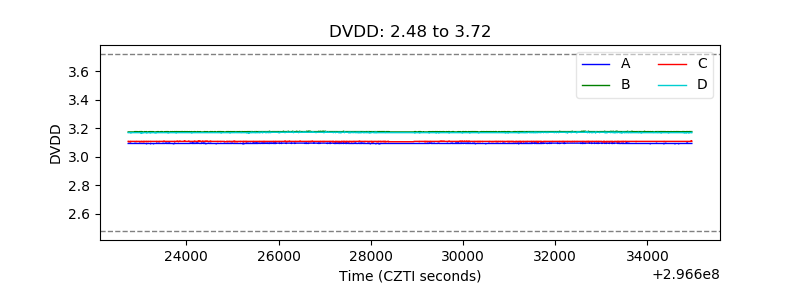 |
| Temperature 1 | 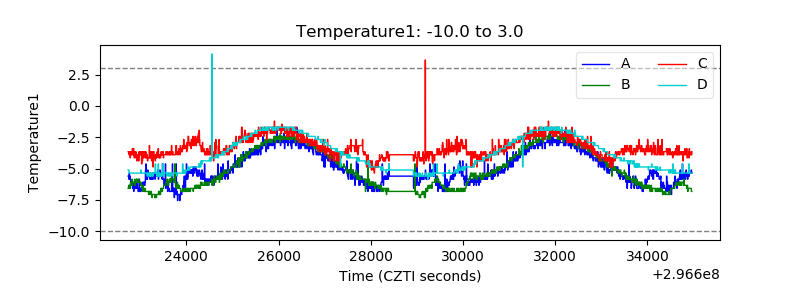 |
| Veto HV Monitor | 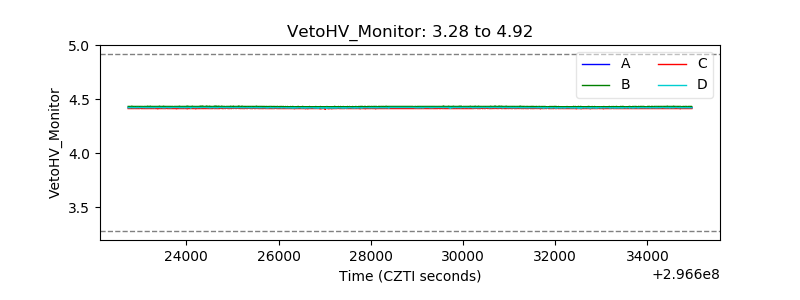 |
| Veto LLD | 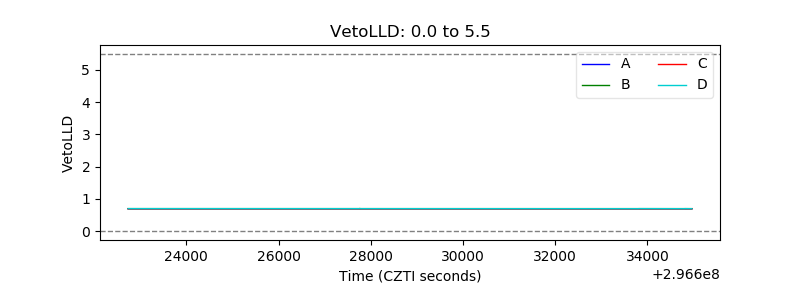 |
| Alpha Counter | 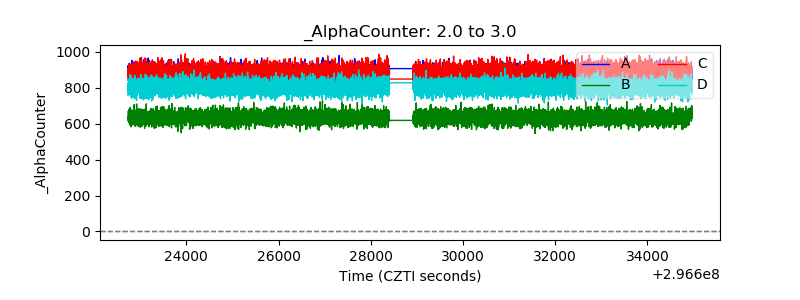 |
| _CPM_Rate | 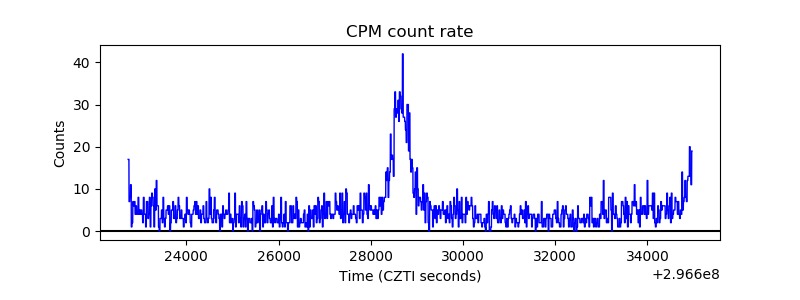 |
| CZT Counter | 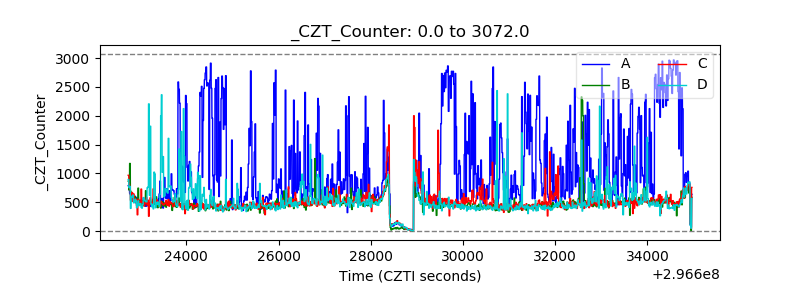 |
| +2.5 Volts monitor | 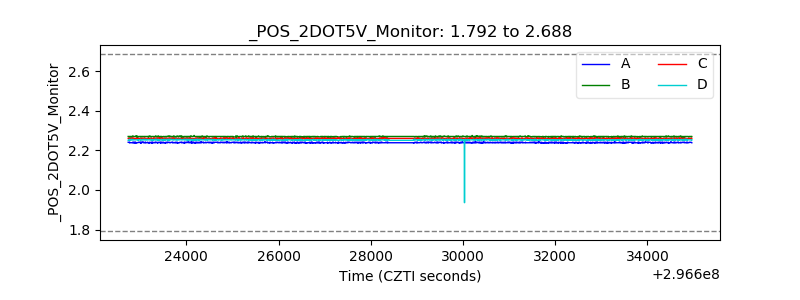 |
| +5 Volts monitor |  |
| _ROLL_ROT | 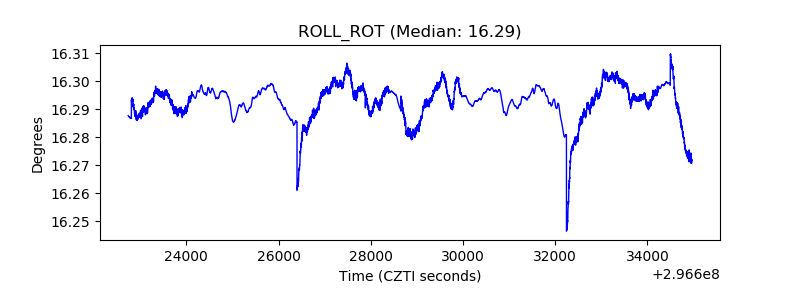 |
| _Roll_DEC | 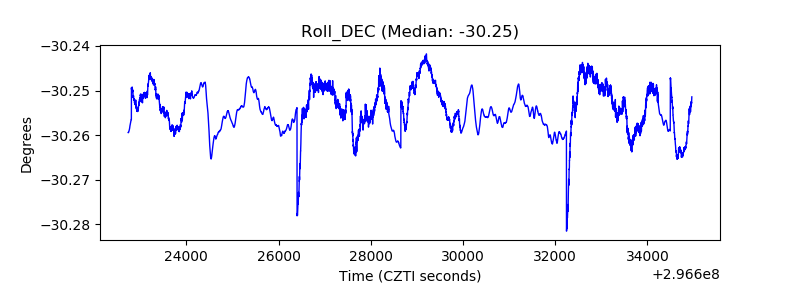 |
| _Roll_RA | 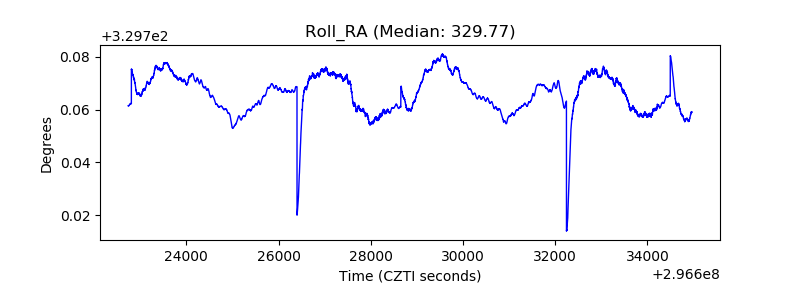 |
| Veto Counter | 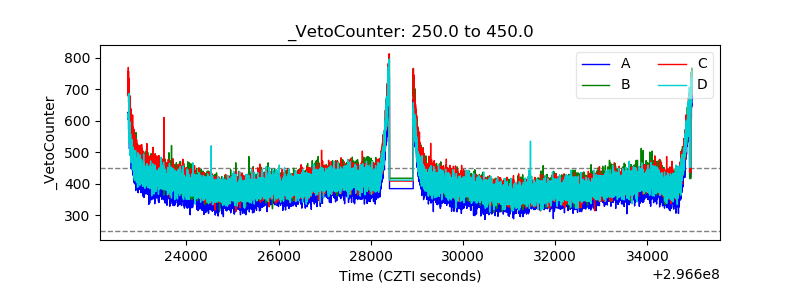 |