| Param | Original file | Final file |
|---|---|---|
| Filename | modeM0/AS1A05_117T01_9000002958_19796cztM0_level2.evt | modeM0/AS1A05_117T01_9000002958_19796cztM0_level2_quad_clean.evt |
| Size (bytes) | 579,859,200 | 66,732,480 |
| Size | 553.0 MB | 63.6 MB |
| Events in quadrant A | 6,792,301 | 381,657 |
| Events in quadrant B | 3,357,609 | 406,348 |
| Events in quadrant C | 3,301,694 | 388,911 |
| Events in quadrant D | 3,665,246 | 385,881 |
| Mode M9 | |||
|---|---|---|---|
| Quadrant | BADHDUFLAG | Total packets | Discarded packets |
| A | 0 | 10 | 0 |
| B | 0 | 10 | 0 |
| C | 0 | 10 | 0 |
| D | 0 | 10 | 0 |
| Mode M0 | |||
|---|---|---|---|
| Quadrant | BADHDUFLAG | Total packets | Discarded packets |
| A | 0 | 24733 | 2 |
| B | 0 | 14192 | 2 |
| C | 0 | 13943 | 2 |
| D | 0 | 15120 | 2 |
| Mode SS | |||
|---|---|---|---|
| Quadrant | BADHDUFLAG | Total packets | Discarded packets |
| A | 0 | 132 | 0 |
| B | 0 | 132 | 0 |
| C | 0 | 132 | 0 |
| D | 0 | 132 | 0 |
| Quadrant | Total seconds | Saturated seconds | Saturation percentage |
|---|---|---|---|
| A | 6562 | 1003 | 15.284974% |
| B | 6563 | 87 | 1.325613% |
| C | 6563 | 78 | 1.188481% |
| D | 6563 | 67 | 1.020875% |
Noise dominated data is calculated using 1-second bins in cleaned event files. If a bin has >2000 counts, and if more than 50% of those come from <1% of pixels, then it is considered to be noise-dominated and hence unusable.
| Quadrant | # 1 sec bins | Bins with >0 counts | Bins with >2000 counts | High rate bins dominated by noise | Noise dominated (total time) | Noise dominated (detector-on time) | Marked lightcurve |
|---|---|---|---|---|---|---|---|
| A | 7537 | 6562 | 782 | 782 | 10.38% | 11.92% | 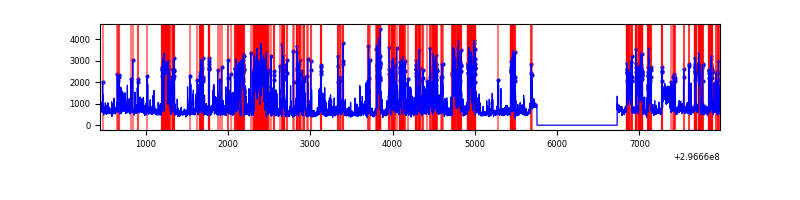 |
| B | 7538 | 6563 | 14 | 14 | 0.19% | 0.21% | 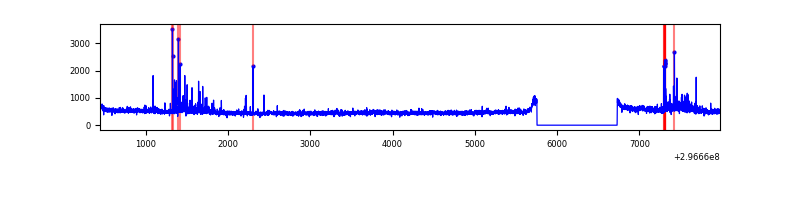 |
| C | 7538 | 6563 | 0 | 0 | 0.00% | 0.00% | 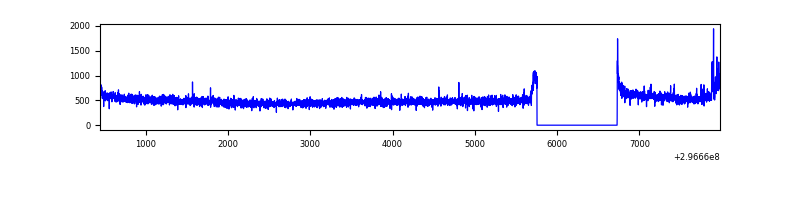 |
| D | 7538 | 6563 | 22 | 22 | 0.29% | 0.34% | 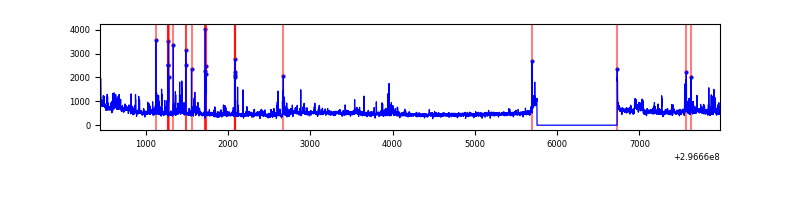 |
Top three noisy pixels from each quadrant. If the there are fewer than three noisy pixels in the level2.evt file, extra rows are filled as -1
| Pixel properties | Quadrant properties | ||||||
|---|---|---|---|---|---|---|---|
| Quadrant | DetID | PixID | Counts | Sigma | Mean | Median | Sigma |
| A | 6 | 16 | 3815313 | 24645.15 | 768 | 752 | 154.8 |
| A | 15 | 192 | 15889 | 97.8 | 768 | 752 | 154.8 |
| A | 0 | 226 | 6561 | 37.53 | 768 | 752 | 154.8 |
| B | 7 | 220 | 161626 | 1029.15 | 807 | 786 | 156.3 |
| B | 12 | 111 | 18508 | 113.4 | 807 | 786 | 156.3 |
| B | 11 | 111 | 16505 | 100.58 | 807 | 786 | 156.3 |
| C | 3 | 233 | 136316 | 751.97 | 772 | 779 | 180.2 |
| C | 14 | 238 | 120197 | 662.54 | 772 | 779 | 180.2 |
| C | 8 | 128 | 12275 | 63.78 | 772 | 779 | 180.2 |
| D | 7 | 238 | 211299 | 1092.69 | 789 | 766 | 192.7 |
| D | 2 | 69 | 195597 | 1011.19 | 789 | 766 | 192.7 |
| D | 12 | 218 | 136086 | 702.33 | 789 | 766 | 192.7 |
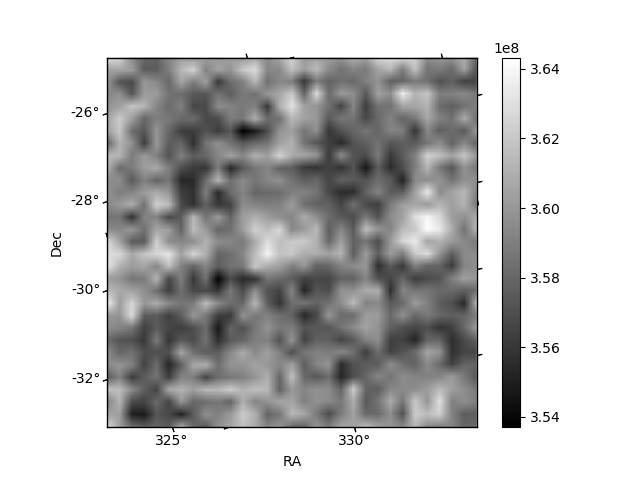
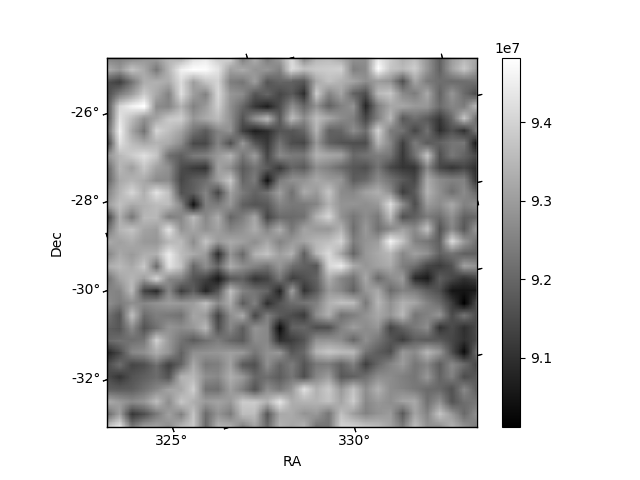
Histogram calculated using DETX and DETY for each event in the final _common_clean file
| Quadrant A |  |
 |
Quadrant B |
|---|---|---|---|
| Quadrant D |  |
 |
Quadrant C |
| Plot type | Count rate plots | Images |
|---|---|---|
| Comparison with Poisson distribution Blue bars denote a histogram of data divided into 1 sec bins. Red curve is a Poisson curve with rate = median count rate of data. |
 |
 |
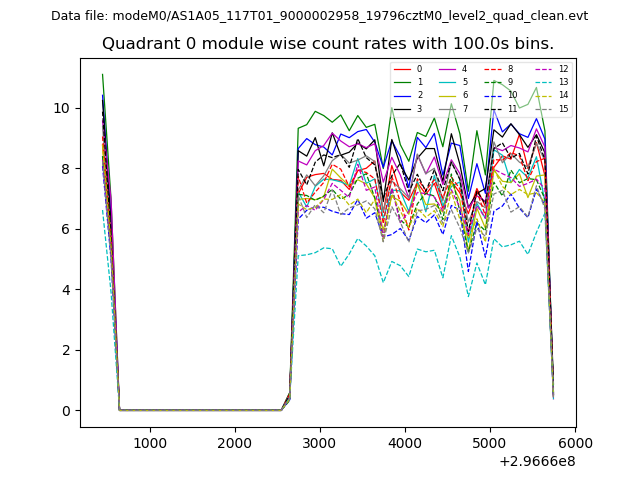
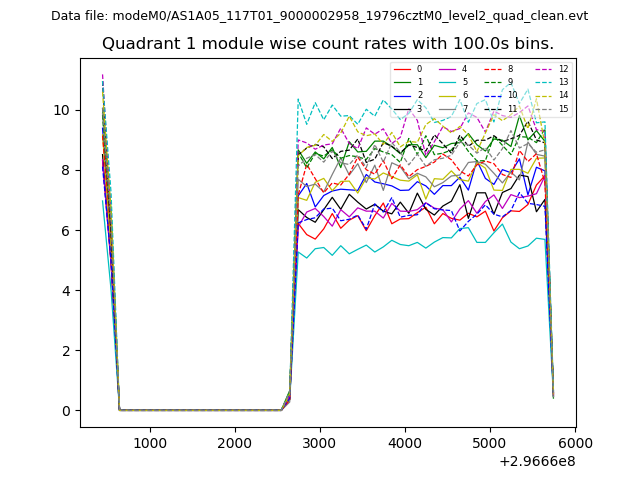
| Quadrant-wise count rates Data is divided into 100 sec bins |
 |
|
| Module-wise count rates for Quadrant A Data is divided into 100 sec bins |
 |
 |
| Module-wise count rates for Quadrant B Data is divided into 100 sec bins |
 |
 |
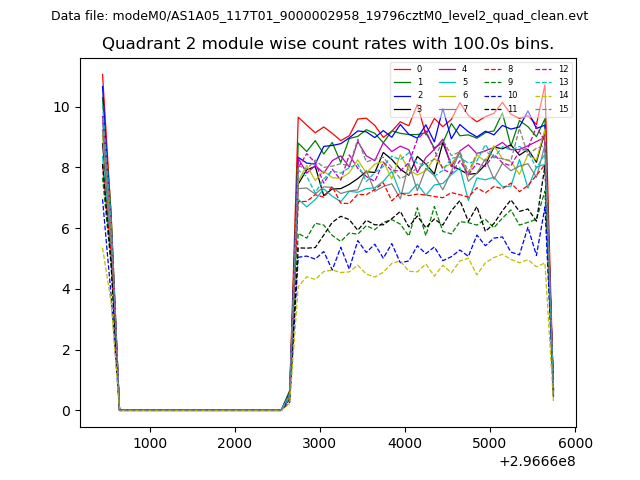
| Module-wise count rates for Quadrant C Data is divided into 100 sec bins |
 |
 |
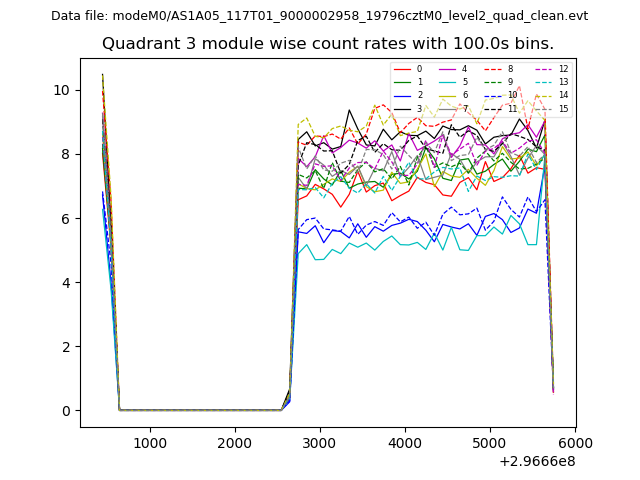
| Module-wise count rates for Quadrant D Data is divided into 100 sec bins |
 |
 |
| Parameter | Plot |
|---|---|
| CZT HV Monitor | 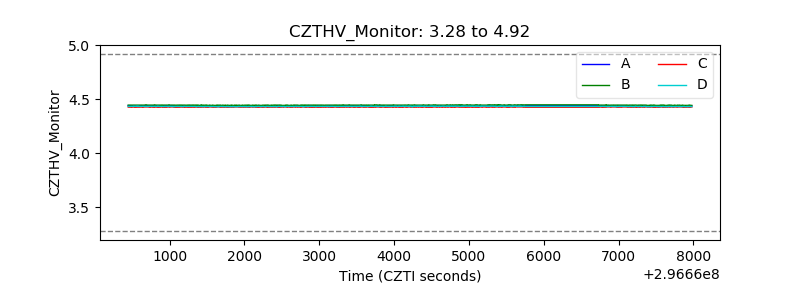 |
| D_VDD | 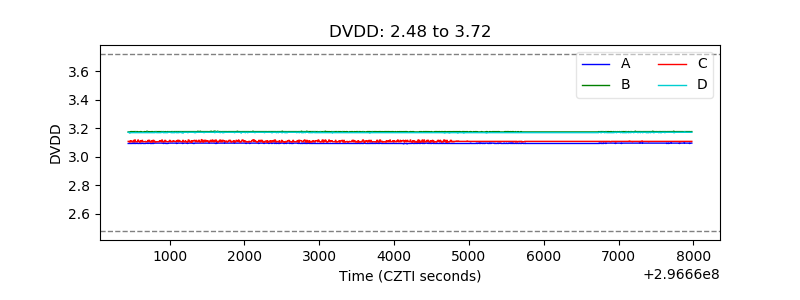 |
| Temperature 1 |  |
| Veto HV Monitor | 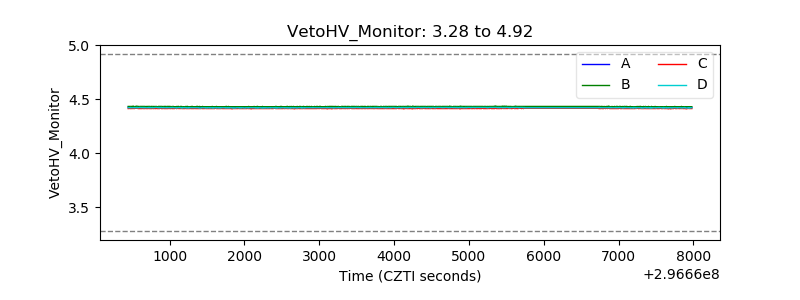 |
| Veto LLD | 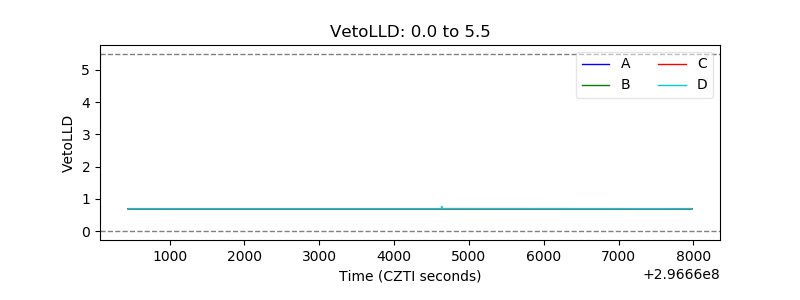 |
| Alpha Counter |  |
| _CPM_Rate | 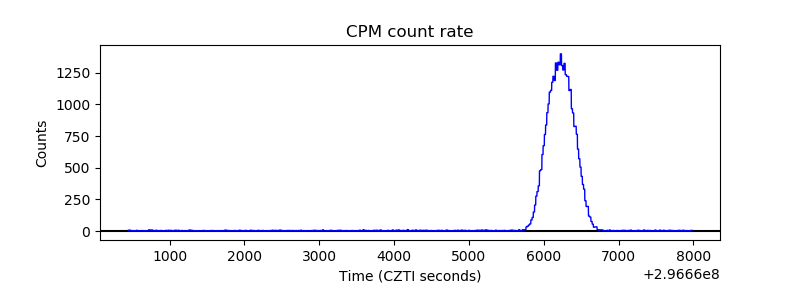 |
| CZT Counter | 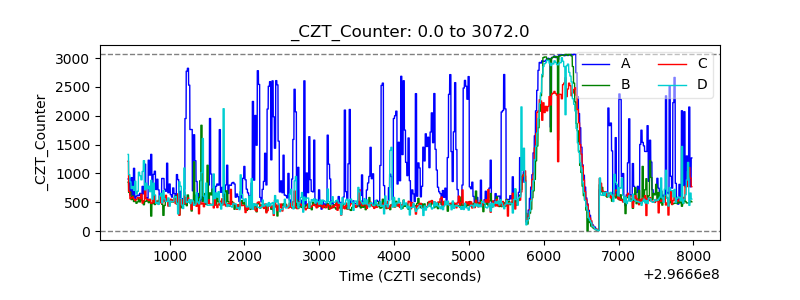 |
| +2.5 Volts monitor |  |
| +5 Volts monitor | 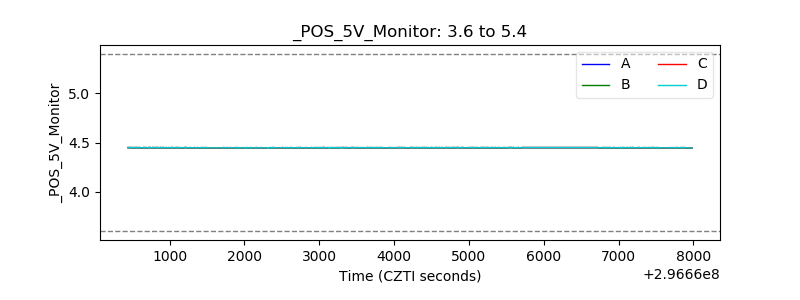 |
| _ROLL_ROT | 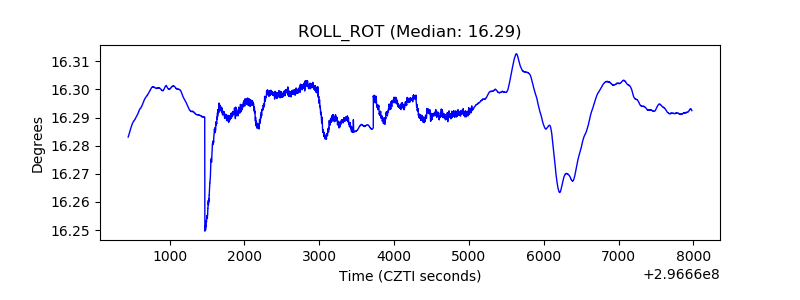 |
| _Roll_DEC | 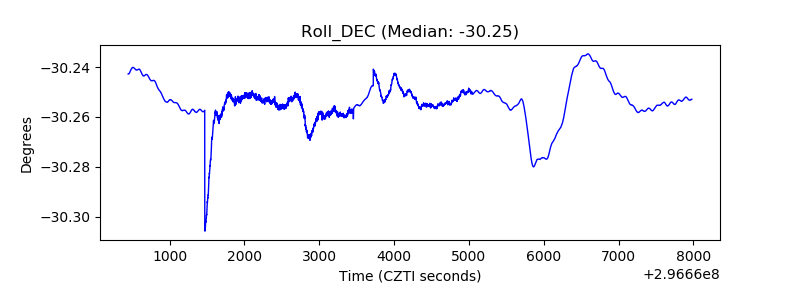 |
| _Roll_RA | 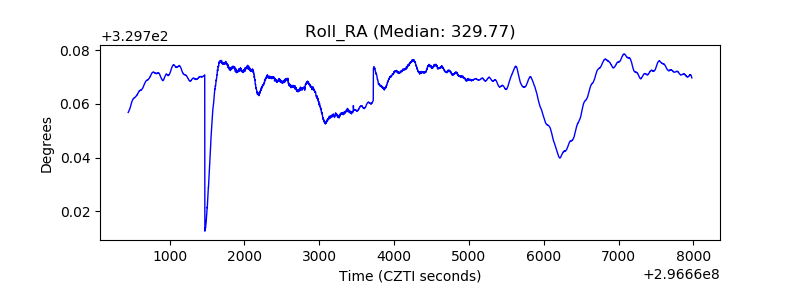 |
| Veto Counter | 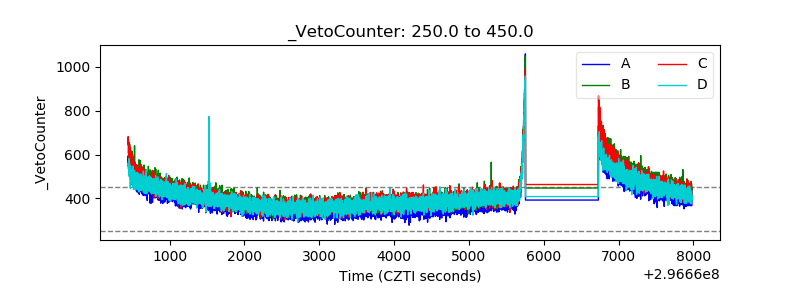 |