| Param | Original file | Final file |
|---|---|---|
| Filename | modeM0/AS1A05_117T01_9000002958_19799cztM0_level2.evt | modeM0/AS1A05_117T01_9000002958_19799cztM0_level2_quad_clean.evt |
| Size (bytes) | 690,799,680 | 81,794,880 |
| Size | 658.8 MB | 78.0 MB |
| Events in quadrant A | 6,830,860 | 491,135 |
| Events in quadrant B | 3,479,715 | 539,979 |
| Events in quadrant C | 3,499,160 | 510,181 |
| Events in quadrant D | 6,684,196 | 494,363 |
| Mode M9 | |||
|---|---|---|---|
| Quadrant | BADHDUFLAG | Total packets | Discarded packets |
| A | 0 | 23 | 0 |
| B | 0 | 23 | 0 |
| C | 0 | 23 | 0 |
| D | 0 | 23 | 0 |
| Mode M0 | |||
|---|---|---|---|
| Quadrant | BADHDUFLAG | Total packets | Discarded packets |
| A | 0 | 24684 | 2 |
| B | 0 | 14423 | 2 |
| C | 0 | 14378 | 2 |
| D | 0 | 24272 | 2 |
| Mode SS | |||
|---|---|---|---|
| Quadrant | BADHDUFLAG | Total packets | Discarded packets |
| A | 0 | 132 | 0 |
| B | 0 | 132 | 0 |
| C | 0 | 132 | 0 |
| D | 0 | 132 | 0 |
| Quadrant | Total seconds | Saturated seconds | Saturation percentage |
|---|---|---|---|
| A | 6311 | 1099 | 17.414039% |
| B | 6311 | 112 | 1.774679% |
| C | 6311 | 99 | 1.568690% |
| D | 6312 | 1364 | 21.609632% |
Noise dominated data is calculated using 1-second bins in cleaned event files. If a bin has >2000 counts, and if more than 50% of those come from <1% of pixels, then it is considered to be noise-dominated and hence unusable.
| Quadrant | # 1 sec bins | Bins with >0 counts | Bins with >2000 counts | High rate bins dominated by noise | Noise dominated (total time) | Noise dominated (detector-on time) | Marked lightcurve |
|---|---|---|---|---|---|---|---|
| A | 8666 | 6311 | 873 | 873 | 10.07% | 13.83% | 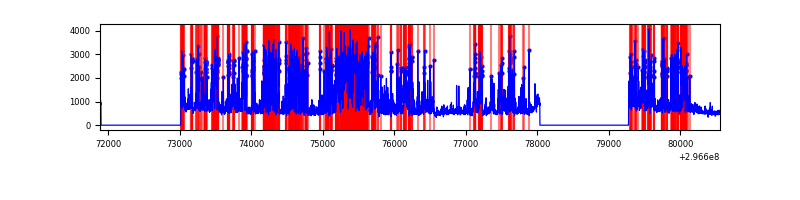 |
| B | 8666 | 6311 | 26 | 26 | 0.30% | 0.41% | 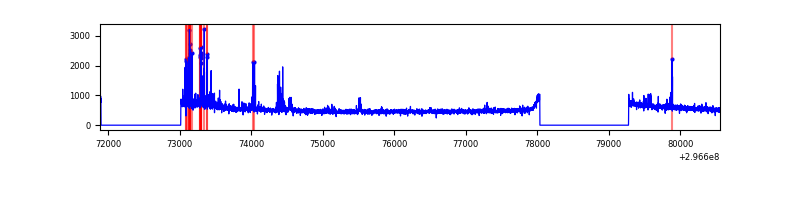 |
| C | 8666 | 6312 | 4 | 4 | 0.05% | 0.06% | 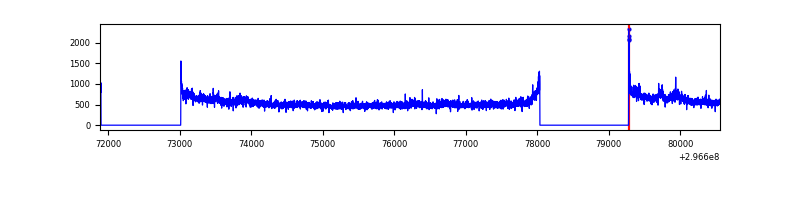 |
| D | 8667 | 6313 | 1167 | 1167 | 13.46% | 18.49% | 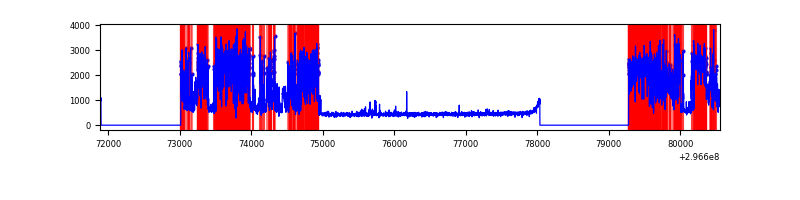 |
Top three noisy pixels from each quadrant. If the there are fewer than three noisy pixels in the level2.evt file, extra rows are filled as -1
| Pixel properties | Quadrant properties | ||||||
|---|---|---|---|---|---|---|---|
| Quadrant | DetID | PixID | Counts | Sigma | Mean | Median | Sigma |
| A | 6 | 16 | 3745722 | 23698.2 | 785 | 771 | 158.0 |
| A | 4 | 2 | 60847 | 380.16 | 785 | 771 | 158.0 |
| A | 0 | 226 | 6823 | 38.3 | 785 | 771 | 158.0 |
| B | 7 | 220 | 95316 | 606.81 | 832 | 814 | 155.7 |
| B | 4 | 216 | 35849 | 224.96 | 832 | 814 | 155.7 |
| B | 10 | 247 | 34511 | 216.37 | 832 | 814 | 155.7 |
| C | 3 | 233 | 267048 | 1448.28 | 797 | 804 | 183.8 |
| C | 14 | 238 | 125357 | 677.53 | 797 | 804 | 183.8 |
| C | 13 | 61 | 5548 | 25.8 | 797 | 804 | 183.8 |
| D | 7 | 238 | 3367071 | 18802.97 | 746 | 725 | 179.0 |
| D | 12 | 218 | 416734 | 2323.65 | 746 | 725 | 179.0 |
| D | 2 | 234 | 31444 | 171.58 | 746 | 725 | 179.0 |
Histogram calculated using DETX and DETY for each event in the final _common_clean file
| Quadrant A |  |
 |
Quadrant B |
|---|---|---|---|
| Quadrant D | 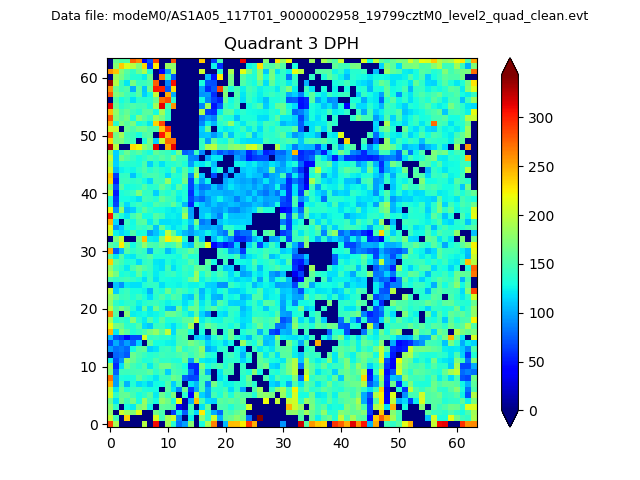 |
 |
Quadrant C |
| Plot type | Count rate plots | Images |
|---|---|---|
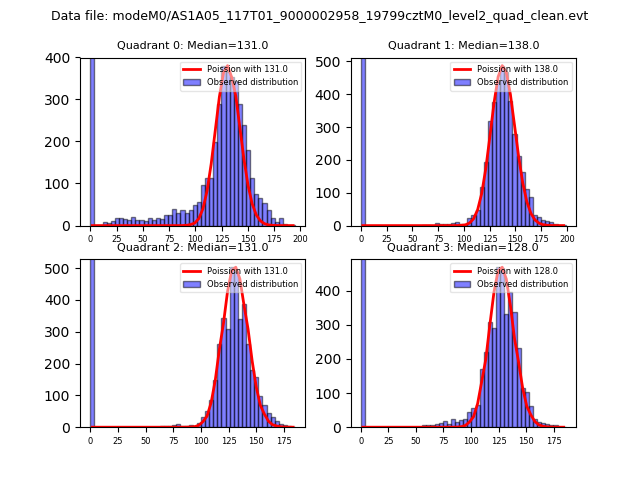
| Comparison with Poisson distribution Blue bars denote a histogram of data divided into 1 sec bins. Red curve is a Poisson curve with rate = median count rate of data. |
 |
 |
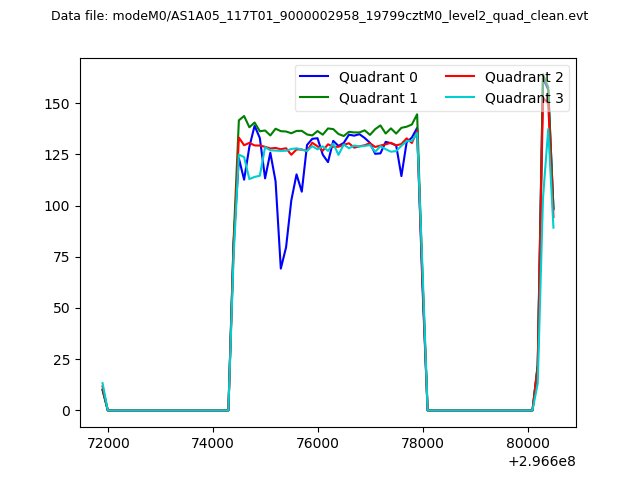
| Quadrant-wise count rates Data is divided into 100 sec bins |
 |
|
| Module-wise count rates for Quadrant A Data is divided into 100 sec bins |
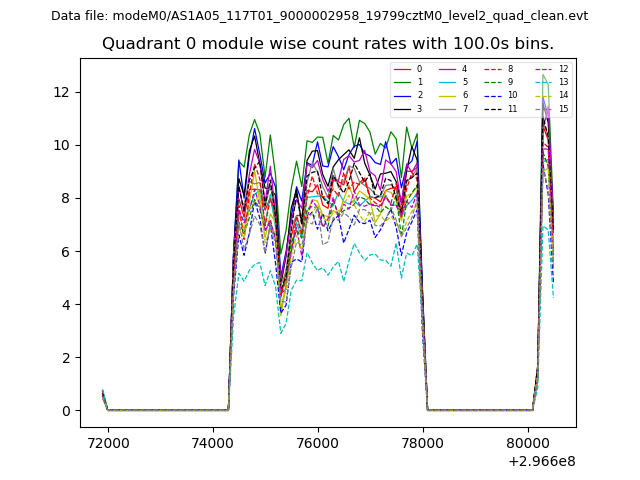 |
 |
| Module-wise count rates for Quadrant B Data is divided into 100 sec bins |
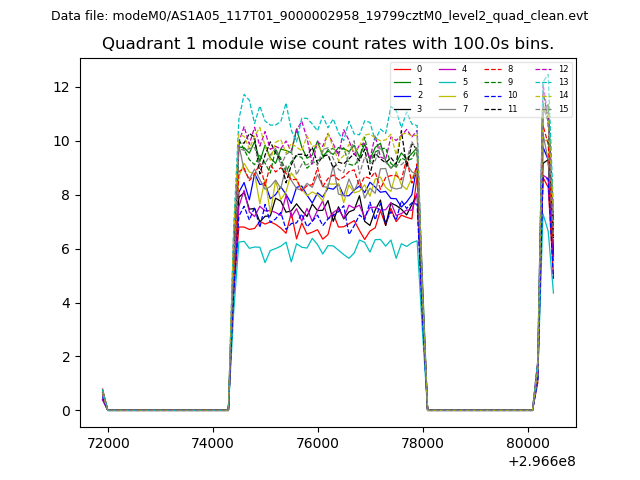 |
 |
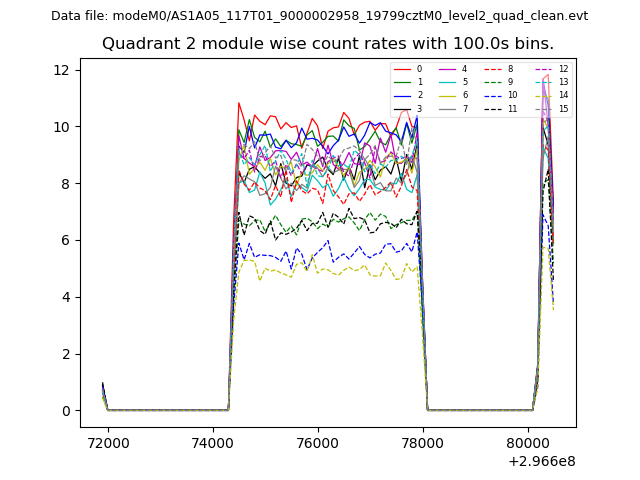
| Module-wise count rates for Quadrant C Data is divided into 100 sec bins |
 |
 |
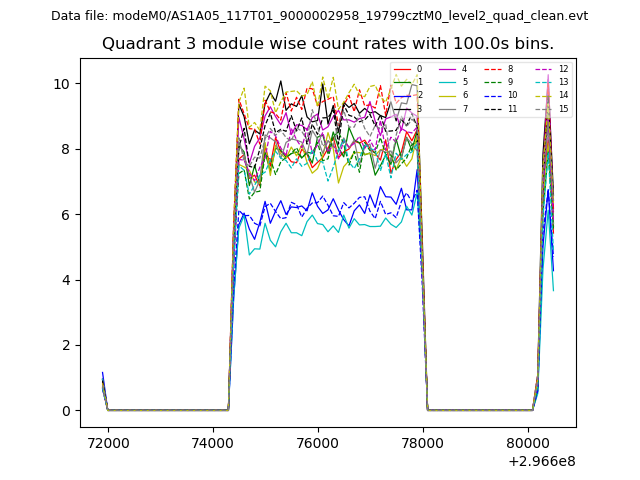
| Module-wise count rates for Quadrant D Data is divided into 100 sec bins |
 |
 |
| Parameter | Plot |
|---|---|
| CZT HV Monitor | 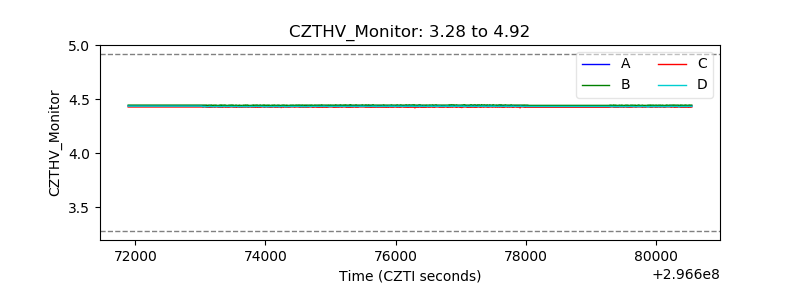 |
| D_VDD | 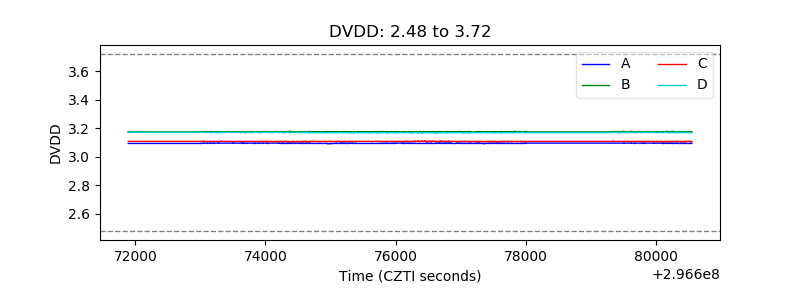 |
| Temperature 1 | 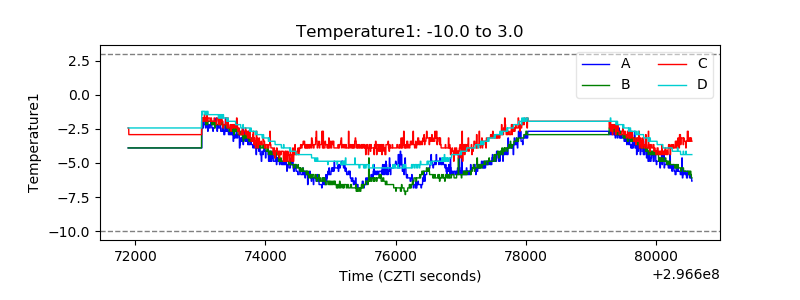 |
| Veto HV Monitor | 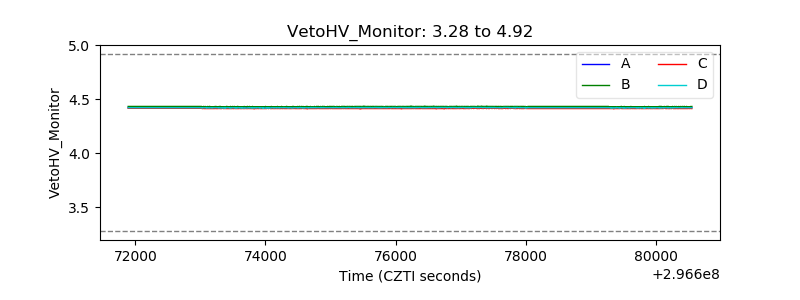 |
| Veto LLD | 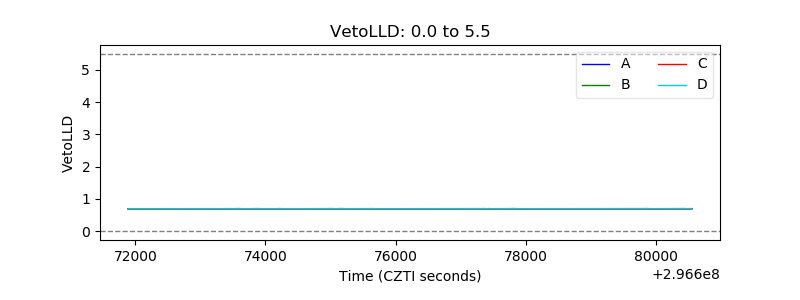 |
| Alpha Counter | 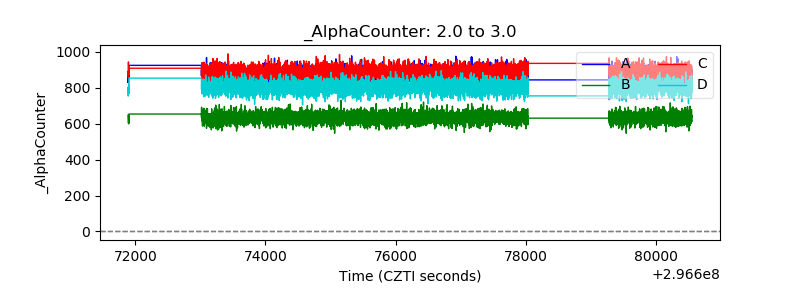 |
| _CPM_Rate | 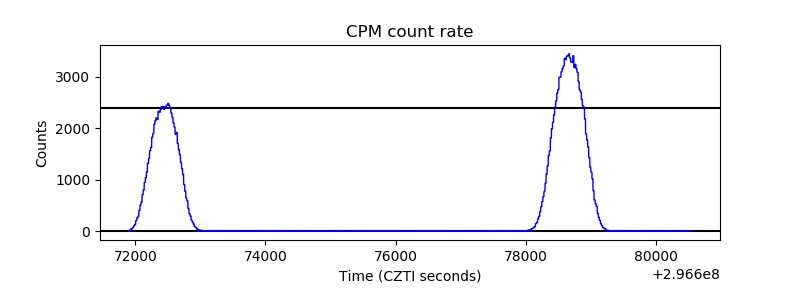 |
| CZT Counter | 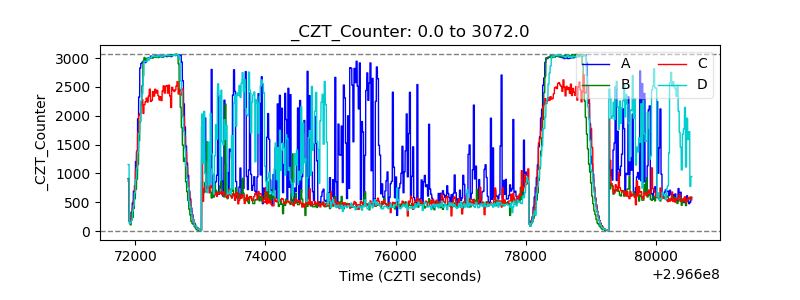 |
| +2.5 Volts monitor |  |
| +5 Volts monitor |  |
| _ROLL_ROT | 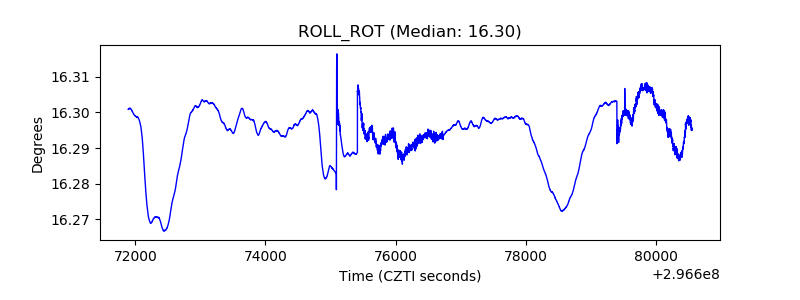 |
| _Roll_DEC | 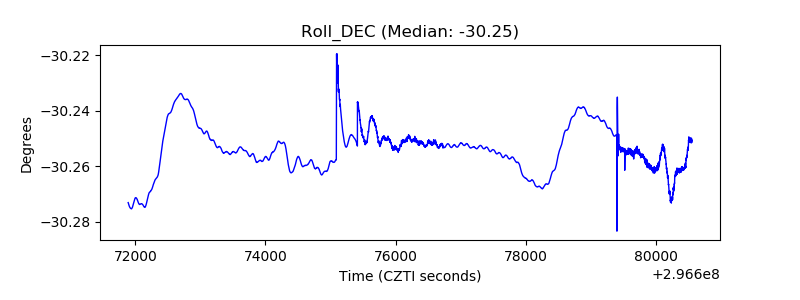 |
| _Roll_RA | 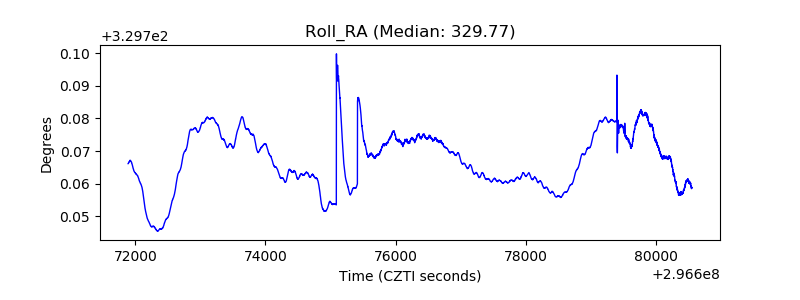 |
| Veto Counter | 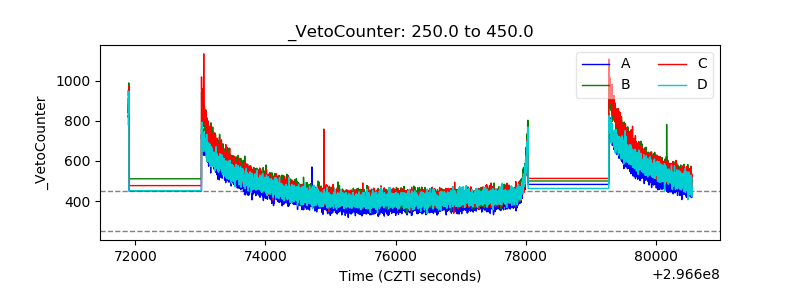 |