| Param | Original file | Final file |
|---|---|---|
| Filename | modeM0/AS1A05_117T01_9000002958_19800cztM0_level2.evt | modeM0/AS1A05_117T01_9000002958_19800cztM0_level2_quad_clean.evt |
| Size (bytes) | 683,688,960 | 94,582,080 |
| Size | 652.0 MB | 90.2 MB |
| Events in quadrant A | 4,309,593 | 636,259 |
| Events in quadrant B | 3,413,349 | 650,907 |
| Events in quadrant C | 4,067,035 | 611,404 |
| Events in quadrant D | 8,494,750 | 530,843 |
| Mode M9 | |||
|---|---|---|---|
| Quadrant | BADHDUFLAG | Total packets | Discarded packets |
| A | 0 | 13 | 0 |
| B | 0 | 14 | 0 |
| C | 0 | 14 | 0 |
| D | 0 | 14 | 0 |
| Mode M0 | |||
|---|---|---|---|
| Quadrant | BADHDUFLAG | Total packets | Discarded packets |
| A | 0 | 16836 | 2 |
| B | 0 | 13941 | 2 |
| C | 0 | 16535 | 2 |
| D | 0 | 29448 | 2 |
| Mode SS | |||
|---|---|---|---|
| Quadrant | BADHDUFLAG | Total packets | Discarded packets |
| A | 0 | 128 | 0 |
| B | 0 | 128 | 0 |
| C | 0 | 128 | 0 |
| D | 0 | 128 | 0 |
| Quadrant | Total seconds | Saturated seconds | Saturation percentage |
|---|---|---|---|
| A | 6219 | 340 | 5.467117% |
| B | 6219 | 80 | 1.286380% |
| C | 6219 | 152 | 2.444123% |
| D | 6219 | 1943 | 31.242965% |
Noise dominated data is calculated using 1-second bins in cleaned event files. If a bin has >2000 counts, and if more than 50% of those come from <1% of pixels, then it is considered to be noise-dominated and hence unusable.
| Quadrant | # 1 sec bins | Bins with >0 counts | Bins with >2000 counts | High rate bins dominated by noise | Noise dominated (total time) | Noise dominated (detector-on time) | Marked lightcurve |
|---|---|---|---|---|---|---|---|
| A | 7534 | 6219 | 197 | 197 | 2.61% | 3.17% | 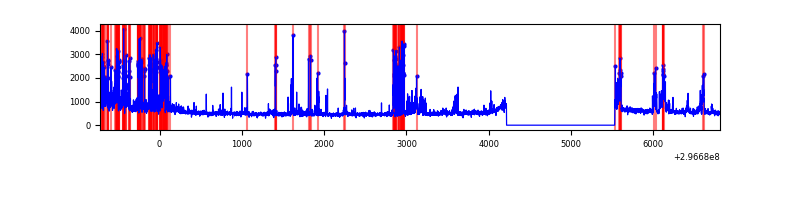 |
| B | 7534 | 6219 | 5 | 5 | 0.07% | 0.08% | 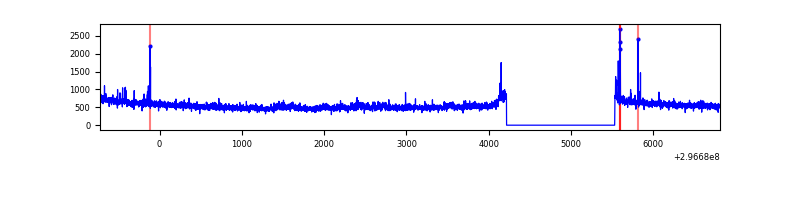 |
| C | 7534 | 6220 | 31 | 31 | 0.41% | 0.50% | 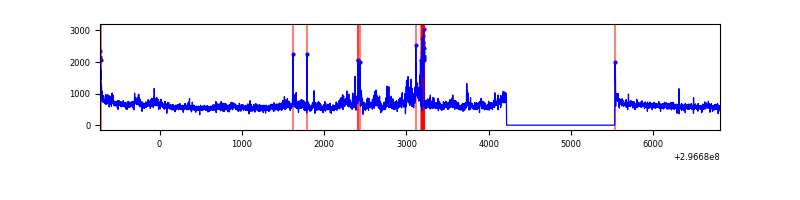 |
| D | 7534 | 6219 | 1673 | 1673 | 22.21% | 26.90% | 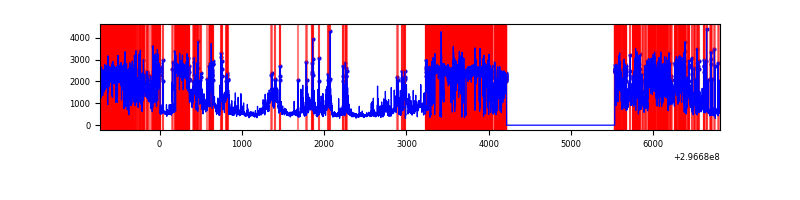 |
Top three noisy pixels from each quadrant. If the there are fewer than three noisy pixels in the level2.evt file, extra rows are filled as -1
| Pixel properties | Quadrant properties | ||||||
|---|---|---|---|---|---|---|---|
| Quadrant | DetID | PixID | Counts | Sigma | Mean | Median | Sigma |
| A | 6 | 16 | 1053782 | 6380.25 | 829 | 814 | 165.0 |
| A | 4 | 2 | 58386 | 348.85 | 829 | 814 | 165.0 |
| A | 0 | 226 | 7455 | 40.24 | 829 | 814 | 165.0 |
| B | 0 | 198 | 76750 | 488.86 | 841 | 824 | 155.3 |
| B | 7 | 220 | 29351 | 183.67 | 841 | 824 | 155.3 |
| B | 12 | 111 | 18073 | 111.06 | 841 | 824 | 155.3 |
| C | 3 | 233 | 786087 | 4206.11 | 808 | 817 | 186.7 |
| C | 14 | 238 | 128739 | 685.18 | 808 | 817 | 186.7 |
| C | 13 | 61 | 5730 | 26.32 | 808 | 817 | 186.7 |
| D | 7 | 238 | 3130363 | 18626.34 | 704 | 687 | 168.0 |
| D | 1 | 52 | 2341441 | 13931.05 | 704 | 687 | 168.0 |
| D | 12 | 218 | 137318 | 813.16 | 704 | 687 | 168.0 |
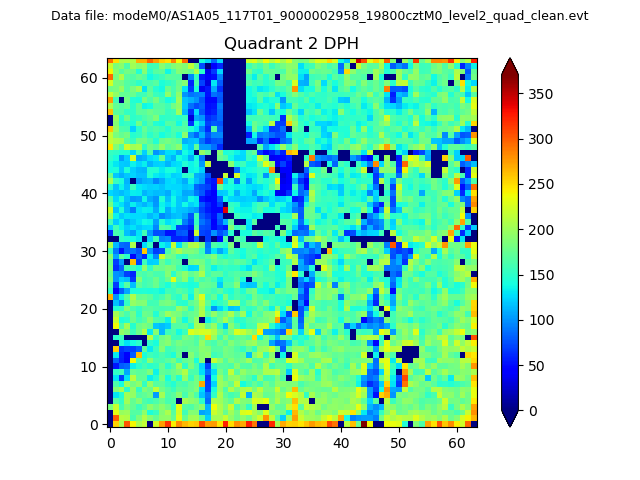
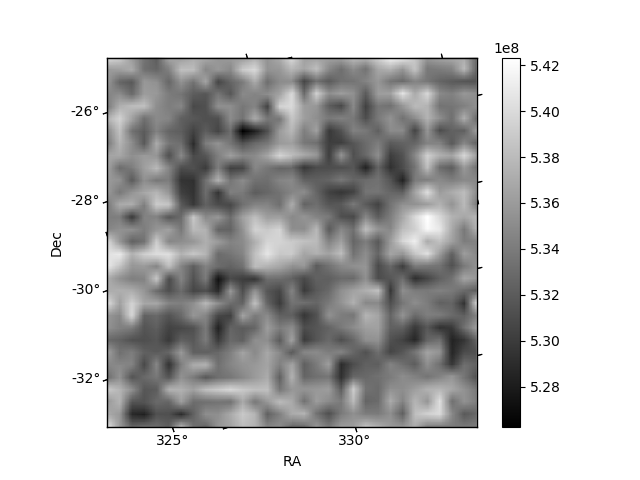
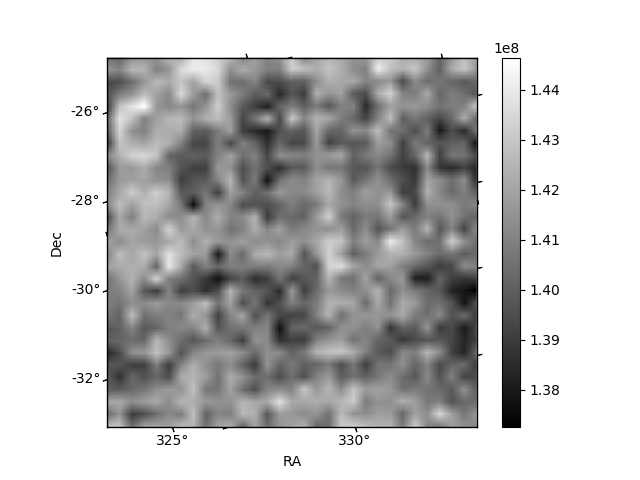
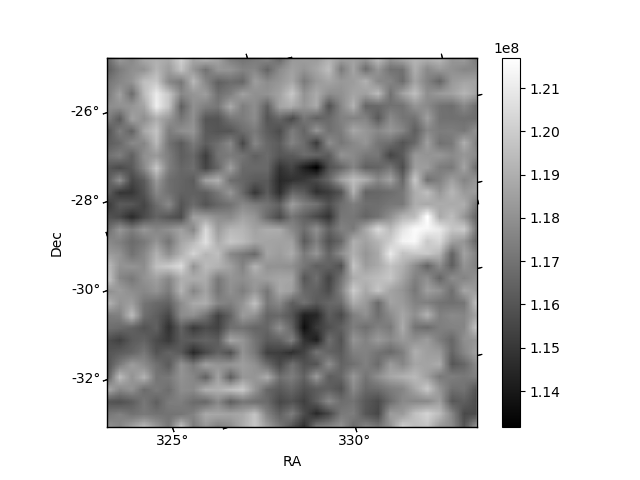
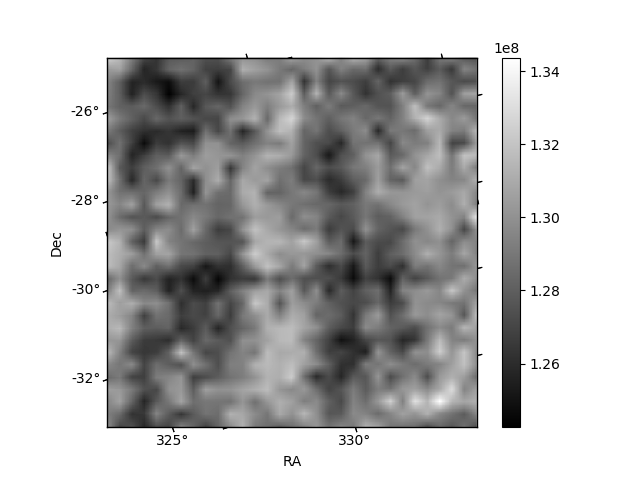
Histogram calculated using DETX and DETY for each event in the final _common_clean file
| Quadrant A | 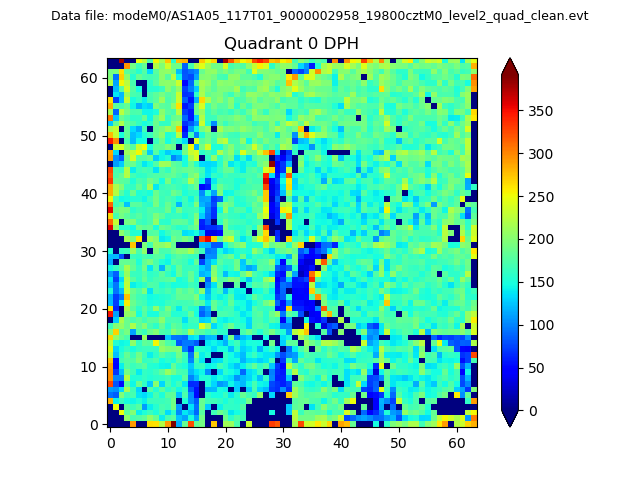 |
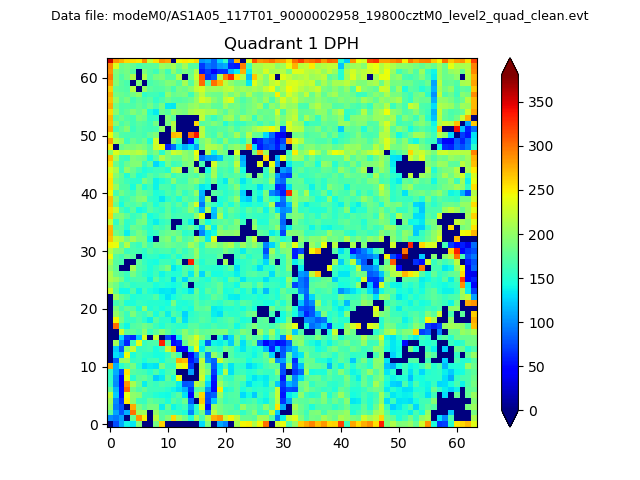 |
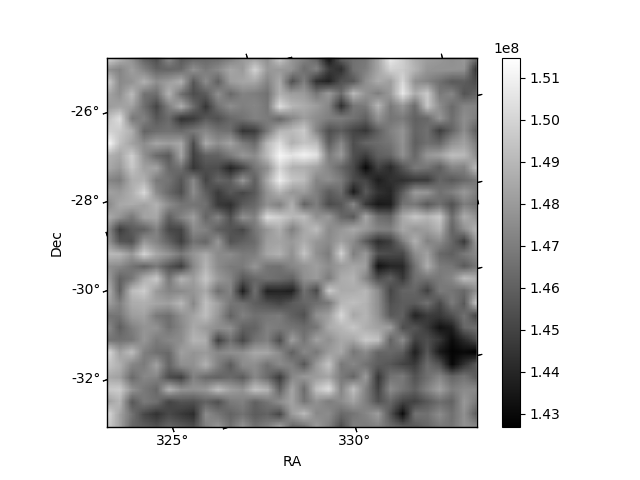
Quadrant B |
|---|---|---|---|
| Quadrant D | 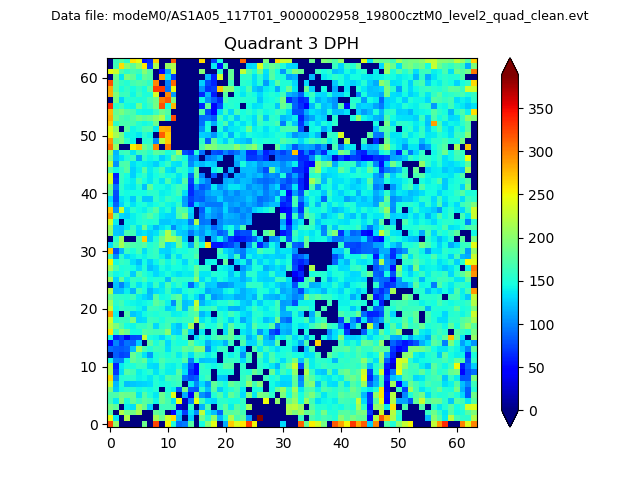 |
 |
Quadrant C |
| Plot type | Count rate plots | Images |
|---|---|---|
| Comparison with Poisson distribution Blue bars denote a histogram of data divided into 1 sec bins. Red curve is a Poisson curve with rate = median count rate of data. |
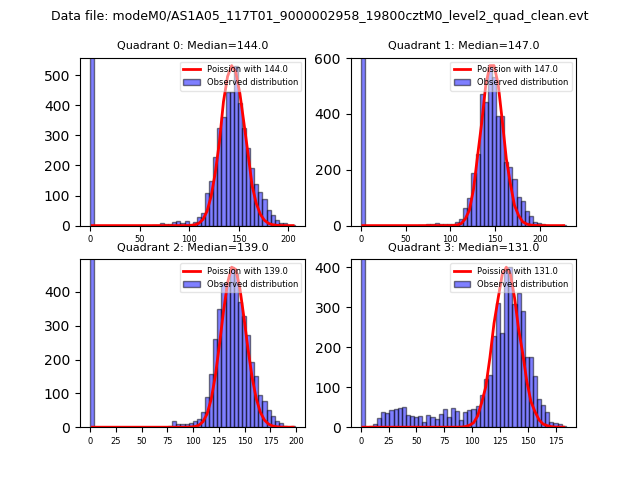 |
 |
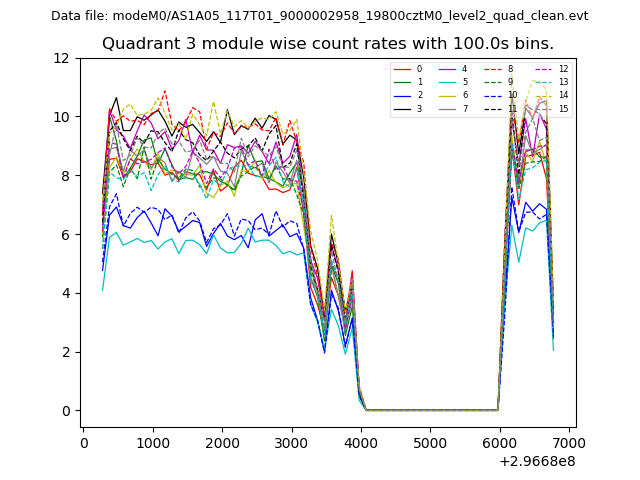
| Quadrant-wise count rates Data is divided into 100 sec bins |
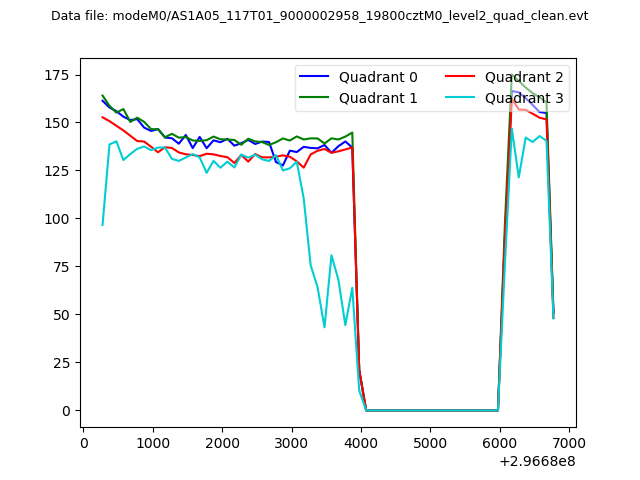 |
|
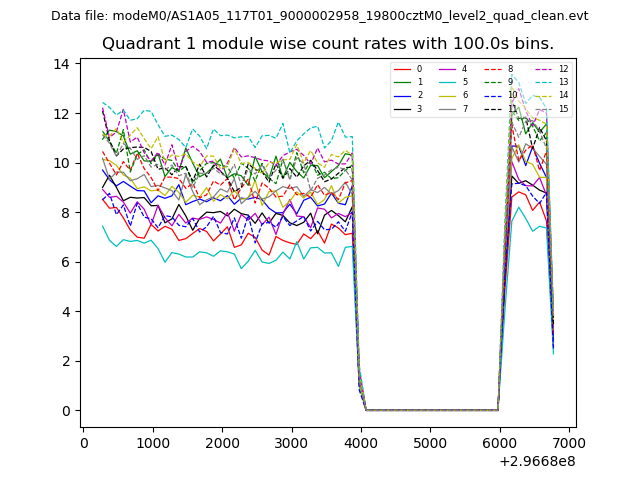
| Module-wise count rates for Quadrant A Data is divided into 100 sec bins |
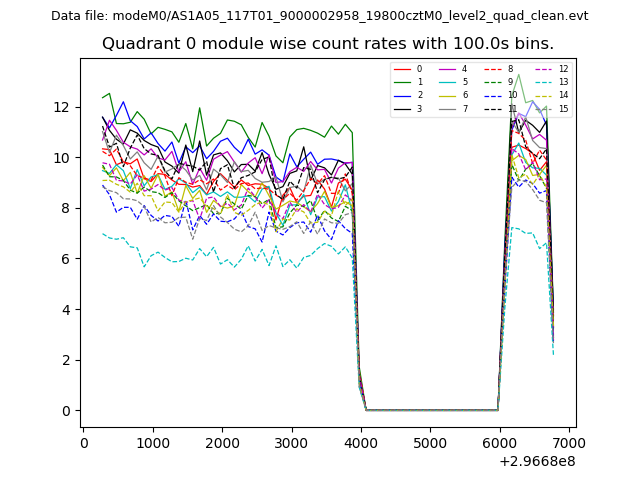 |
 |
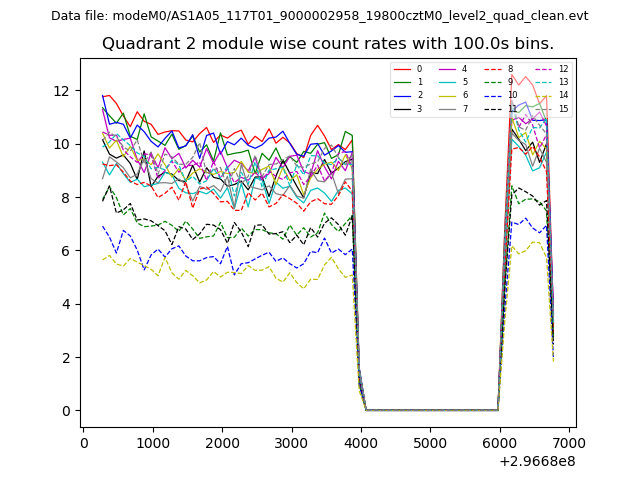
| Module-wise count rates for Quadrant B Data is divided into 100 sec bins |
 |
 |
| Module-wise count rates for Quadrant C Data is divided into 100 sec bins |
 |
 |
| Module-wise count rates for Quadrant D Data is divided into 100 sec bins |
 |
 |
| Parameter | Plot |
|---|---|
| CZT HV Monitor | 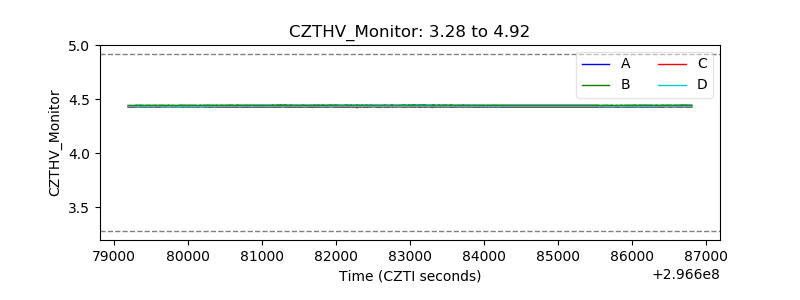 |
| D_VDD | 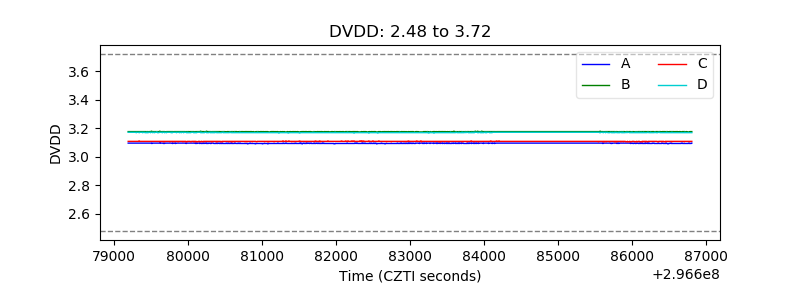 |
| Temperature 1 | 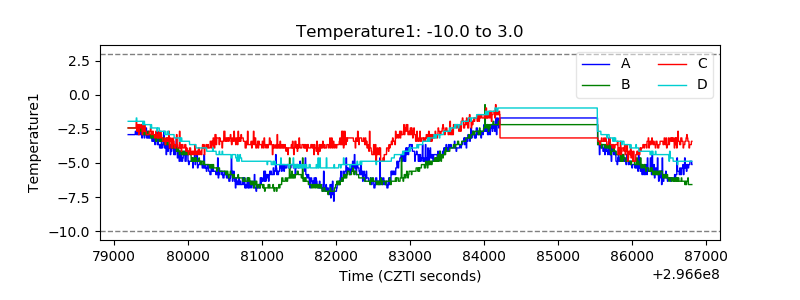 |
| Veto HV Monitor | 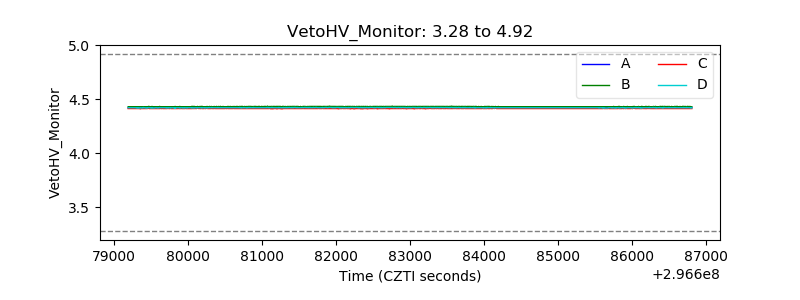 |
| Veto LLD | 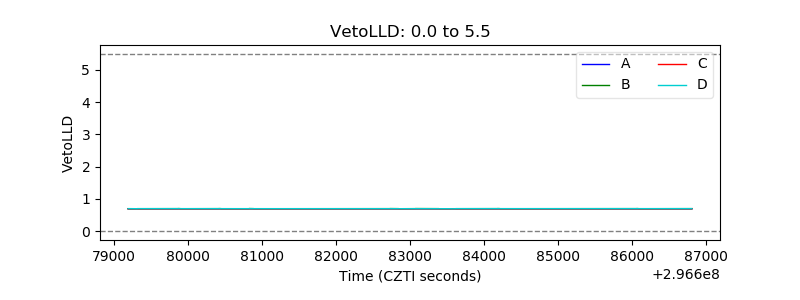 |
| Alpha Counter | 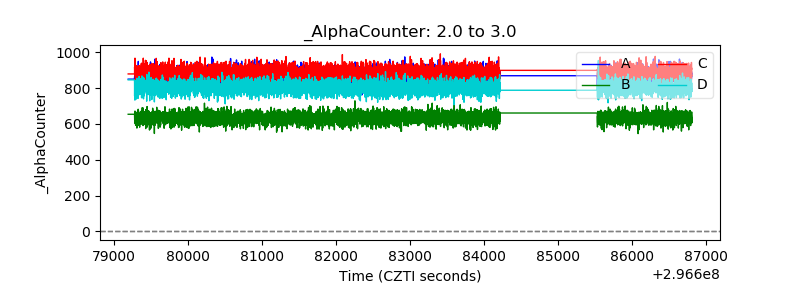 |
| _CPM_Rate | 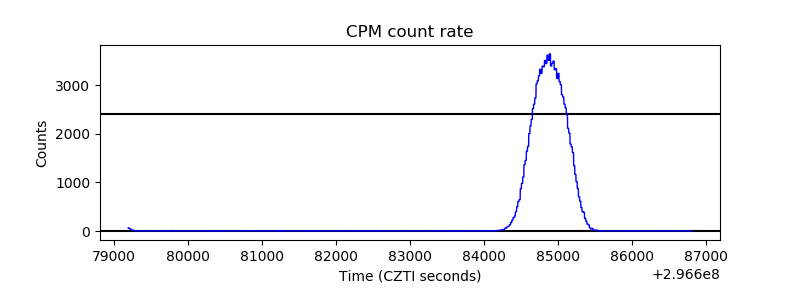 |
| CZT Counter | 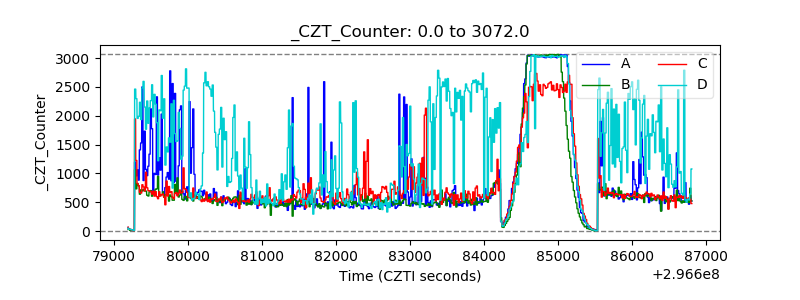 |
| +2.5 Volts monitor |  |
| +5 Volts monitor |  |
| _ROLL_ROT | 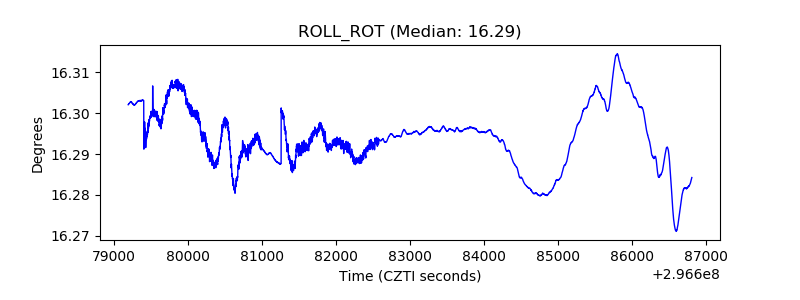 |
| _Roll_DEC | 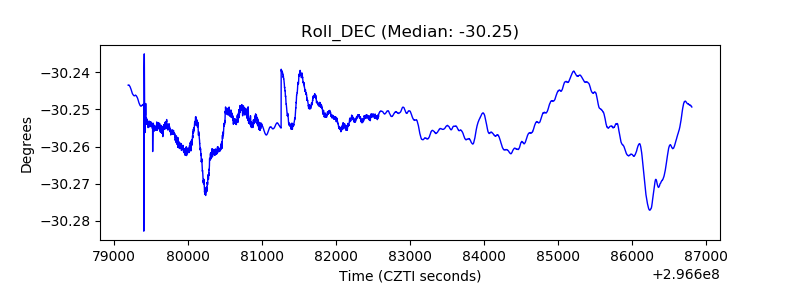 |
| _Roll_RA | 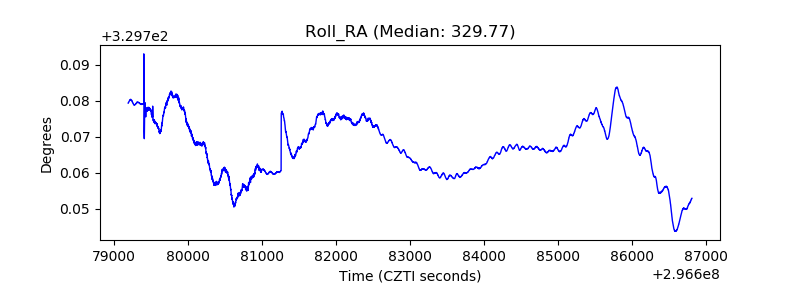 |
| Veto Counter | 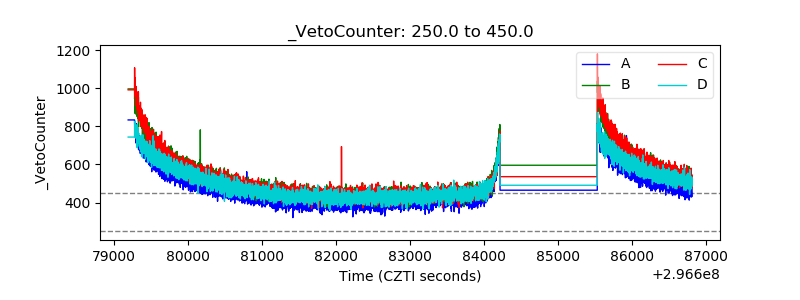 |