| Param | Original file | Final file |
|---|---|---|
| Filename | modeM0/AS1A05_117T01_9000002958_19801cztM0_level2.evt | modeM0/AS1A05_117T01_9000002958_19801cztM0_level2_quad_clean.evt |
| Size (bytes) | 555,220,800 | 104,140,800 |
| Size | 529.5 MB | 99.3 MB |
| Events in quadrant A | 4,033,207 | 687,874 |
| Events in quadrant B | 3,352,226 | 710,090 |
| Events in quadrant C | 3,569,211 | 674,257 |
| Events in quadrant D | 5,441,494 | 650,399 |
| Mode M9 | |||
|---|---|---|---|
| Quadrant | BADHDUFLAG | Total packets | Discarded packets |
| A | 0 | 26 | 0 |
| B | 0 | 26 | 0 |
| C | 0 | 26 | 0 |
| D | 0 | 26 | 0 |
| Mode M0 | |||
|---|---|---|---|
| Quadrant | BADHDUFLAG | Total packets | Discarded packets |
| A | 0 | 15943 | 2 |
| B | 0 | 13815 | 2 |
| C | 0 | 14462 | 2 |
| D | 0 | 20315 | 2 |
| Mode SS | |||
|---|---|---|---|
| Quadrant | BADHDUFLAG | Total packets | Discarded packets |
| A | 0 | 130 | 0 |
| B | 0 | 130 | 0 |
| C | 0 | 130 | 0 |
| D | 0 | 130 | 0 |
| Quadrant | Total seconds | Saturated seconds | Saturation percentage |
|---|---|---|---|
| A | 6170 | 174 | 2.820097% |
| B | 6171 | 129 | 2.090423% |
| C | 6171 | 144 | 2.333495% |
| D | 6171 | 680 | 11.019284% |
Noise dominated data is calculated using 1-second bins in cleaned event files. If a bin has >2000 counts, and if more than 50% of those come from <1% of pixels, then it is considered to be noise-dominated and hence unusable.
| Quadrant | # 1 sec bins | Bins with >0 counts | Bins with >2000 counts | High rate bins dominated by noise | Noise dominated (total time) | Noise dominated (detector-on time) | Marked lightcurve |
|---|---|---|---|---|---|---|---|
| A | 8865 | 6171 | 47 | 47 | 0.53% | 0.76% | 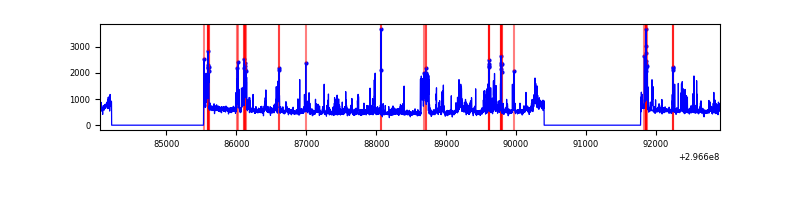 |
| B | 8866 | 6172 | 10 | 10 | 0.11% | 0.16% | 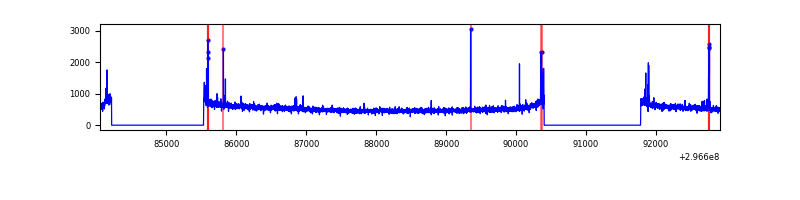 |
| C | 8866 | 6173 | 1 | 1 | 0.01% | 0.02% | 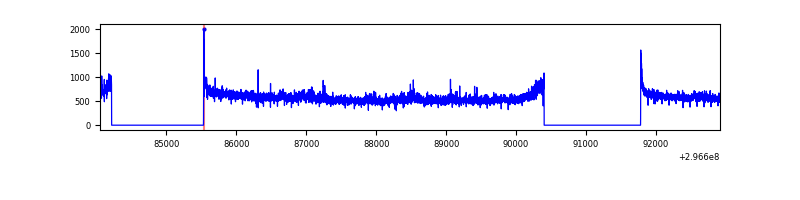 |
| D | 8866 | 6172 | 514 | 514 | 5.80% | 8.33% | 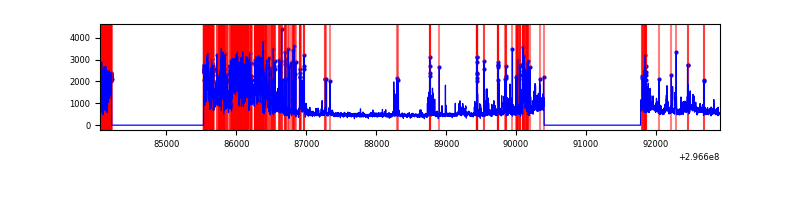 |
Top three noisy pixels from each quadrant. If the there are fewer than three noisy pixels in the level2.evt file, extra rows are filled as -1
| Pixel properties | Quadrant properties | ||||||
|---|---|---|---|---|---|---|---|
| Quadrant | DetID | PixID | Counts | Sigma | Mean | Median | Sigma |
| A | 6 | 16 | 830912 | 4950.06 | 832 | 815 | 167.7 |
| A | 0 | 226 | 7196 | 38.05 | 832 | 815 | 167.7 |
| A | 3 | 137 | 6434 | 33.51 | 832 | 815 | 167.7 |
| B | 7 | 220 | 41362 | 260.1 | 835 | 817 | 155.9 |
| B | 0 | 230 | 18438 | 113.04 | 835 | 817 | 155.9 |
| B | 12 | 111 | 17956 | 109.95 | 835 | 817 | 155.9 |
| C | 3 | 233 | 282674 | 1512.07 | 810 | 818 | 186.4 |
| C | 14 | 238 | 129069 | 688.03 | 810 | 818 | 186.4 |
| C | 13 | 61 | 5663 | 25.99 | 810 | 818 | 186.4 |
| D | 7 | 238 | 1410678 | 7566.33 | 780 | 760 | 186.3 |
| D | 1 | 52 | 869227 | 4660.63 | 780 | 760 | 186.3 |
| D | 7 | 96 | 65985 | 350.03 | 780 | 760 | 186.3 |
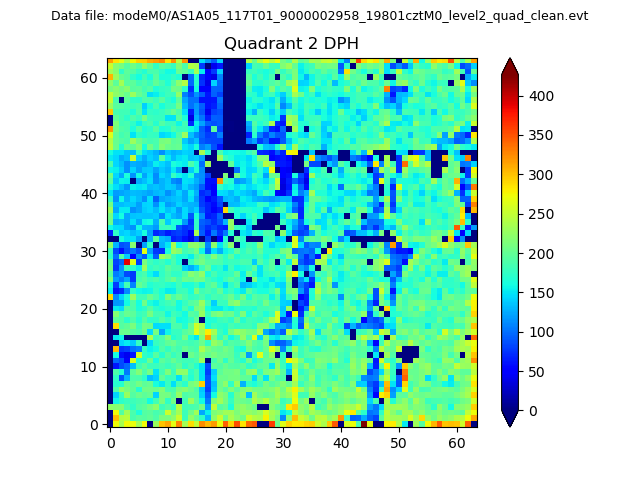
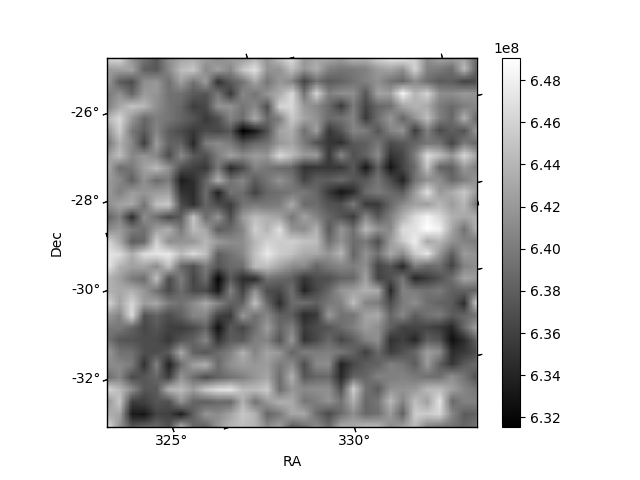
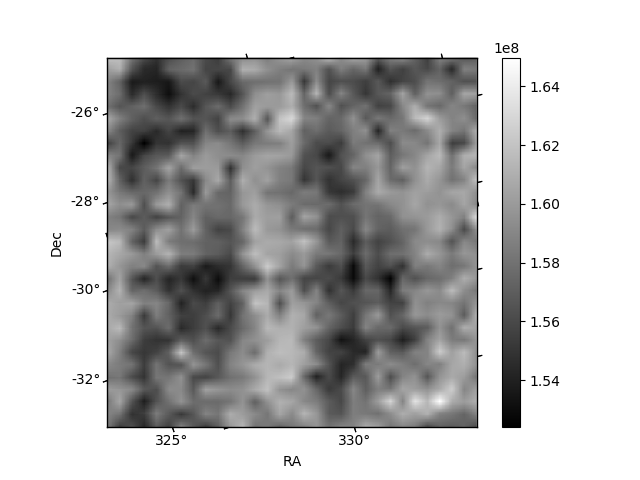
Histogram calculated using DETX and DETY for each event in the final _common_clean file
| Quadrant A | 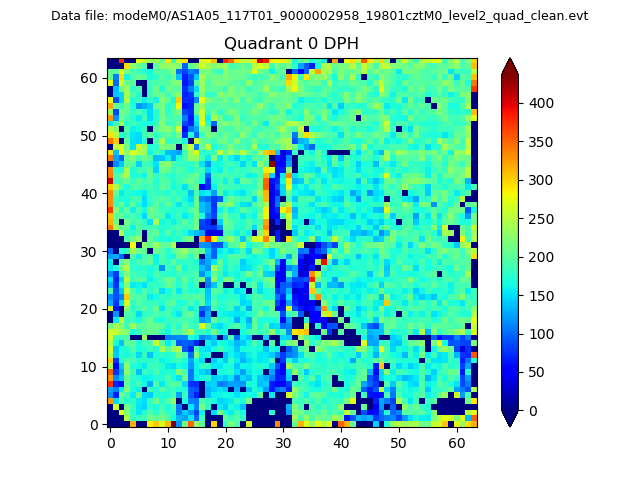 |
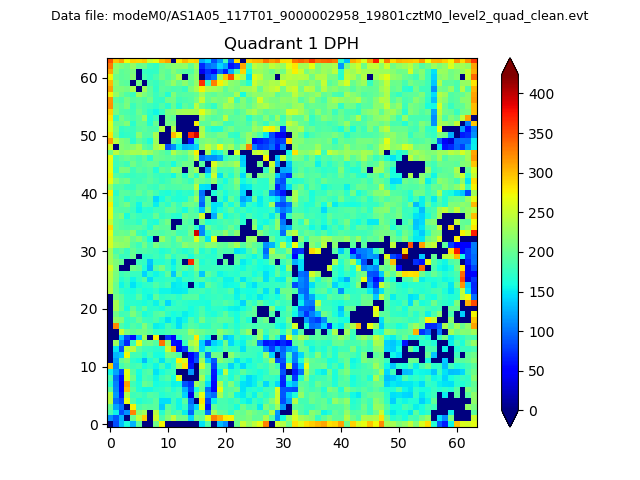 |
Quadrant B |
|---|---|---|---|
| Quadrant D | 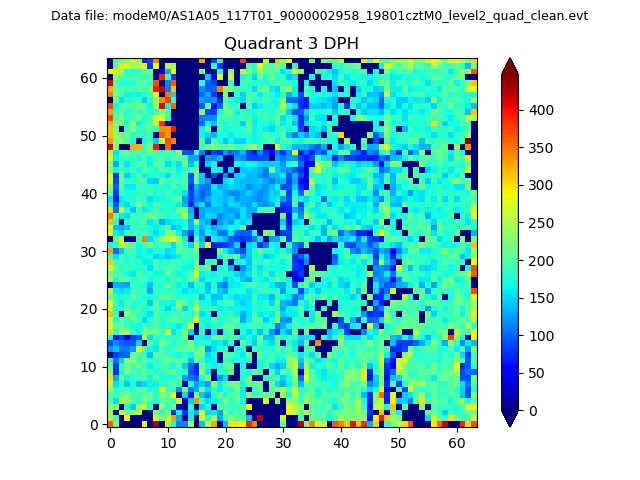 |
 |
Quadrant C |
| Plot type | Count rate plots | Images |
|---|---|---|
| Comparison with Poisson distribution Blue bars denote a histogram of data divided into 1 sec bins. Red curve is a Poisson curve with rate = median count rate of data. |
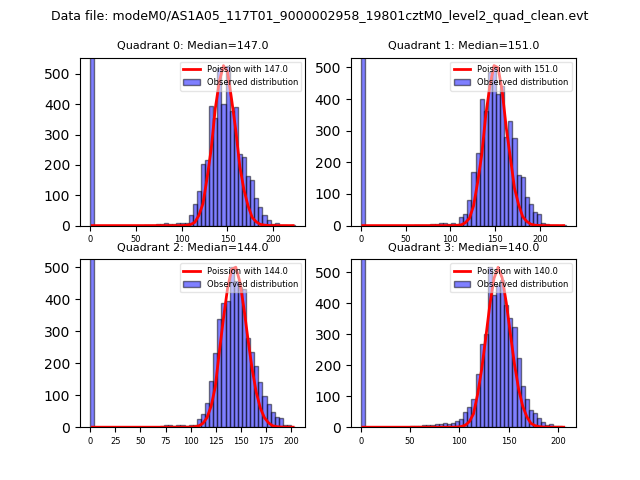 |
 |
| Quadrant-wise count rates Data is divided into 100 sec bins |
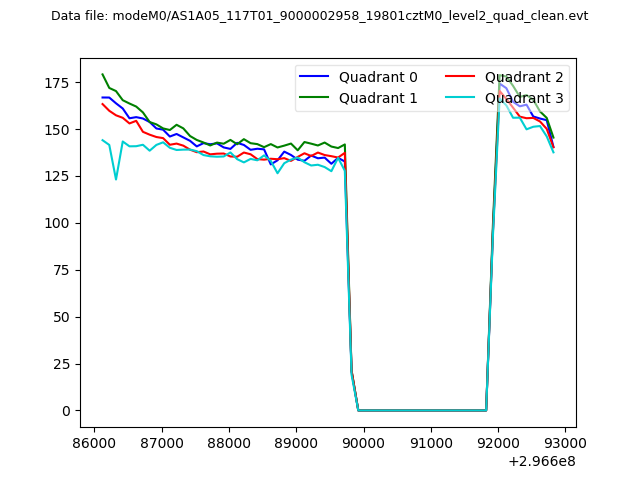 |
|
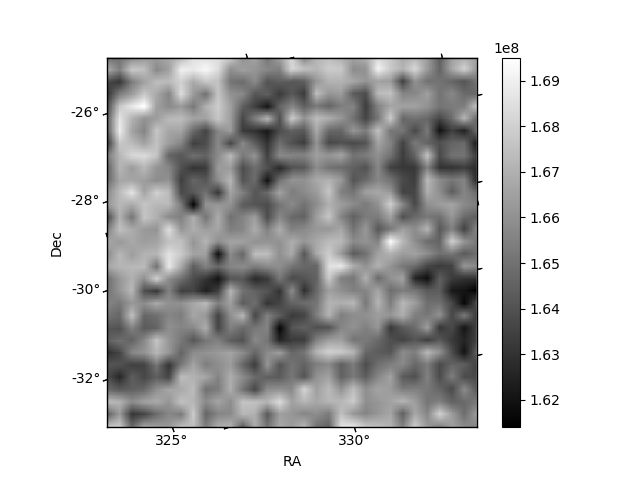
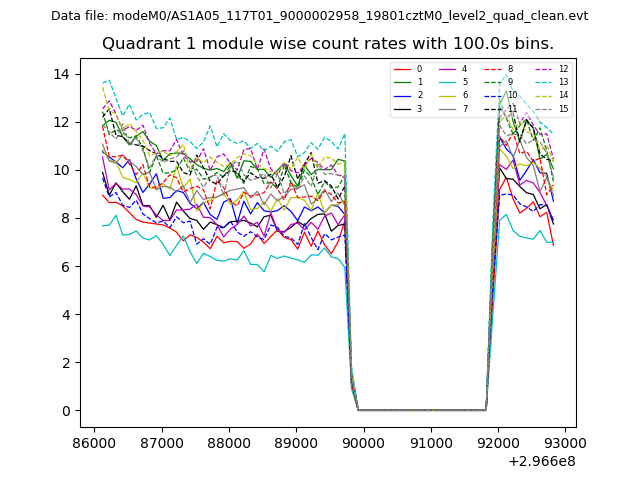
| Module-wise count rates for Quadrant A Data is divided into 100 sec bins |
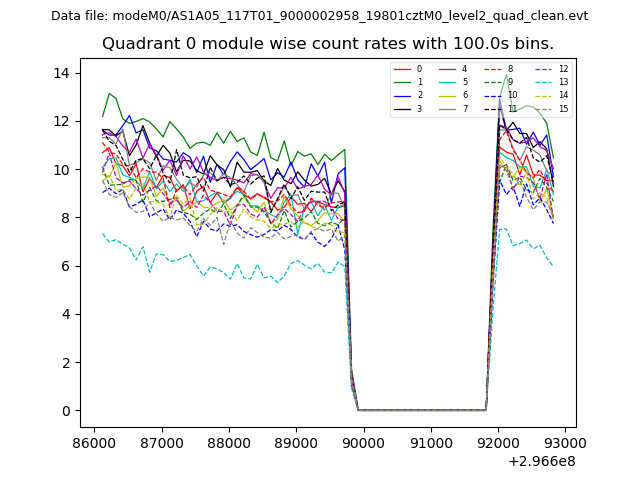 |
 |
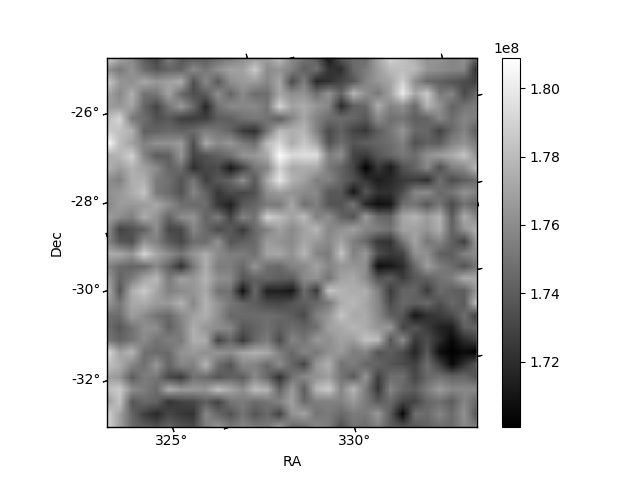
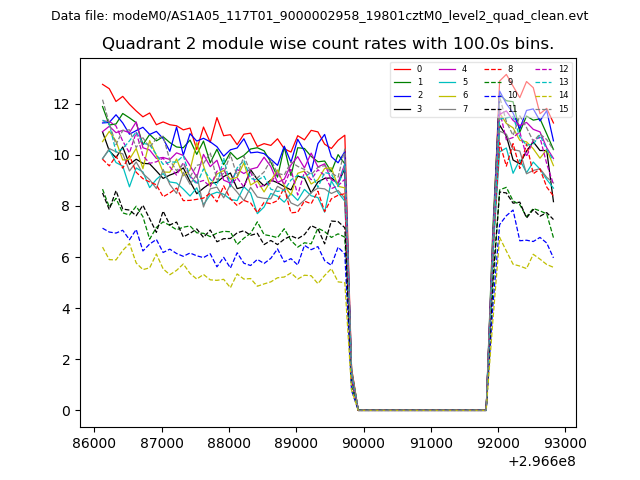
| Module-wise count rates for Quadrant B Data is divided into 100 sec bins |
 |
 |
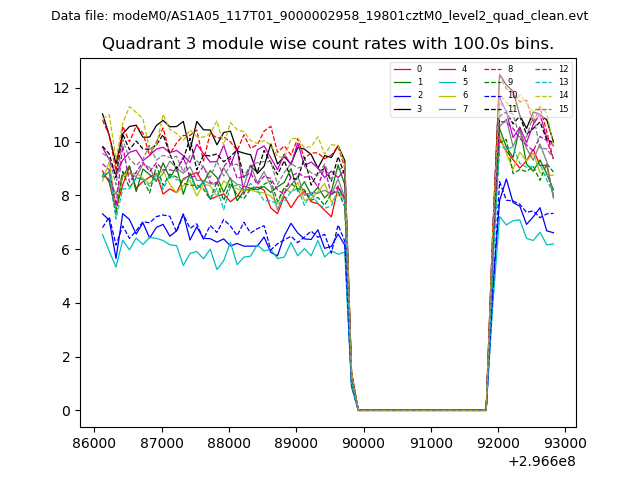
| Module-wise count rates for Quadrant C Data is divided into 100 sec bins |
 |
 |
| Module-wise count rates for Quadrant D Data is divided into 100 sec bins |
 |
 |
| Parameter | Plot |
|---|---|
| CZT HV Monitor | 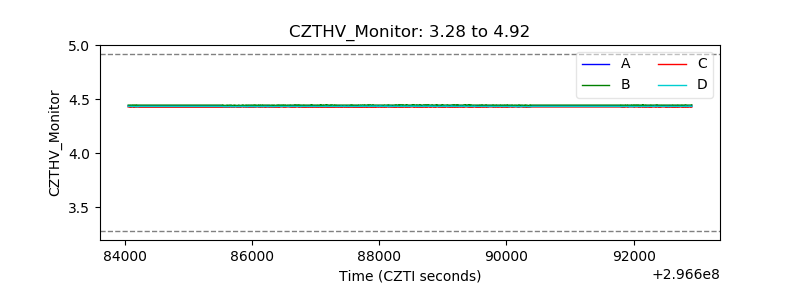 |
| D_VDD | 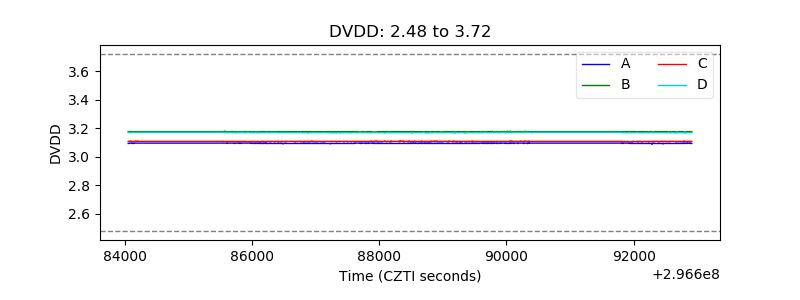 |
| Temperature 1 |  |
| Veto HV Monitor | 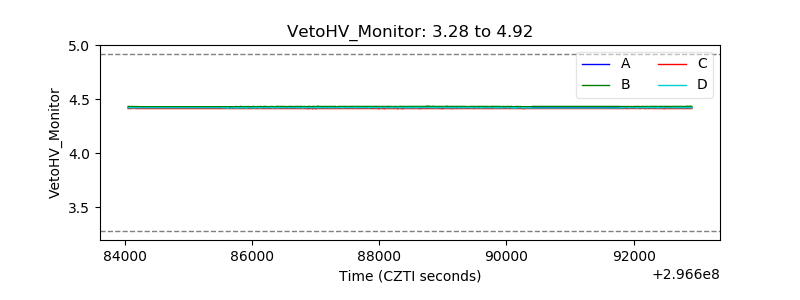 |
| Veto LLD | 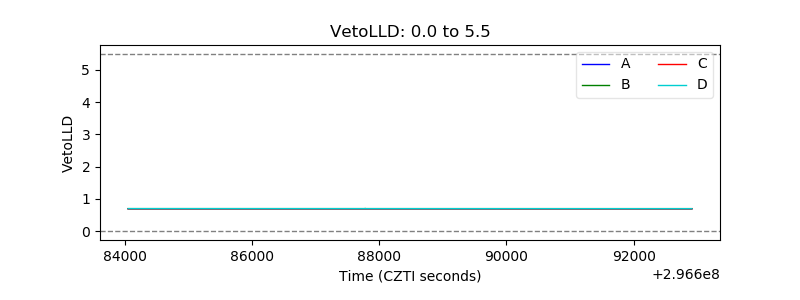 |
| Alpha Counter | 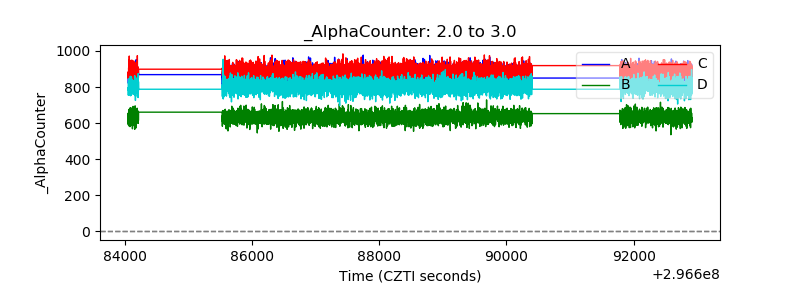 |
| _CPM_Rate | 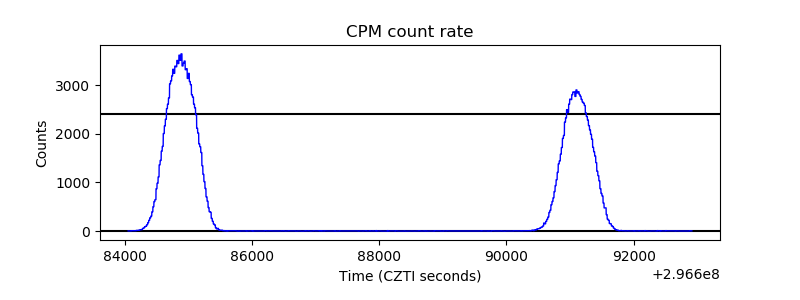 |
| CZT Counter | 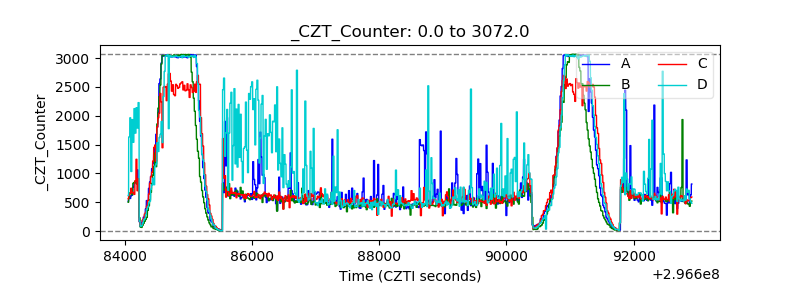 |
| +2.5 Volts monitor |  |
| +5 Volts monitor |  |
| _ROLL_ROT |  |
| _Roll_DEC |  |
| _Roll_RA | 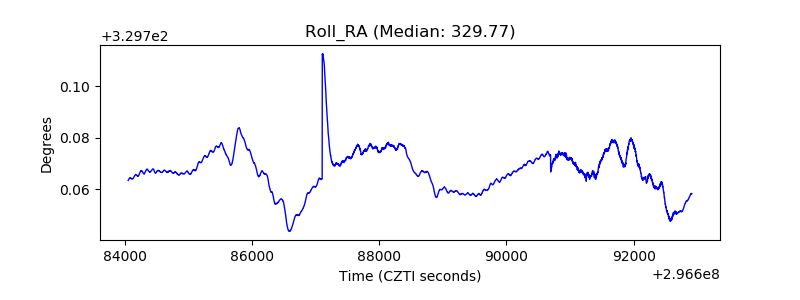 |
| Veto Counter | 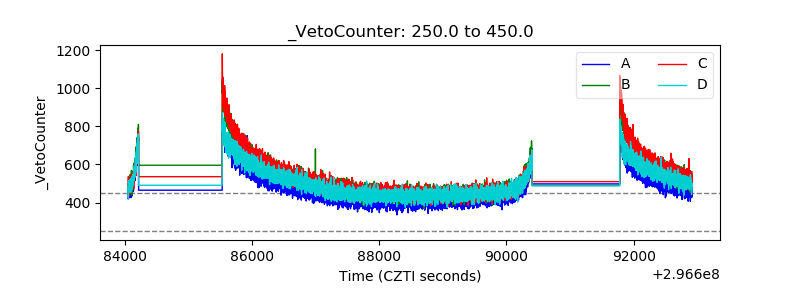 |