| Param | Original file | Final file |
|---|---|---|
| Filename | modeM0/AS1A05_117T01_9000002958_19802cztM0_level2.evt | modeM0/AS1A05_117T01_9000002958_19802cztM0_level2_quad_clean.evt |
| Size (bytes) | 555,425,280 | 109,160,640 |
| Size | 529.7 MB | 104.1 MB |
| Events in quadrant A | 5,364,656 | 704,861 |
| Events in quadrant B | 3,478,865 | 741,273 |
| Events in quadrant C | 3,570,913 | 711,608 |
| Events in quadrant D | 3,966,845 | 695,615 |
| Mode M9 | |||
|---|---|---|---|
| Quadrant | BADHDUFLAG | Total packets | Discarded packets |
| A | 0 | 27 | 0 |
| B | 0 | 27 | 0 |
| C | 0 | 27 | 0 |
| D | 0 | 27 | 0 |
| Mode M0 | |||
|---|---|---|---|
| Quadrant | BADHDUFLAG | Total packets | Discarded packets |
| A | 0 | 20349 | 2 |
| B | 0 | 14367 | 2 |
| C | 0 | 14472 | 2 |
| D | 0 | 16086 | 2 |
| Mode SS | |||
|---|---|---|---|
| Quadrant | BADHDUFLAG | Total packets | Discarded packets |
| A | 0 | 134 | 0 |
| B | 0 | 134 | 0 |
| C | 0 | 134 | 0 |
| D | 0 | 134 | 0 |
| Quadrant | Total seconds | Saturated seconds | Saturation percentage |
|---|---|---|---|
| A | 6490 | 439 | 6.764253% |
| B | 6490 | 122 | 1.879815% |
| C | 6490 | 118 | 1.818182% |
| D | 6490 | 107 | 1.648690% |
Noise dominated data is calculated using 1-second bins in cleaned event files. If a bin has >2000 counts, and if more than 50% of those come from <1% of pixels, then it is considered to be noise-dominated and hence unusable.
| Quadrant | # 1 sec bins | Bins with >0 counts | Bins with >2000 counts | High rate bins dominated by noise | Noise dominated (total time) | Noise dominated (detector-on time) | Marked lightcurve |
|---|---|---|---|---|---|---|---|
| A | 9220 | 6492 | 311 | 311 | 3.37% | 4.79% | 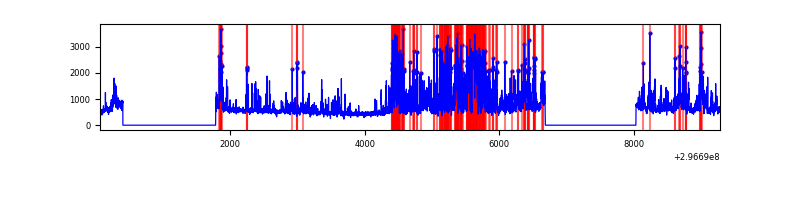 |
| B | 9220 | 6492 | 14 | 14 | 0.15% | 0.22% | 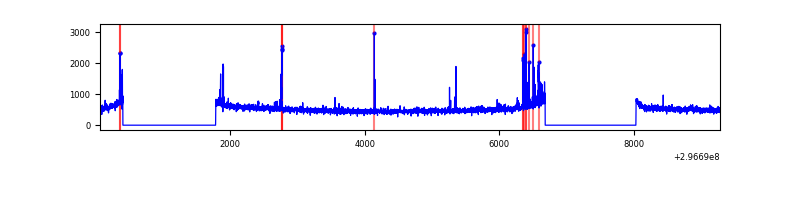 |
| C | 9220 | 6492 | 0 | 0 | 0.00% | 0.00% | 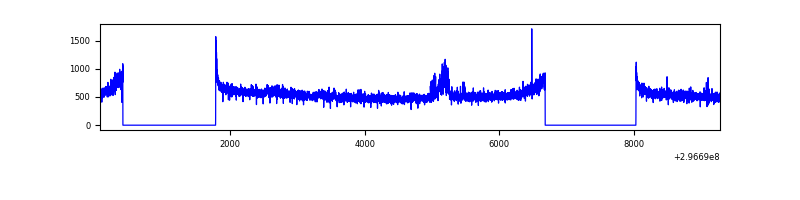 |
| D | 9220 | 6492 | 52 | 52 | 0.56% | 0.80% | 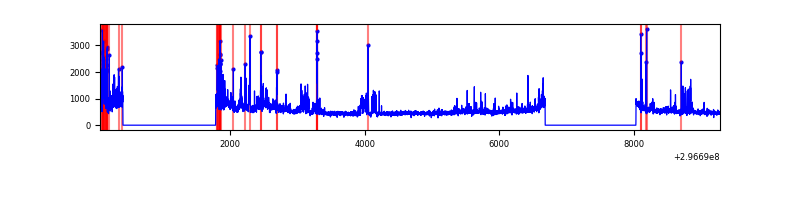 |
Top three noisy pixels from each quadrant. If the there are fewer than three noisy pixels in the level2.evt file, extra rows are filled as -1
| Pixel properties | Quadrant properties | ||||||
|---|---|---|---|---|---|---|---|
| Quadrant | DetID | PixID | Counts | Sigma | Mean | Median | Sigma |
| A | 6 | 16 | 2161876 | 12996.28 | 833 | 816 | 166.3 |
| A | 0 | 226 | 6915 | 36.68 | 833 | 816 | 166.3 |
| A | 3 | 137 | 6434 | 33.79 | 833 | 816 | 166.3 |
| B | 7 | 220 | 90434 | 563.03 | 850 | 830 | 159.1 |
| B | 4 | 80 | 21186 | 127.91 | 850 | 830 | 159.1 |
| B | 0 | 230 | 18864 | 113.32 | 850 | 830 | 159.1 |
| C | 3 | 233 | 205867 | 1063.49 | 830 | 839 | 192.8 |
| C | 14 | 238 | 131029 | 675.3 | 830 | 839 | 192.8 |
| C | 13 | 61 | 5821 | 25.84 | 830 | 839 | 192.8 |
| D | 1 | 52 | 516102 | 2570.43 | 833 | 812 | 200.5 |
| D | 7 | 238 | 195271 | 970.02 | 833 | 812 | 200.5 |
| D | 2 | 184 | 50616 | 248.44 | 833 | 812 | 200.5 |
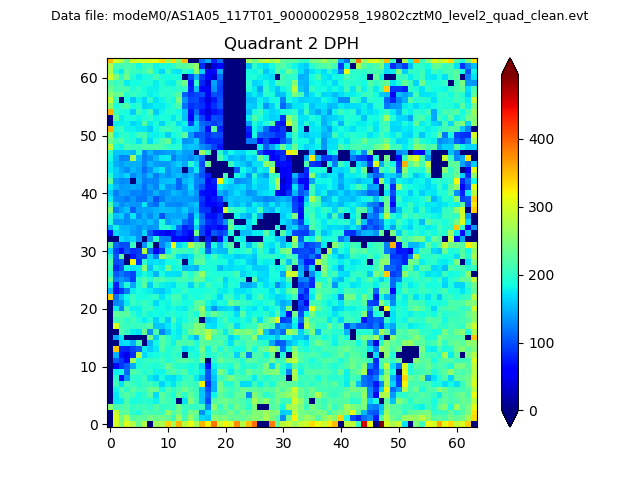
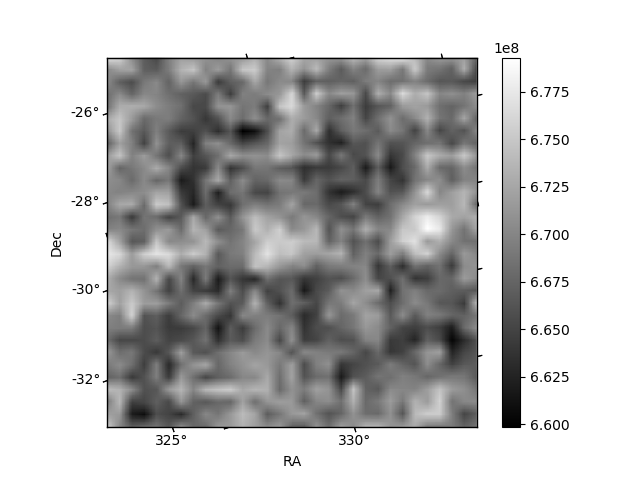
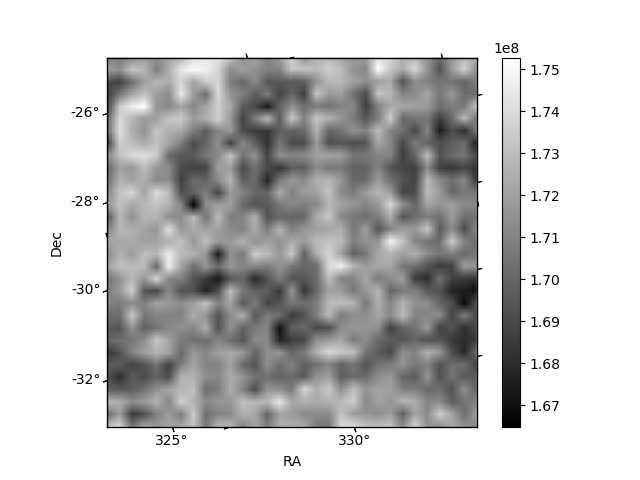
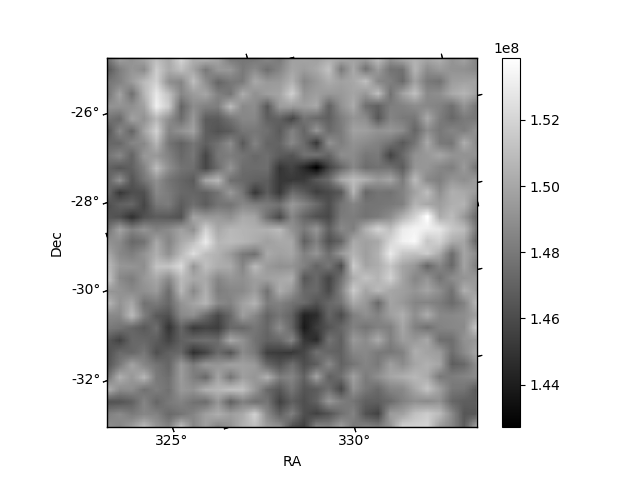
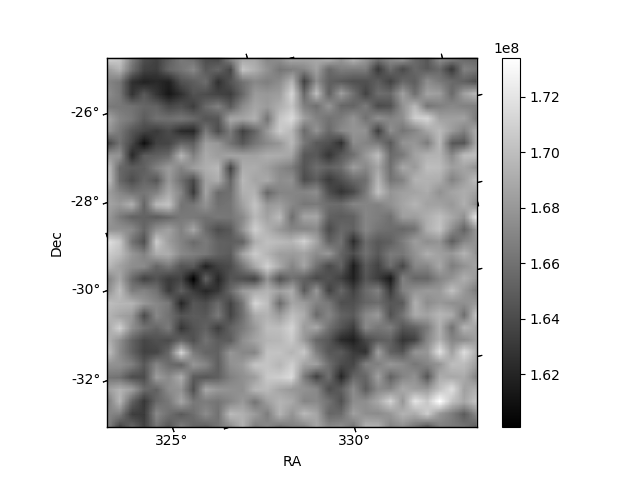
Histogram calculated using DETX and DETY for each event in the final _common_clean file
| Quadrant A | 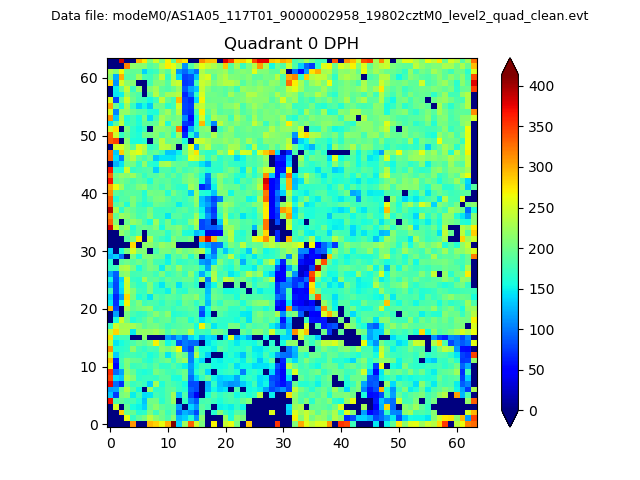 |
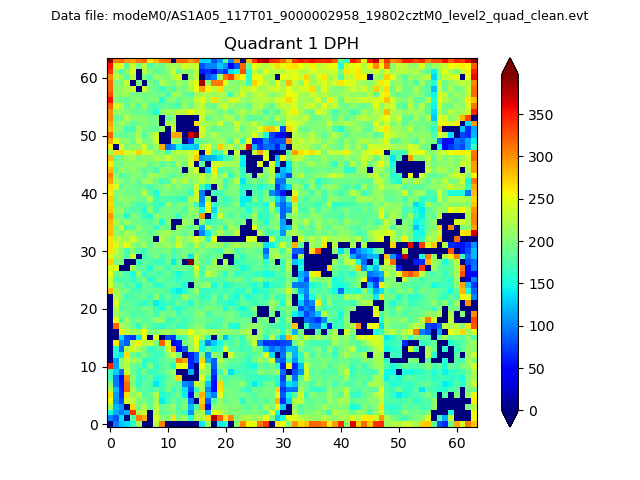 |
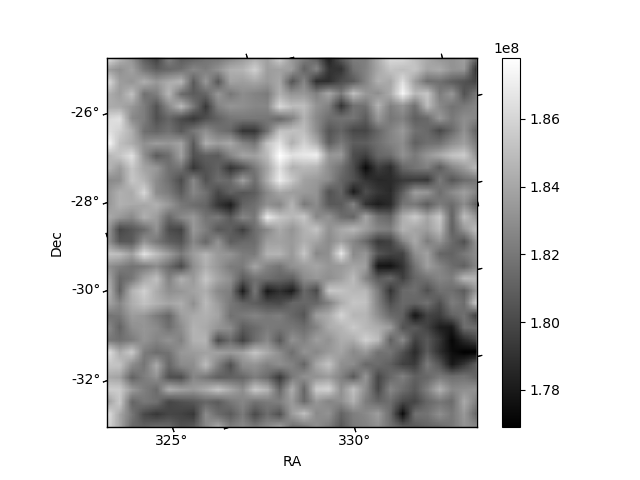
Quadrant B |
|---|---|---|---|
| Quadrant D | 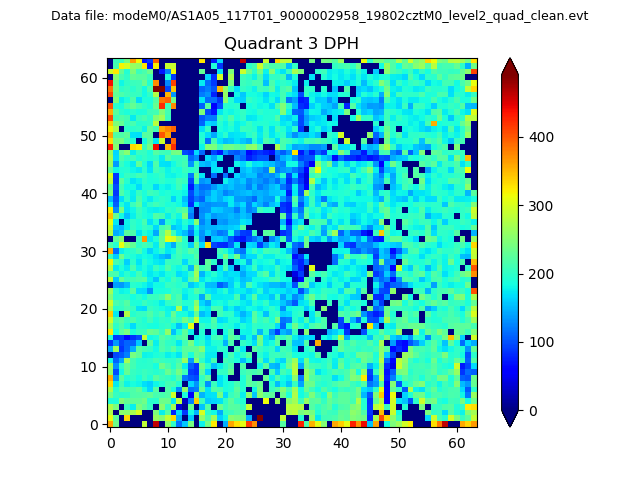 |
 |
Quadrant C |
| Plot type | Count rate plots | Images |
|---|---|---|
| Comparison with Poisson distribution Blue bars denote a histogram of data divided into 1 sec bins. Red curve is a Poisson curve with rate = median count rate of data. |
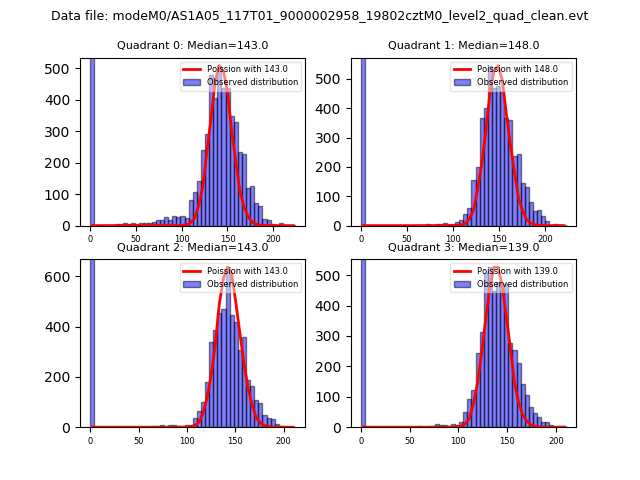 |
 |
| Quadrant-wise count rates Data is divided into 100 sec bins |
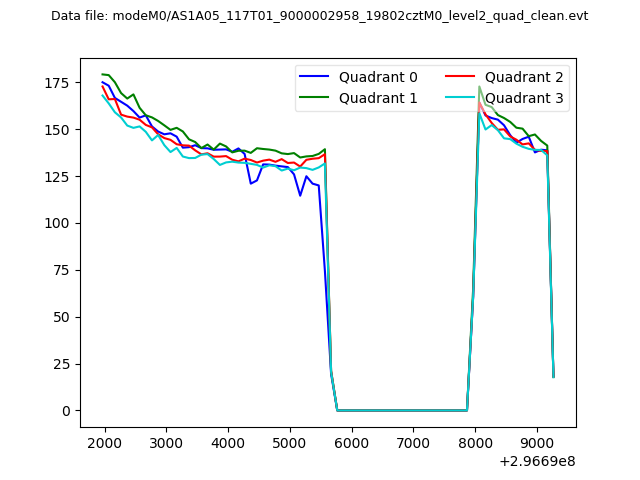 |
|
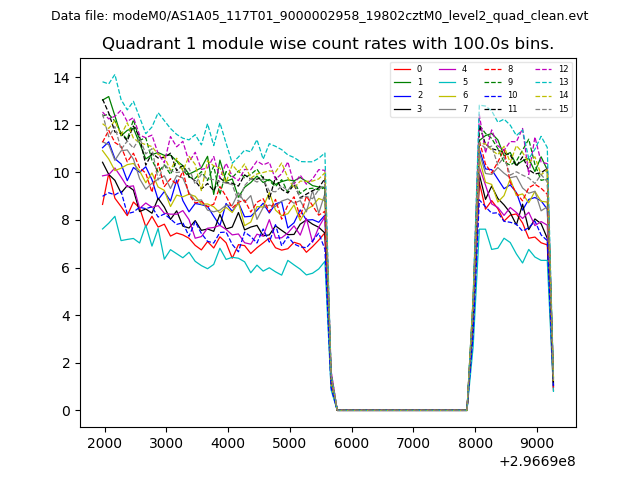
| Module-wise count rates for Quadrant A Data is divided into 100 sec bins |
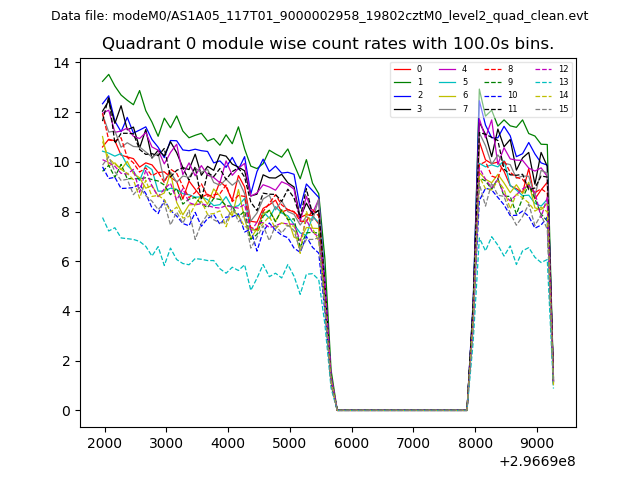 |
 |
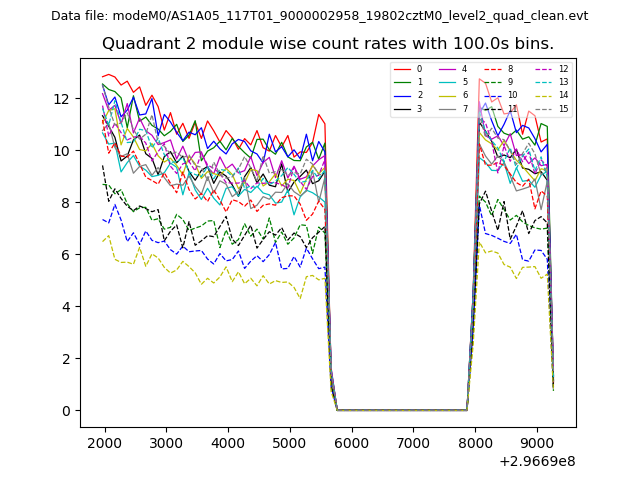
| Module-wise count rates for Quadrant B Data is divided into 100 sec bins |
 |
 |
| Module-wise count rates for Quadrant C Data is divided into 100 sec bins |
 |
 |
| Module-wise count rates for Quadrant D Data is divided into 100 sec bins |
 |
 |
| Parameter | Plot |
|---|---|
| CZT HV Monitor | 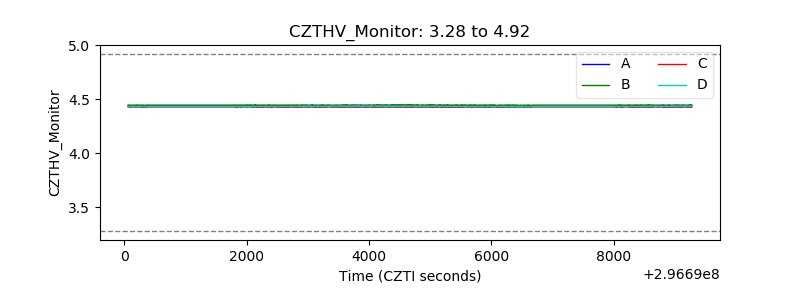 |
| D_VDD | 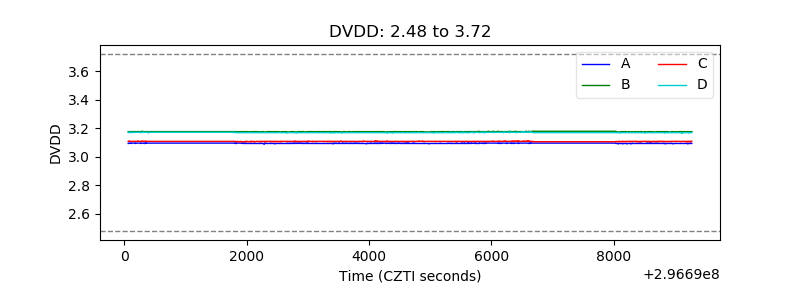 |
| Temperature 1 | 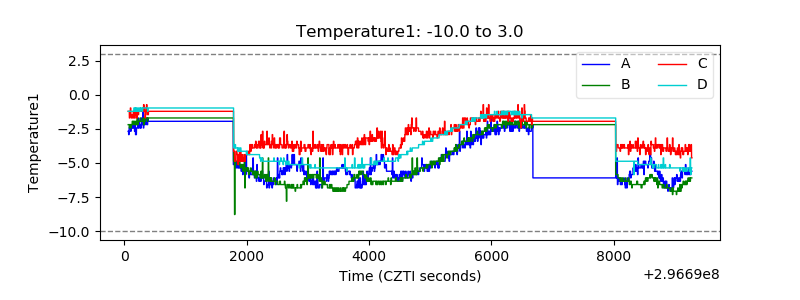 |
| Veto HV Monitor | 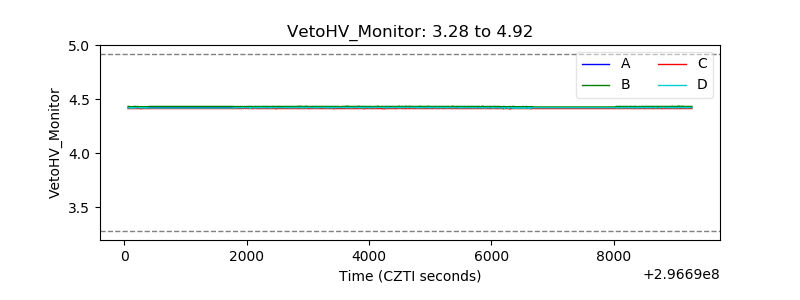 |
| Veto LLD |  |
| Alpha Counter | 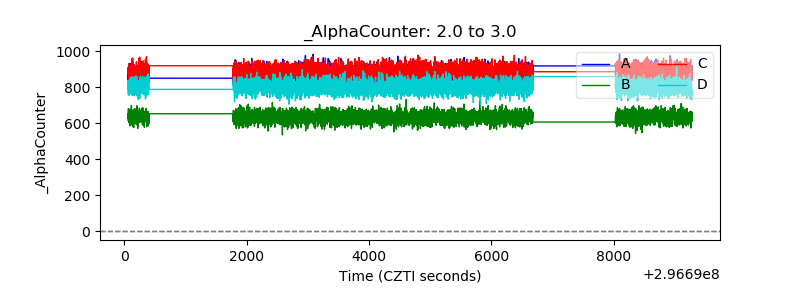 |
| _CPM_Rate | 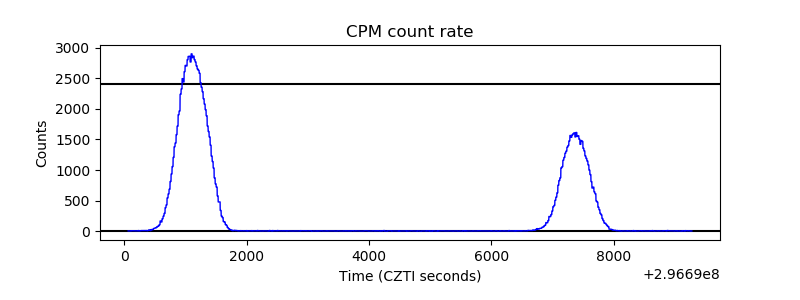 |
| CZT Counter | 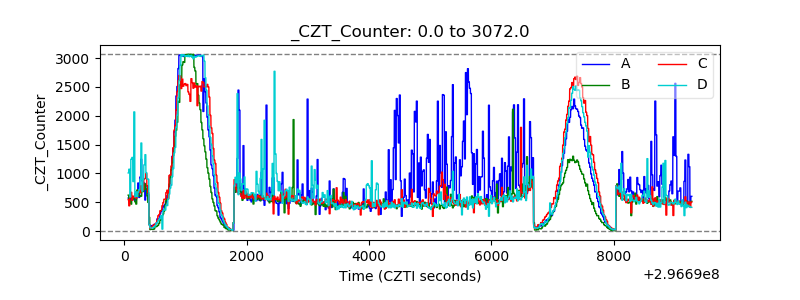 |
| +2.5 Volts monitor |  |
| +5 Volts monitor |  |
| _ROLL_ROT |  |
| _Roll_DEC | 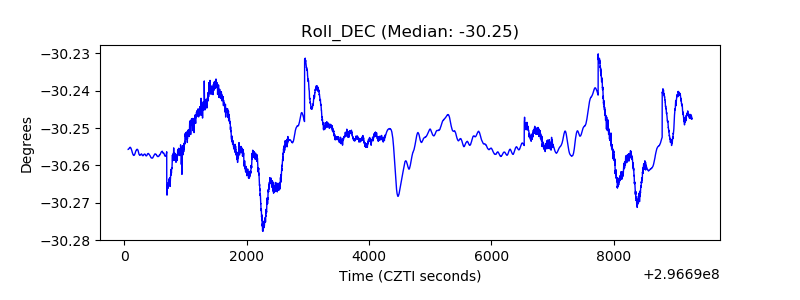 |
| _Roll_RA | 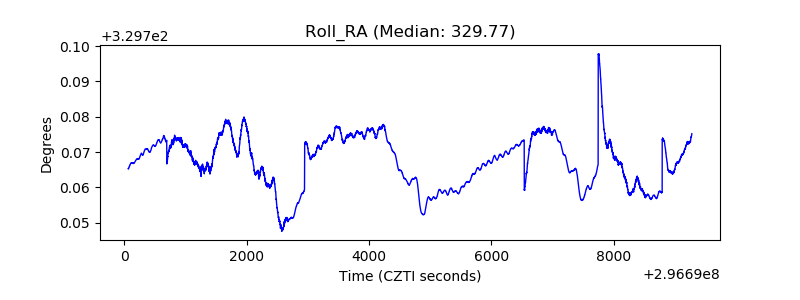 |
| Veto Counter |  |