| Param | Original file | Final file |
|---|---|---|
| Filename | modeM0/AS1A05_117T01_9000002958_19803cztM0_level2.evt | modeM0/AS1A05_117T01_9000002958_19803cztM0_level2_quad_clean.evt |
| Size (bytes) | 250,752,960 | 58,858,560 |
| Size | 239.1 MB | 56.1 MB |
| Events in quadrant A | 2,859,113 | 384,573 |
| Events in quadrant B | 1,366,485 | 411,421 |
| Events in quadrant C | 1,405,187 | 395,357 |
| Events in quadrant D | 1,766,780 | 385,851 |
| Mode M9 | |||
|---|---|---|---|
| Quadrant | BADHDUFLAG | Total packets | Discarded packets |
| A | 0 | 7 | 0 |
| B | 0 | 8 | 0 |
| C | 0 | 8 | 0 |
| D | 0 | 8 | 0 |
| Mode M0 | |||
|---|---|---|---|
| Quadrant | BADHDUFLAG | Total packets | Discarded packets |
| A | 0 | 10504 | 1 |
| B | 0 | 5905 | 1 |
| C | 0 | 5928 | 1 |
| D | 0 | 7175 | 1 |
| Mode SS | |||
|---|---|---|---|
| Quadrant | BADHDUFLAG | Total packets | Discarded packets |
| A | 0 | 58 | 0 |
| B | 0 | 58 | 0 |
| C | 0 | 58 | 0 |
| D | 0 | 58 | 0 |
| Quadrant | Total seconds | Saturated seconds | Saturation percentage |
|---|---|---|---|
| A | 2868 | 241 | 8.403068% |
| B | 2868 | 5 | 0.174338% |
| C | 2868 | 21 | 0.732218% |
| D | 2868 | 72 | 2.510460% |
Noise dominated data is calculated using 1-second bins in cleaned event files. If a bin has >2000 counts, and if more than 50% of those come from <1% of pixels, then it is considered to be noise-dominated and hence unusable.
| Quadrant | # 1 sec bins | Bins with >0 counts | Bins with >2000 counts | High rate bins dominated by noise | Noise dominated (total time) | Noise dominated (detector-on time) | Marked lightcurve |
|---|---|---|---|---|---|---|---|
| A | 2868 | 2868 | 232 | 232 | 8.09% | 8.09% | 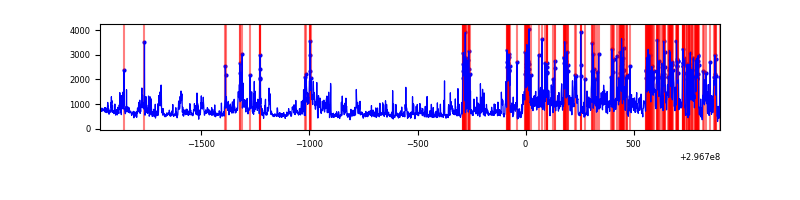 |
| B | 2868 | 2868 | 0 | 0 | 0.00% | 0.00% | 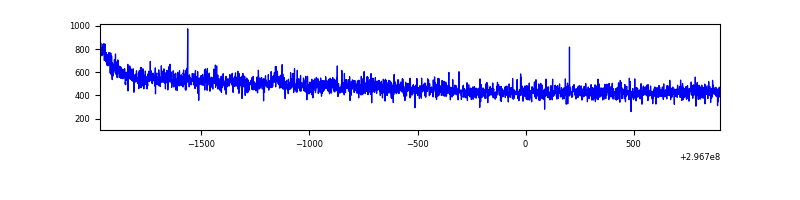 |
| C | 2868 | 2868 | 0 | 0 | 0.00% | 0.00% | 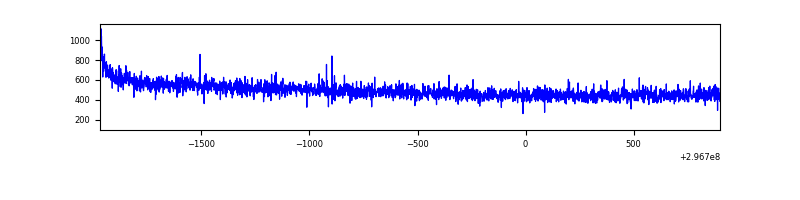 |
| D | 2868 | 2868 | 69 | 69 | 2.41% | 2.41% | 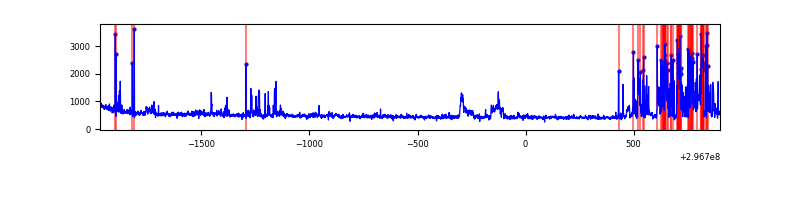 |
Top three noisy pixels from each quadrant. If the there are fewer than three noisy pixels in the level2.evt file, extra rows are filled as -1
| Pixel properties | Quadrant properties | ||||||
|---|---|---|---|---|---|---|---|
| Quadrant | DetID | PixID | Counts | Sigma | Mean | Median | Sigma |
| A | 6 | 16 | 1561529 | 22556.67 | 337 | 331 | 69.2 |
| A | 0 | 226 | 2795 | 35.6 | 337 | 331 | 69.2 |
| A | 3 | 137 | 2489 | 31.18 | 337 | 331 | 69.2 |
| B | 12 | 111 | 7512 | 107.19 | 349 | 341 | 66.9 |
| B | 11 | 111 | 6791 | 96.42 | 349 | 341 | 66.9 |
| B | 14 | 111 | 6048 | 85.31 | 349 | 341 | 66.9 |
| C | 14 | 238 | 53550 | 652.51 | 343 | 346 | 81.5 |
| C | 3 | 233 | 12096 | 144.11 | 343 | 346 | 81.5 |
| C | 13 | 61 | 2411 | 25.33 | 343 | 346 | 81.5 |
| D | 12 | 218 | 275521 | 3305.81 | 340 | 332 | 83.2 |
| D | 1 | 52 | 132911 | 1592.65 | 340 | 332 | 83.2 |
| D | 7 | 238 | 22105 | 261.56 | 340 | 332 | 83.2 |
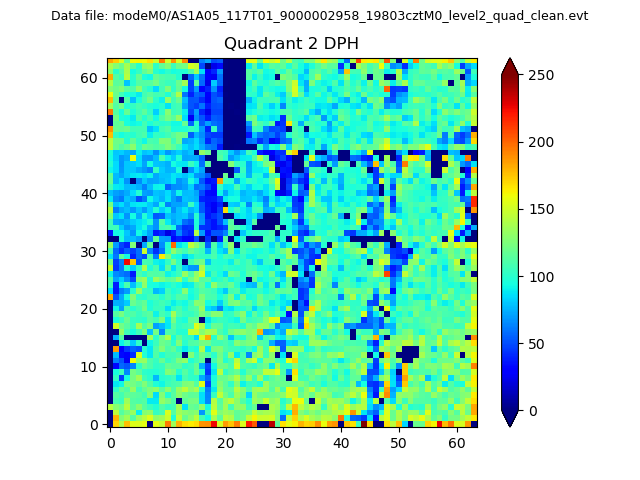
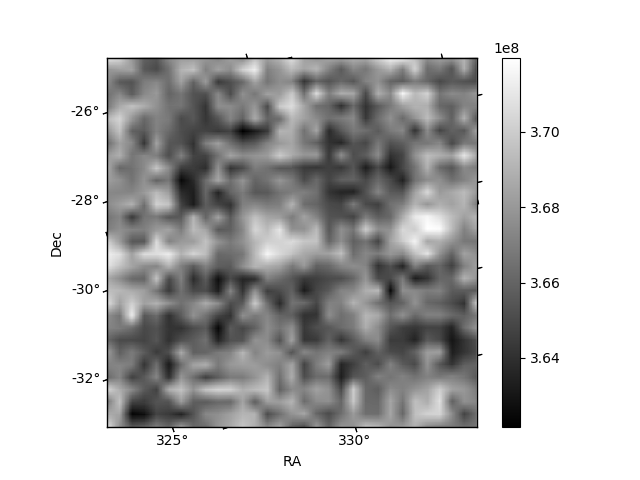
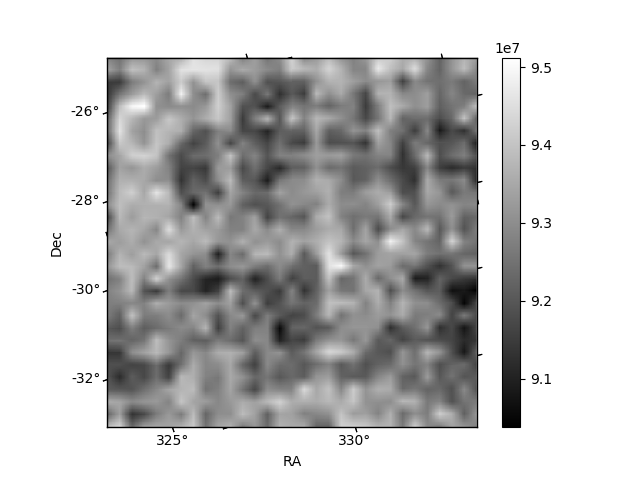
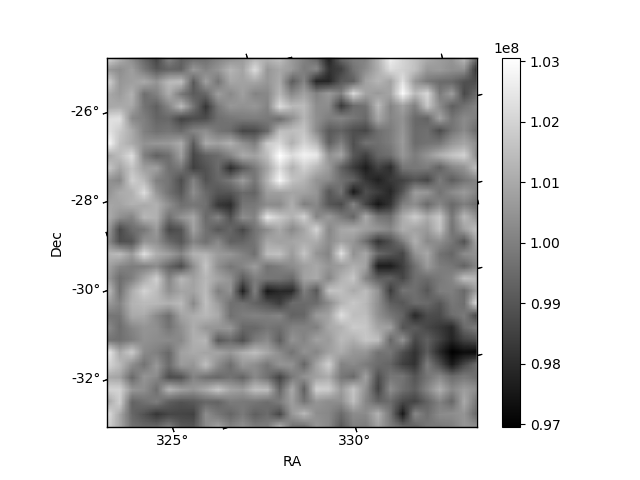
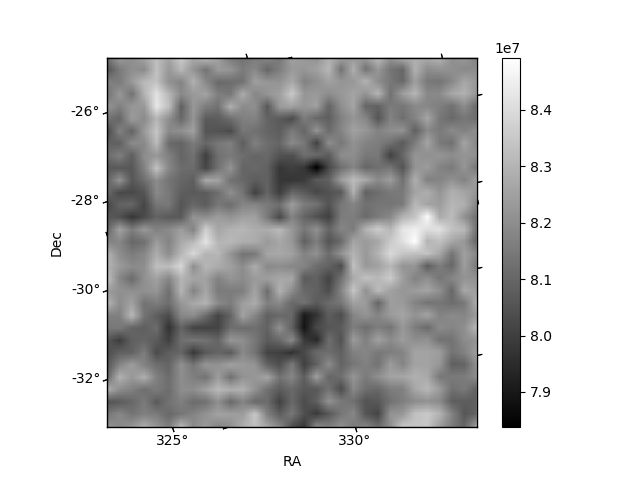
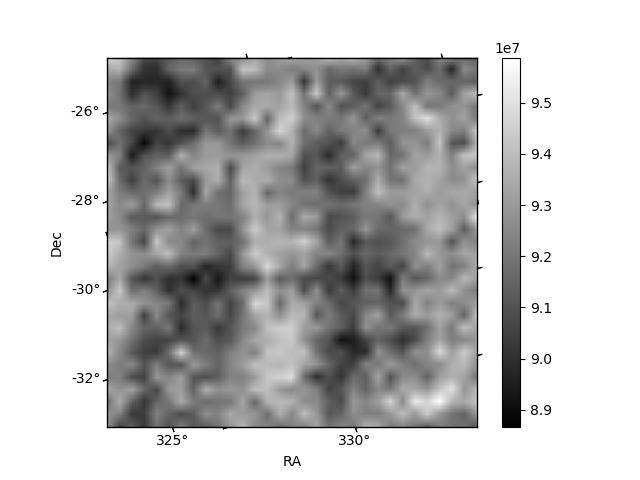
Histogram calculated using DETX and DETY for each event in the final _common_clean file
| Quadrant A | 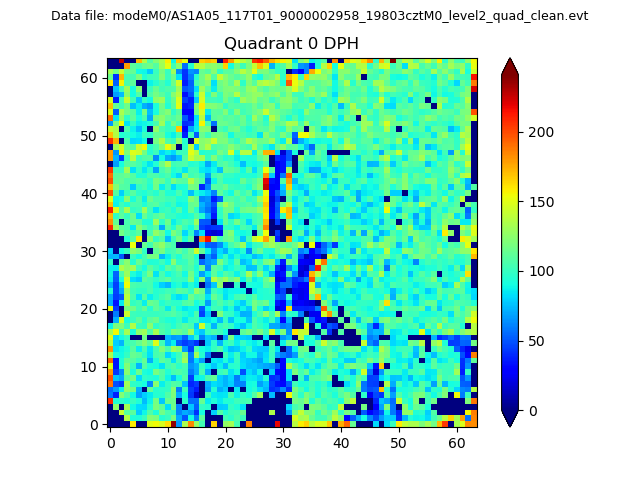 |
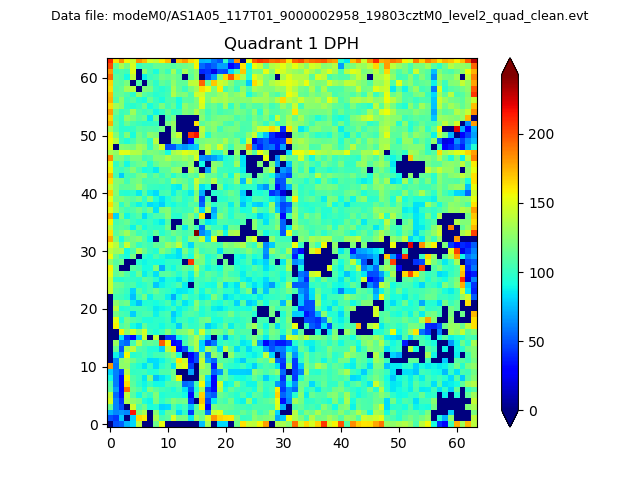 |
Quadrant B |
|---|---|---|---|
| Quadrant D | 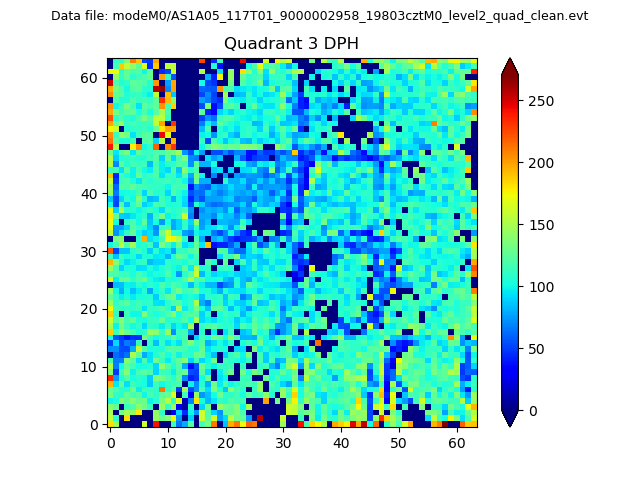 |
 |
Quadrant C |
| Plot type | Count rate plots | Images |
|---|---|---|
| Comparison with Poisson distribution Blue bars denote a histogram of data divided into 1 sec bins. Red curve is a Poisson curve with rate = median count rate of data. |
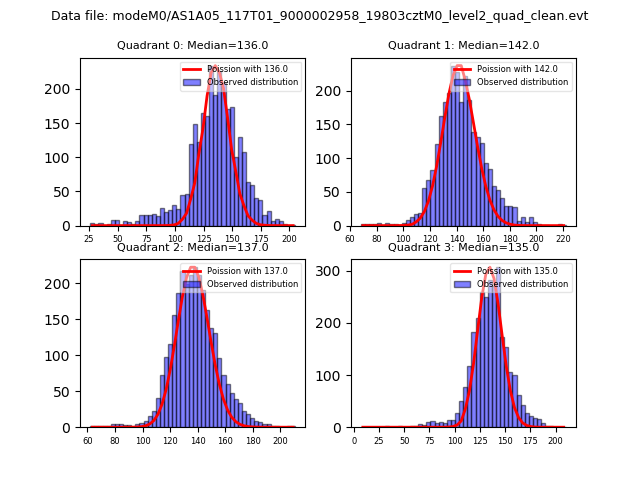 |
 |
| Quadrant-wise count rates Data is divided into 100 sec bins |
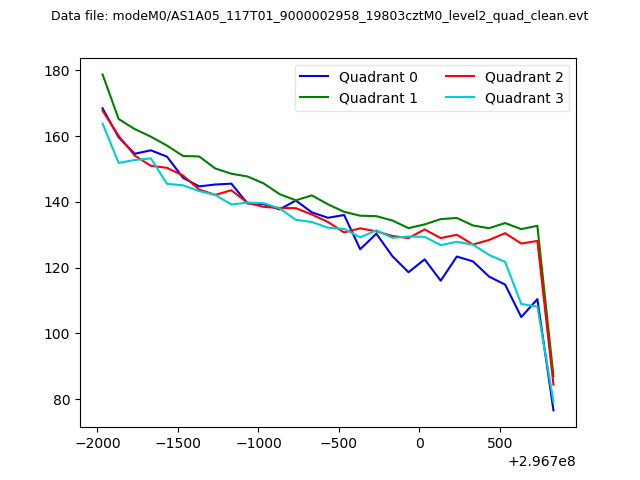 |
|
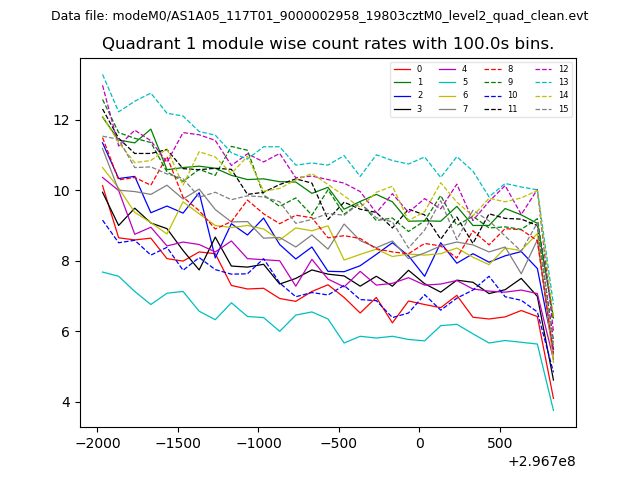
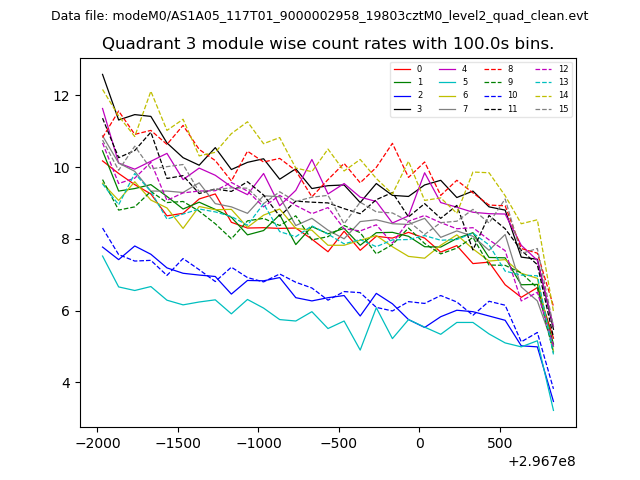
| Module-wise count rates for Quadrant A Data is divided into 100 sec bins |
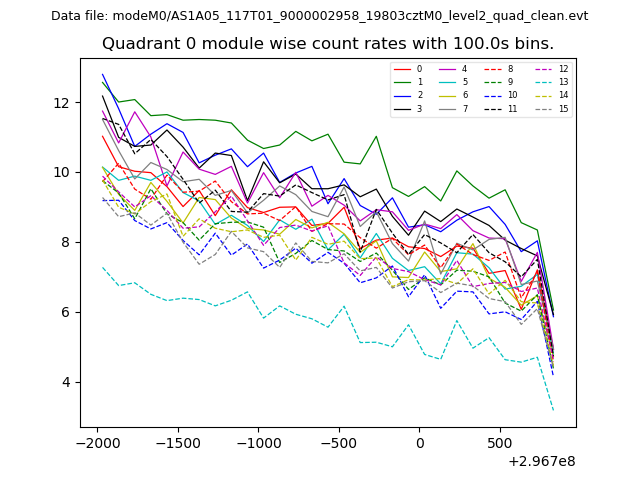 |
 |
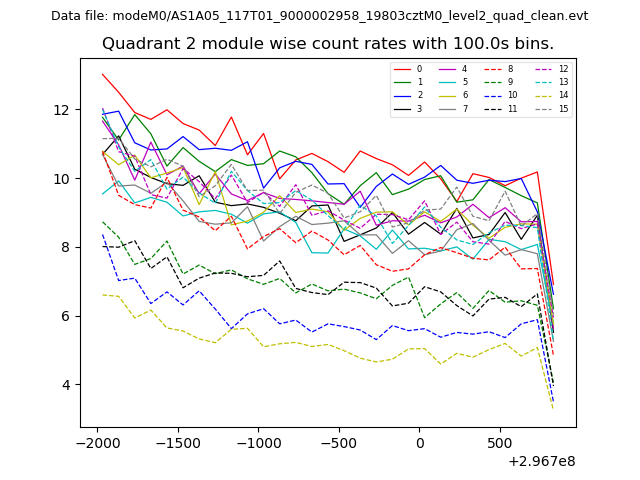
| Module-wise count rates for Quadrant B Data is divided into 100 sec bins |
 |
 |
| Module-wise count rates for Quadrant C Data is divided into 100 sec bins |
 |
 |
| Module-wise count rates for Quadrant D Data is divided into 100 sec bins |
 |
 |
| Parameter | Plot |
|---|---|
| CZT HV Monitor |  |
| D_VDD | 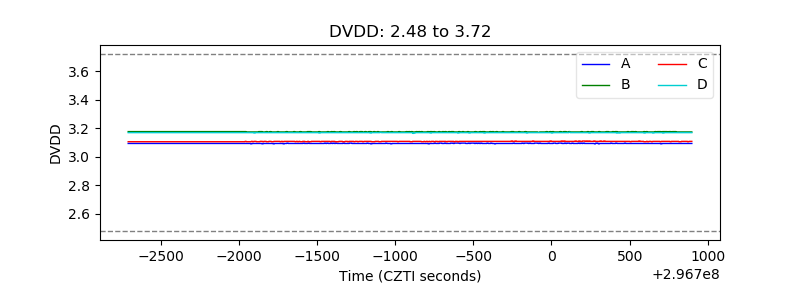 |
| Temperature 1 | 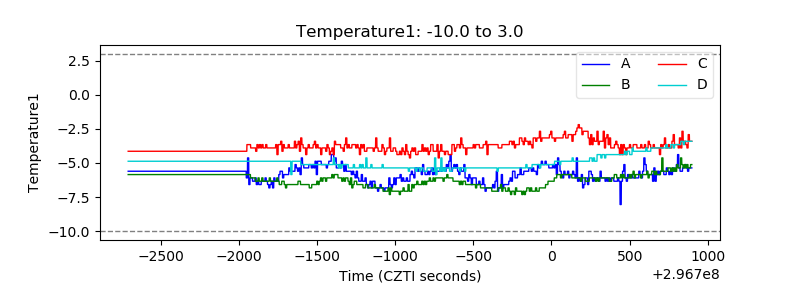 |
| Veto HV Monitor | 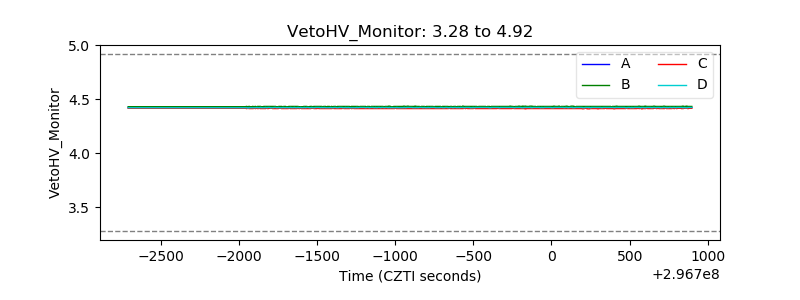 |
| Veto LLD | 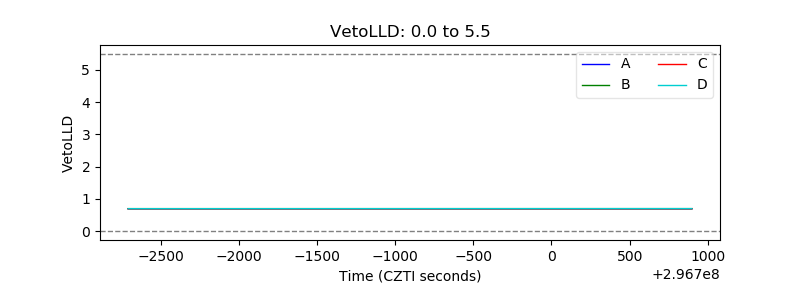 |
| Alpha Counter | 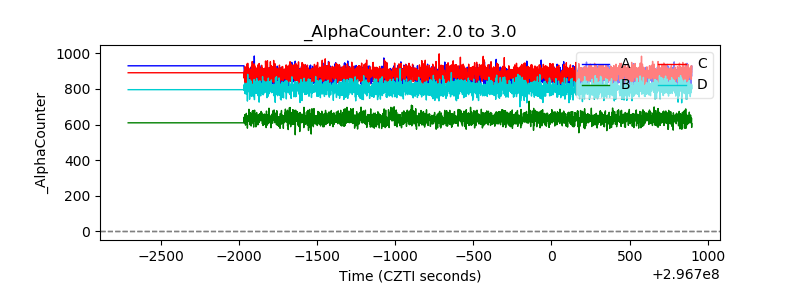 |
| _CPM_Rate | 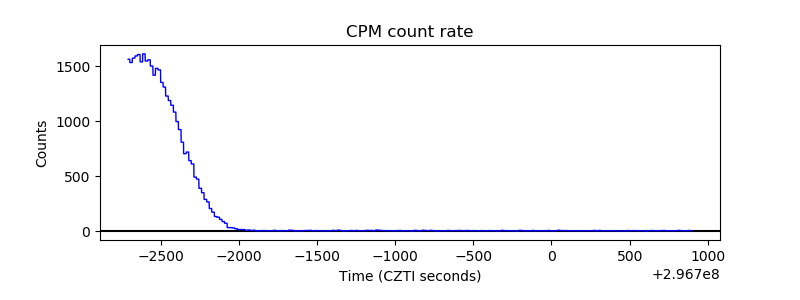 |
| CZT Counter | 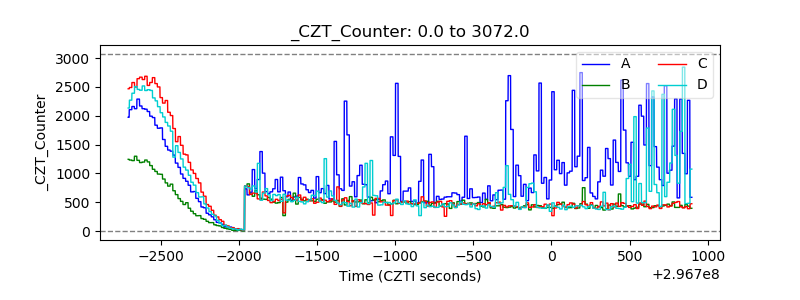 |
| +2.5 Volts monitor |  |
| +5 Volts monitor |  |
| _ROLL_ROT | 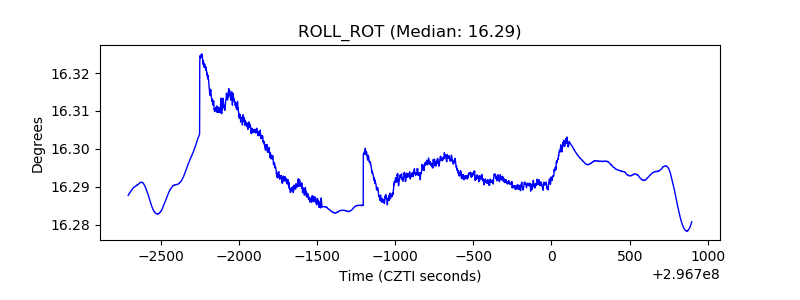 |
| _Roll_DEC | 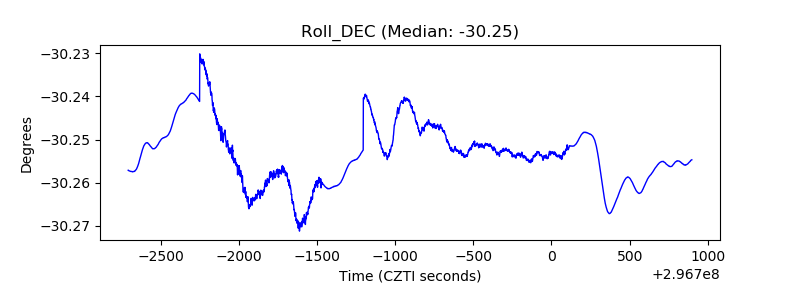 |
| _Roll_RA | 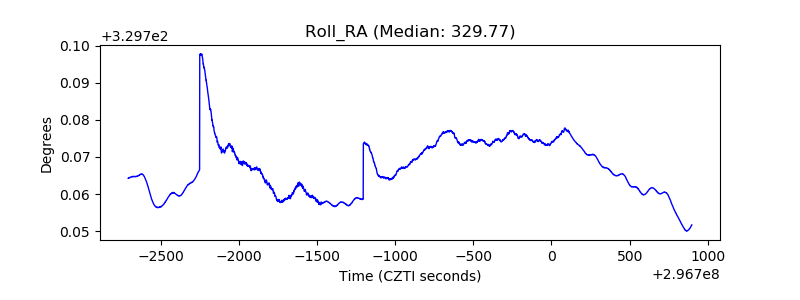 |
| Veto Counter | 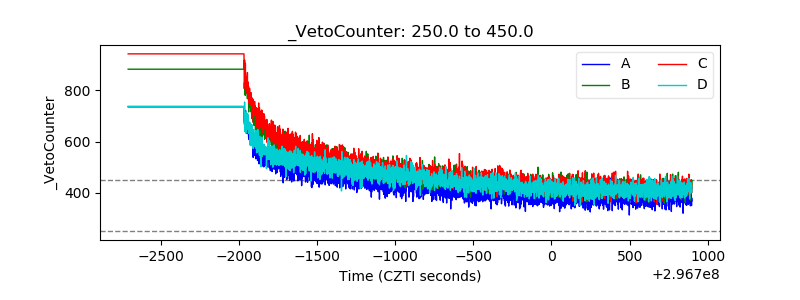 |