| Param | Original file | Final file |
|---|---|---|
| Filename | modeM0/AS1A05_155T04_9000002956cztM0_level2.fits | modeM0/AS1A05_155T04_9000002956cztM0_level2_quad_clean.evt |
| Size (bytes) | 155,856,960 | 137,600,640 |
| Size | 148.6 MB | 131.2 MB |
| Events in quadrant A | 940,400 | 804,695 |
| Events in quadrant B | 912,984 | 810,157 |
| Events in quadrant C | 902,492 | 715,844 |
| Events in quadrant D | 799,090 | 671,562 |
| Mode SS | |||
|---|---|---|---|
| Quadrant | BADHDUFLAG | Total packets | Discarded packets |
| A | 0 | 344 | 0 |
| B | 0 | 344 | 0 |
| C | 0 | 344 | 0 |
| D | 0 | 344 | 0 |
| Mode M0 | |||
|---|---|---|---|
| Quadrant | BADHDUFLAG | Total packets | Discarded packets |
| A | 0 | 35604 | 0 |
| B | 0 | 34967 | 0 |
| C | 0 | 46423 | 0 |
| D | 0 | 41092 | 0 |
| Mode M9 | |||
|---|---|---|---|
| Quadrant | BADHDUFLAG | Total packets | Discarded packets |
| A | 0 | 9 | 0 |
| B | 0 | 9 | 0 |
| C | 0 | 9 | 0 |
| D | 0 | 9 | 0 |
| Quadrant | Total seconds | Saturated seconds | Saturation percentage |
|---|---|---|---|
| A | 16887 | 478 | 2.830580% |
| B | 16887 | 496 | 2.937171% |
| C | 16887 | 1453 | 8.604252% |
| D | 16887 | 1039 | 6.152662% |
Noise dominated data is calculated using 1-second bins in cleaned event files. If a bin has >2000 counts, and if more than 50% of those come from <1% of pixels, then it is considered to be noise-dominated and hence unusable.
| Quadrant | # 1 sec bins | Bins with >0 counts | Bins with >2000 counts | High rate bins dominated by noise | Noise dominated (total time) | Noise dominated (detector-on time) | Marked lightcurve |
|---|---|---|---|---|---|---|---|
| A | 17682 | 16886 | 0 | 0 | 0.00% | 0.00% |  |
| B | 17682 | 16884 | 0 | 0 | 0.00% | 0.00% |  |
| C | 17682 | 16882 | 0 | 0 | 0.00% | 0.00% |  |
| D | 17682 | 16837 | 0 | 0 | 0.00% | 0.00% |  |
Top three noisy pixels from each quadrant. If the there are fewer than three noisy pixels in the level2.evt file, extra rows are filled as -1
| Pixel properties | Quadrant properties | ||||||
|---|---|---|---|---|---|---|---|
| Quadrant | DetID | PixID | Counts | Sigma | Mean | Median | Sigma |
| A | 0 | 29 | 885 | 10.45 | 244 | 228 | 62.8 |
| A | 7 | 110 | 760 | 8.47 | 244 | 228 | 62.8 |
| A | 9 | 19 | 733 | 8.04 | 244 | 228 | 62.8 |
| B | 2 | 9 | 755 | 10.28 | 240 | 227 | 51.3 |
| B | 3 | 17 | 620 | 7.65 | 240 | 227 | 51.3 |
| B | 2 | 8 | 614 | 7.54 | 240 | 227 | 51.3 |
| C | 1 | 80 | 732 | 7.99 | 238 | 221 | 64.0 |
| C | 1 | 81 | 700 | 7.49 | 238 | 221 | 64.0 |
| C | 9 | 233 | 649 | 6.69 | 238 | 221 | 64.0 |
| D | 4 | 246 | 611 | 6.62 | 227 | 206 | 61.2 |
| D | 10 | 189 | 575 | 6.03 | 227 | 206 | 61.2 |
| D | 1 | 3 | 573 | 6.0 | 227 | 206 | 61.2 |
Histogram calculated using DETX and DETY for each event in the final _common_clean file
| Quadrant A | 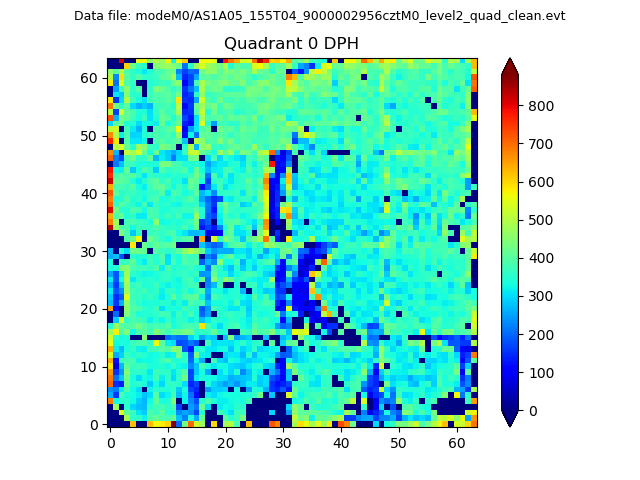 |
 |
Quadrant B |
|---|---|---|---|
| Quadrant D |  |
 |
Quadrant C |
| Plot type | Count rate plots | Images |
|---|---|---|
| Comparison with Poisson distribution Blue bars denote a histogram of data divided into 1 sec bins. Red curve is a Poisson curve with rate = median count rate of data. |
 |
 |
| Quadrant-wise count rates Data is divided into 100 sec bins |
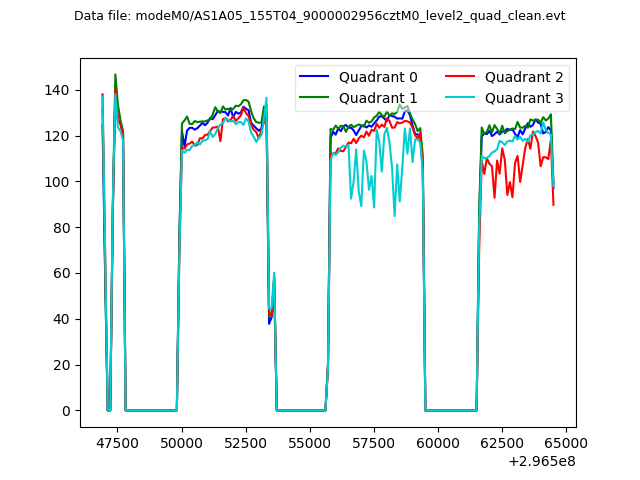 |
|
| Module-wise count rates for Quadrant A Data is divided into 100 sec bins |
 |
 |
| Module-wise count rates for Quadrant B Data is divided into 100 sec bins |
 |
 |
| Module-wise count rates for Quadrant C Data is divided into 100 sec bins |
 |
 |
| Module-wise count rates for Quadrant D Data is divided into 100 sec bins |
 |
 |
| Parameter | Plot |
|---|---|
| CZT HV Monitor | 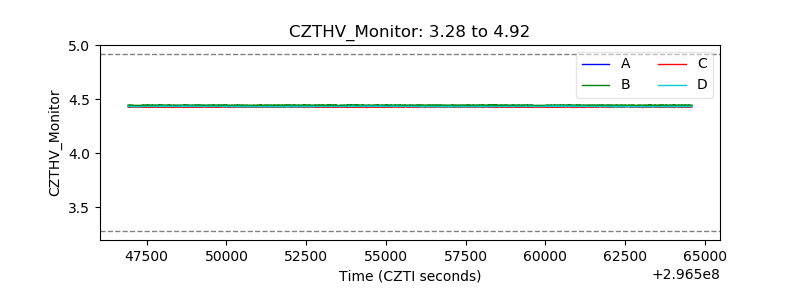 |
| D_VDD | 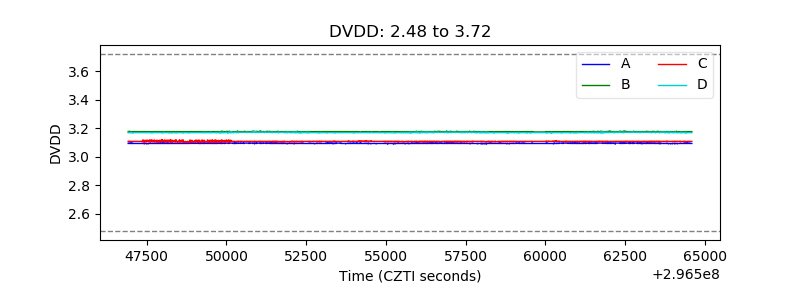 |
| Temperature 1 |  |
| Veto HV Monitor | 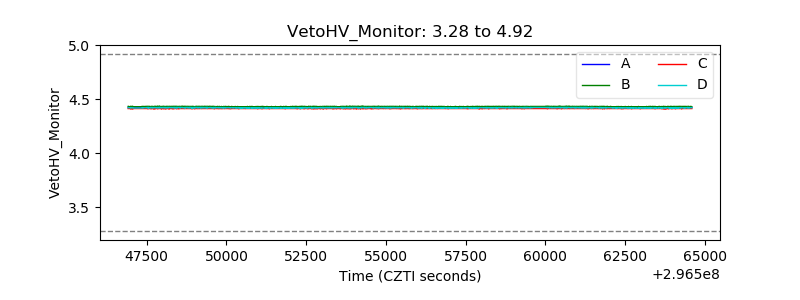 |
| Veto LLD |  |
| Alpha Counter |  |
| _CPM_Rate | 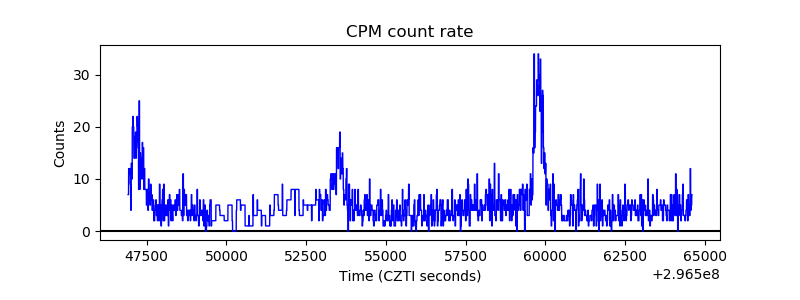 |
| CZT Counter | 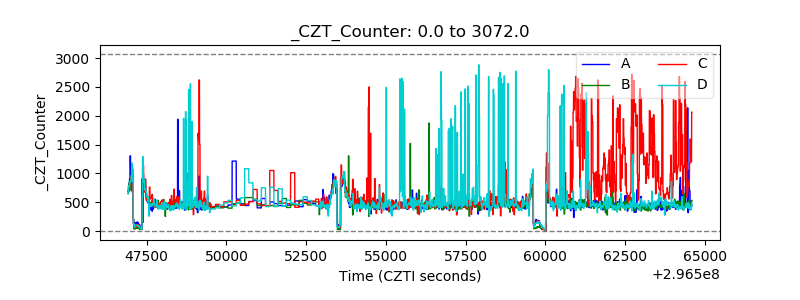 |
| +2.5 Volts monitor |  |
| +5 Volts monitor |  |
| _ROLL_ROT |  |
| _Roll_DEC |  |
| _Roll_RA | 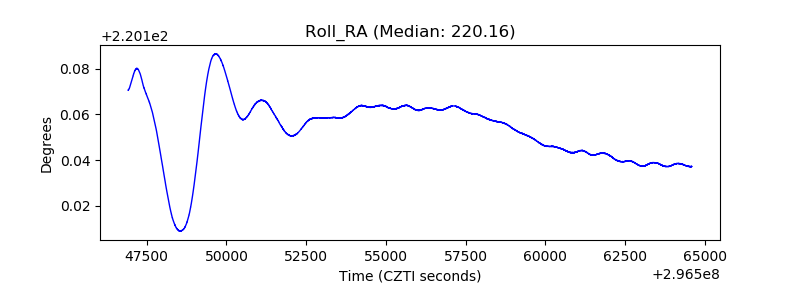 |
| Veto Counter |  |