| Param | Original file | Final file |
|---|---|---|
| Filename | modeM0/AS1A05_155T04_9000002956_19776cztM0_level2.evt | modeM0/AS1A05_155T04_9000002956_19776cztM0_level2_quad_clean.evt |
| Size (bytes) | 129,738,240 | 14,849,280 |
| Size | 123.7 MB | 14.2 MB |
| Events in quadrant A | 928,133 | 78,807 |
| Events in quadrant B | 897,044 | 81,440 |
| Events in quadrant C | 962,592 | 80,519 |
| Events in quadrant D | 1,020,311 | 80,700 |
| Mode SS | |||
|---|---|---|---|
| Quadrant | BADHDUFLAG | Total packets | Discarded packets |
| A | 0 | 36 | 0 |
| B | 0 | 36 | 0 |
| C | 0 | 36 | 0 |
| D | 0 | 36 | 0 |
| Mode M0 | |||
|---|---|---|---|
| Quadrant | BADHDUFLAG | Total packets | Discarded packets |
| A | 0 | 3901 | 1 |
| B | 0 | 3801 | 1 |
| C | 0 | 3964 | 1 |
| D | 0 | 4287 | 2 |
| Mode M9 | |||
|---|---|---|---|
| Quadrant | BADHDUFLAG | Total packets | Discarded packets |
| A | 0 | 3 | 0 |
| B | 0 | 3 | 0 |
| C | 0 | 3 | 0 |
| D | 0 | 3 | 0 |
| Quadrant | Total seconds | Saturated seconds | Saturation percentage |
|---|---|---|---|
| A | 1741 | 166 | 9.534750% |
| B | 1741 | 177 | 10.166571% |
| C | 1741 | 148 | 8.500862% |
| D | 1740 | 172 | 9.885057% |
Noise dominated data is calculated using 1-second bins in cleaned event files. If a bin has >2000 counts, and if more than 50% of those come from <1% of pixels, then it is considered to be noise-dominated and hence unusable.
| Quadrant | # 1 sec bins | Bins with >0 counts | Bins with >2000 counts | High rate bins dominated by noise | Noise dominated (total time) | Noise dominated (detector-on time) | Marked lightcurve |
|---|---|---|---|---|---|---|---|
| A | 2021 | 1742 | 4 | 4 | 0.20% | 0.23% | 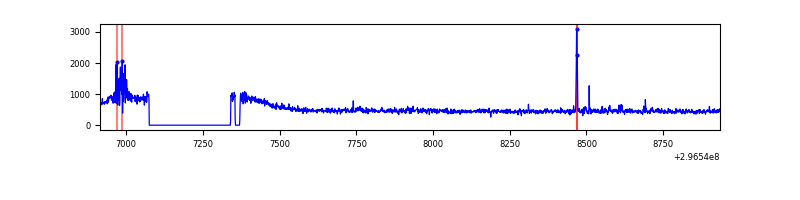 |
| B | 2021 | 1742 | 0 | 0 | 0.00% | 0.00% | 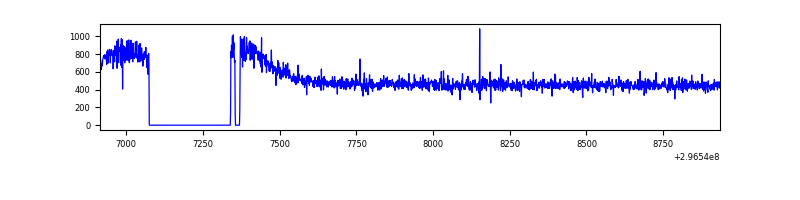 |
| C | 2021 | 1742 | 0 | 0 | 0.00% | 0.00% | 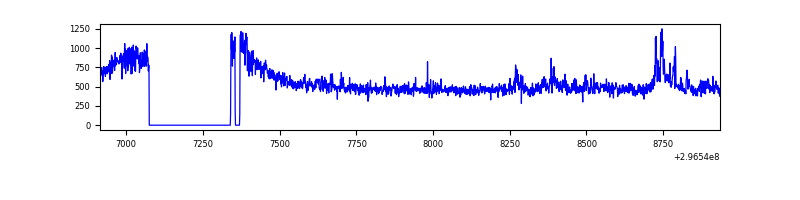 |
| D | 2020 | 1741 | 45 | 45 | 2.23% | 2.58% | 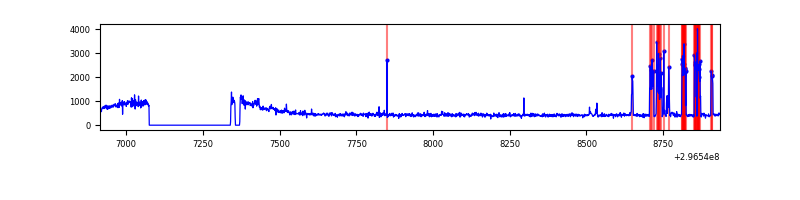 |
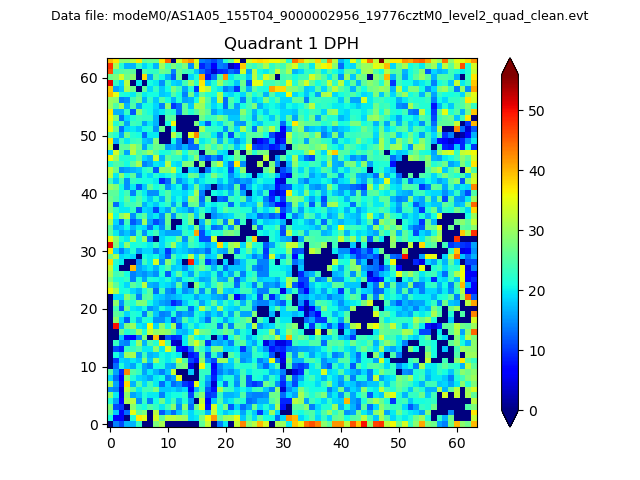
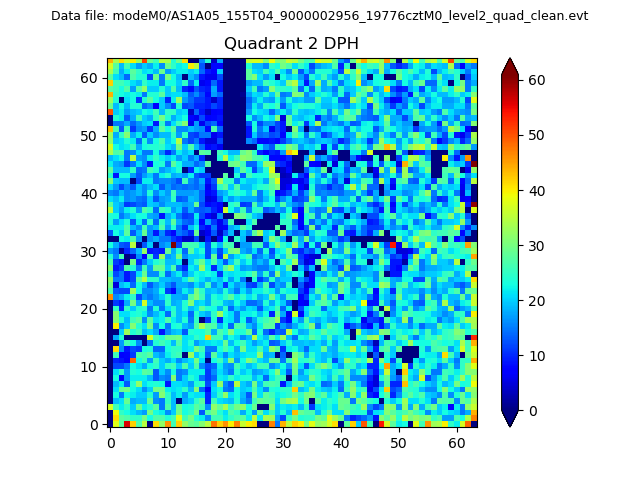
Top three noisy pixels from each quadrant. If the there are fewer than three noisy pixels in the level2.evt file, extra rows are filled as -1
| Pixel properties | Quadrant properties | ||||||
|---|---|---|---|---|---|---|---|
| Quadrant | DetID | PixID | Counts | Sigma | Mean | Median | Sigma |
| A | 6 | 16 | 22400 | 460.31 | 227 | 221 | 48.2 |
| A | 4 | 2 | 16642 | 340.81 | 227 | 221 | 48.2 |
| A | 0 | 23 | 8016 | 161.78 | 227 | 221 | 48.2 |
| B | 12 | 111 | 5794 | 115.57 | 228 | 221 | 48.2 |
| B | 11 | 111 | 5174 | 102.72 | 228 | 221 | 48.2 |
| B | 14 | 111 | 4860 | 96.2 | 228 | 221 | 48.2 |
| C | 3 | 233 | 69283 | 1280.62 | 218 | 218 | 53.9 |
| C | 14 | 238 | 32658 | 601.5 | 218 | 218 | 53.9 |
| C | 8 | 128 | 4240 | 74.57 | 218 | 218 | 53.9 |
| D | 1 | 52 | 184145 | 3312.9 | 220 | 212 | 55.5 |
| D | 2 | 234 | 6070 | 105.51 | 220 | 212 | 55.5 |
| D | 12 | 218 | 4656 | 80.04 | 220 | 212 | 55.5 |
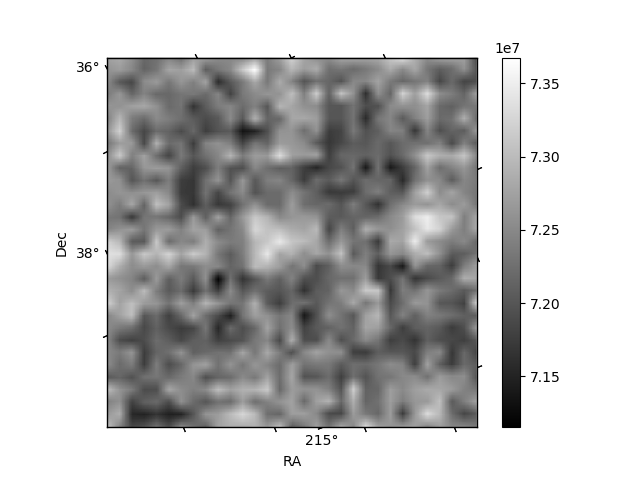
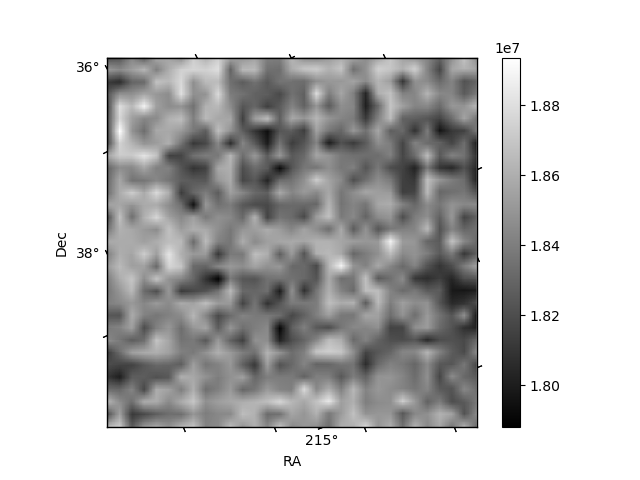
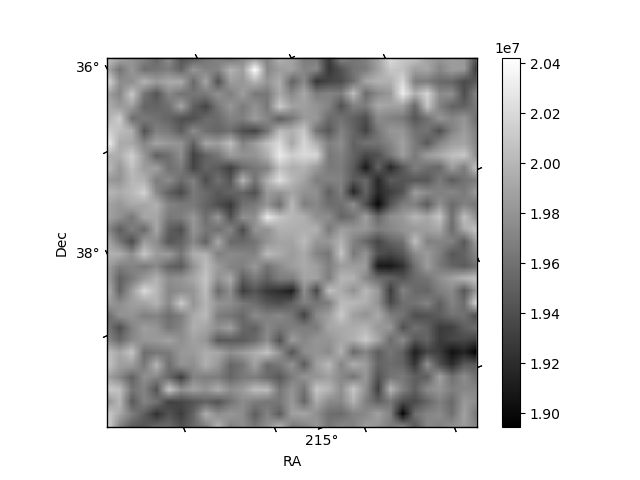
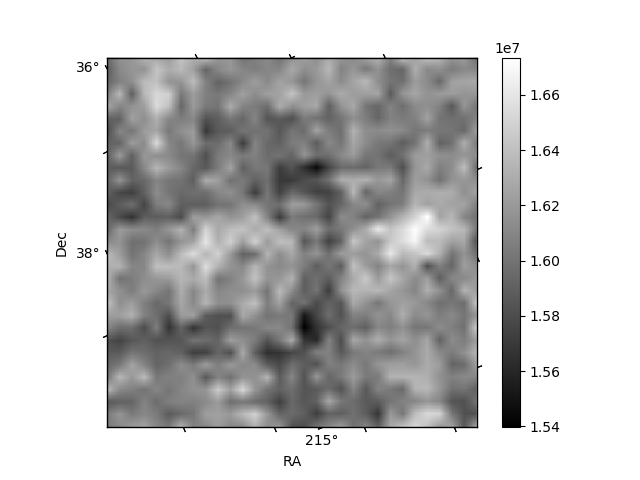
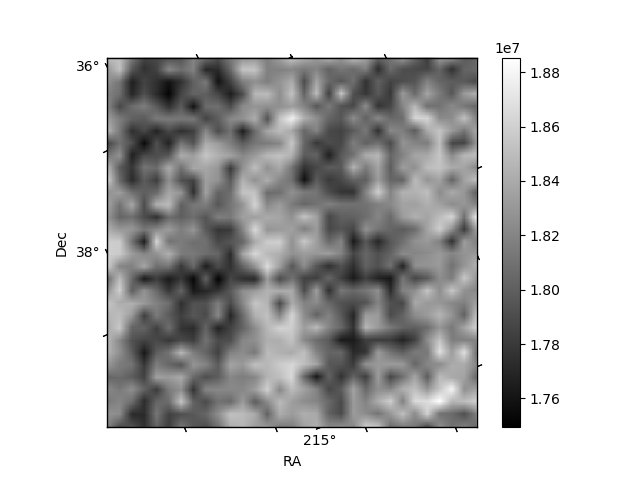
Histogram calculated using DETX and DETY for each event in the final _common_clean file
| Quadrant A | 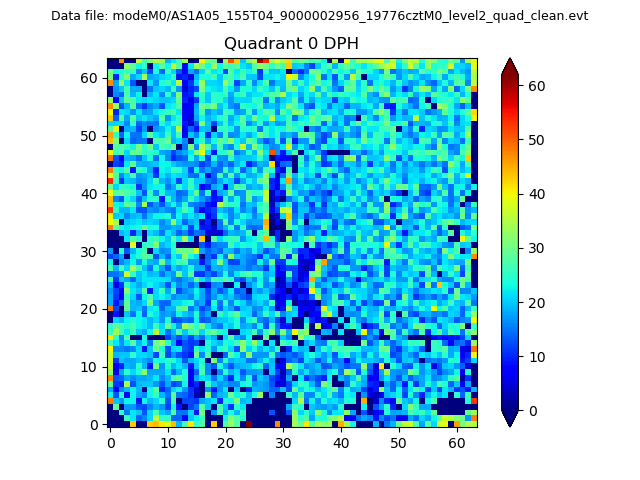 |
 |
Quadrant B |
|---|---|---|---|
| Quadrant D | 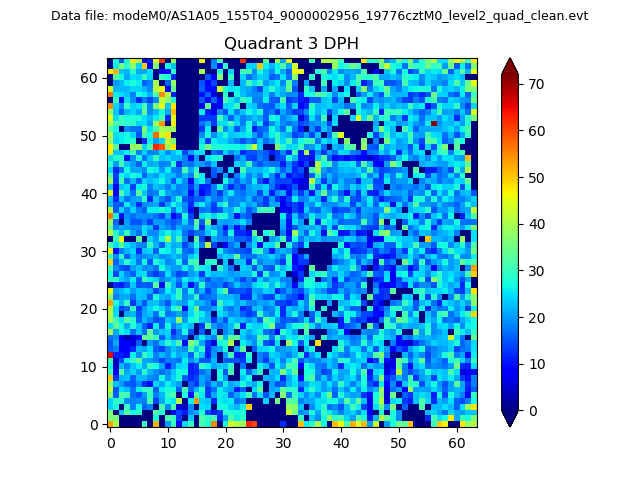 |
 |
Quadrant C |
| Plot type | Count rate plots | Images |
|---|---|---|
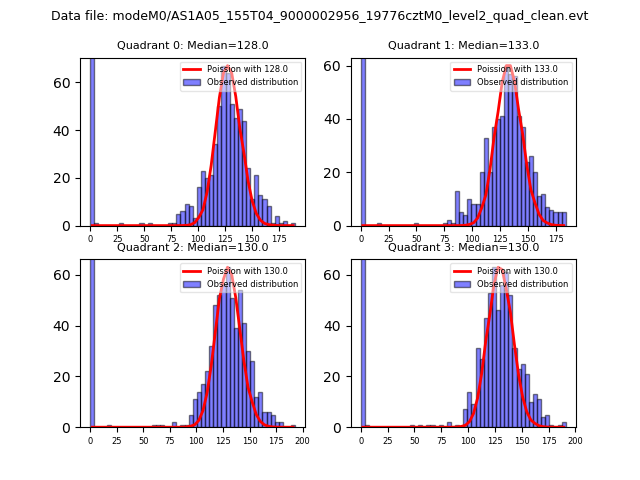
| Comparison with Poisson distribution Blue bars denote a histogram of data divided into 1 sec bins. Red curve is a Poisson curve with rate = median count rate of data. |
 |
 |
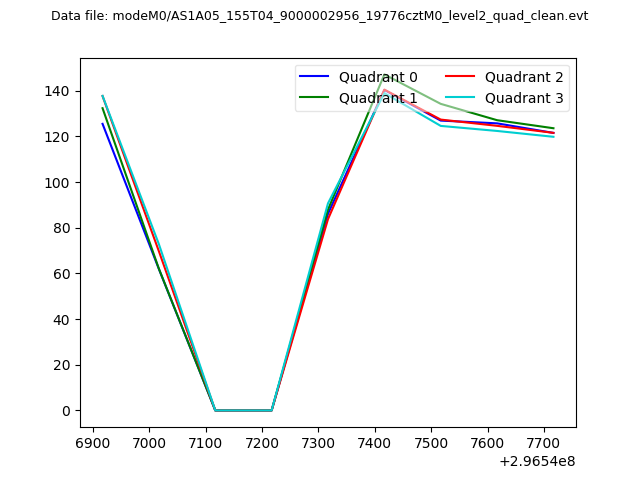
| Quadrant-wise count rates Data is divided into 100 sec bins |
 |
|
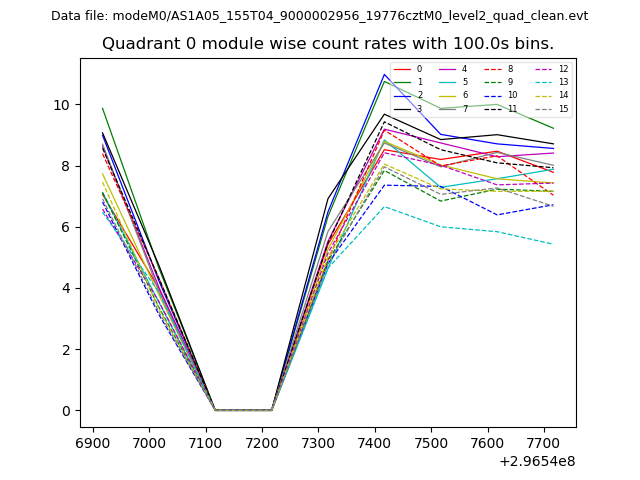
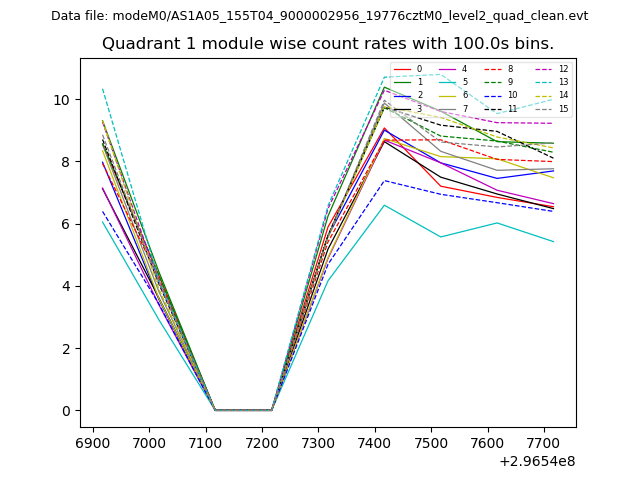
| Module-wise count rates for Quadrant A Data is divided into 100 sec bins |
 |
 |
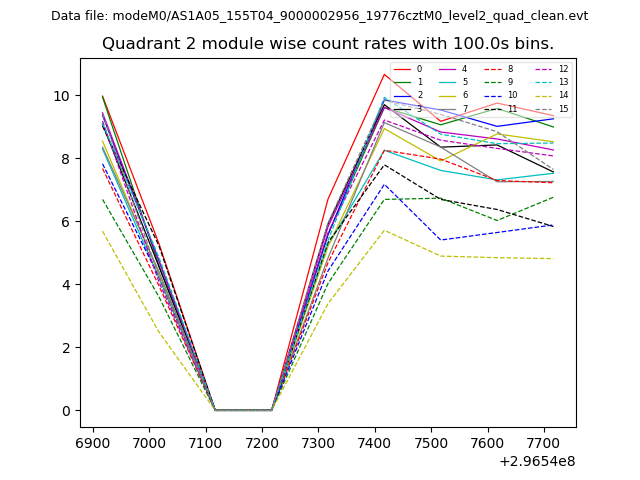
| Module-wise count rates for Quadrant B Data is divided into 100 sec bins |
 |
 |
| Module-wise count rates for Quadrant C Data is divided into 100 sec bins |
 |
 |
| Module-wise count rates for Quadrant D Data is divided into 100 sec bins |
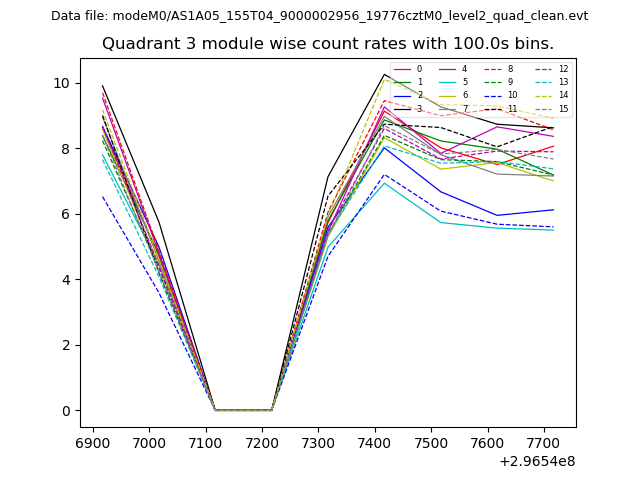 |
 |
| Parameter | Plot |
|---|---|
| CZT HV Monitor | 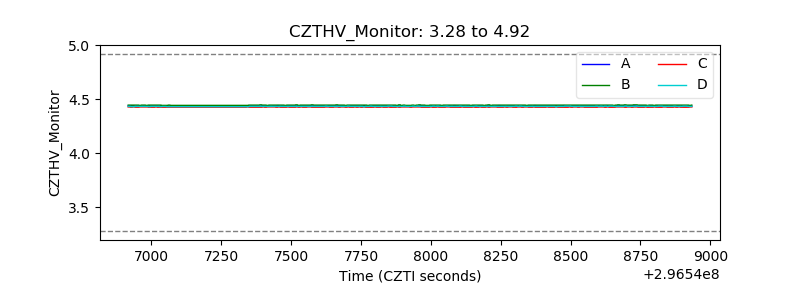 |
| D_VDD | 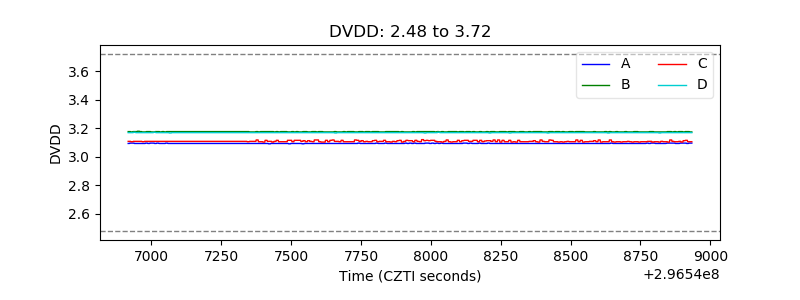 |
| Temperature 1 | 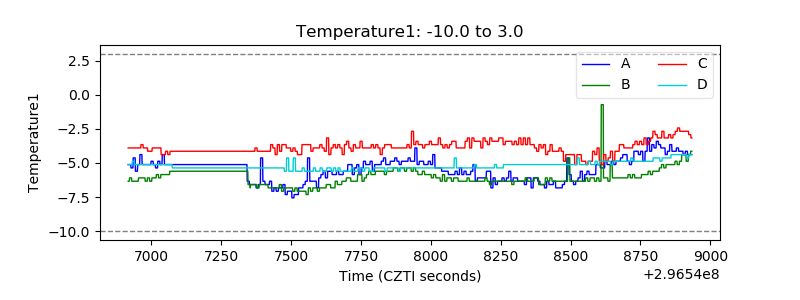 |
| Veto HV Monitor | 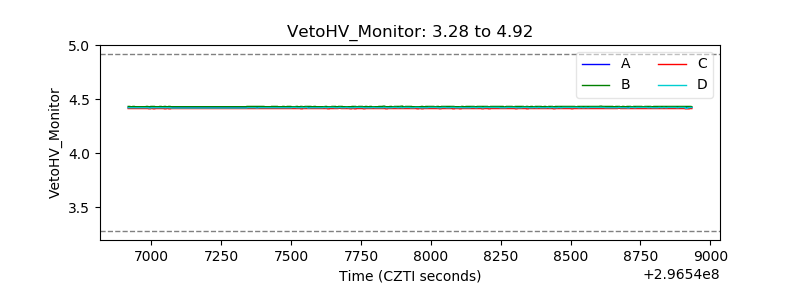 |
| Veto LLD | 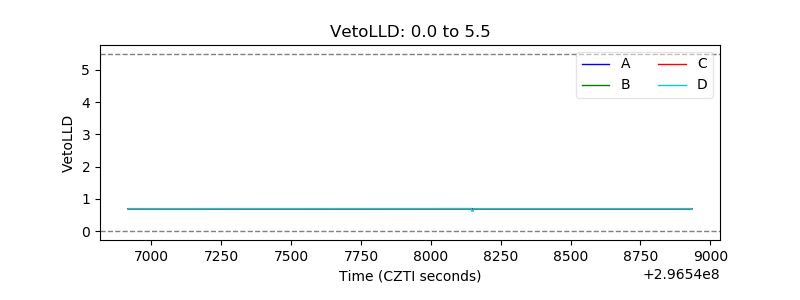 |
| Alpha Counter | 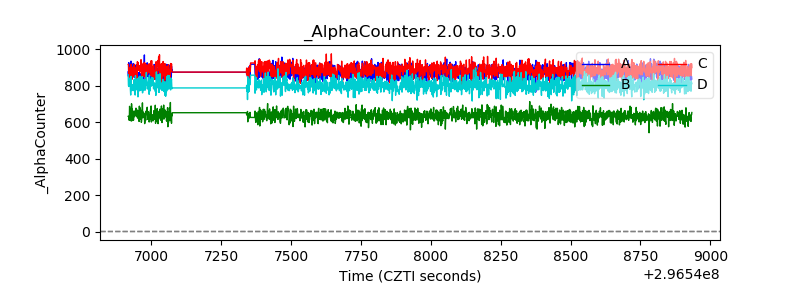 |
| _CPM_Rate | 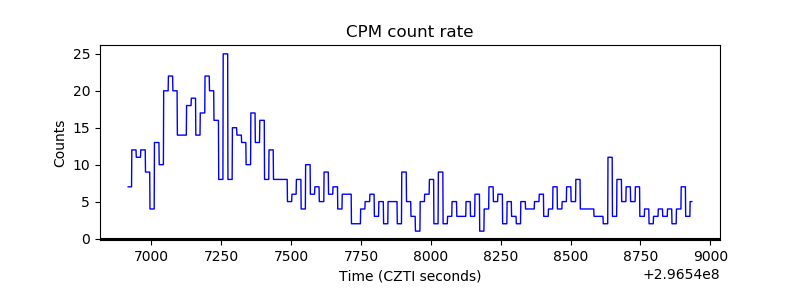 |
| CZT Counter | 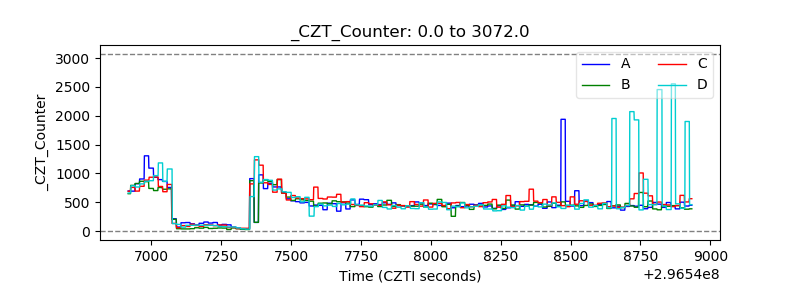 |
| +2.5 Volts monitor |  |
| +5 Volts monitor |  |
| _ROLL_ROT | 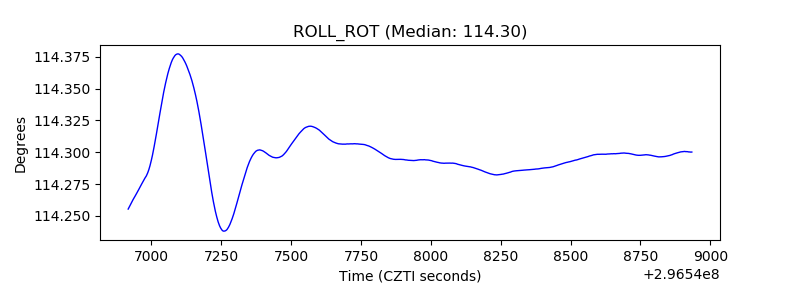 |
| _Roll_DEC | 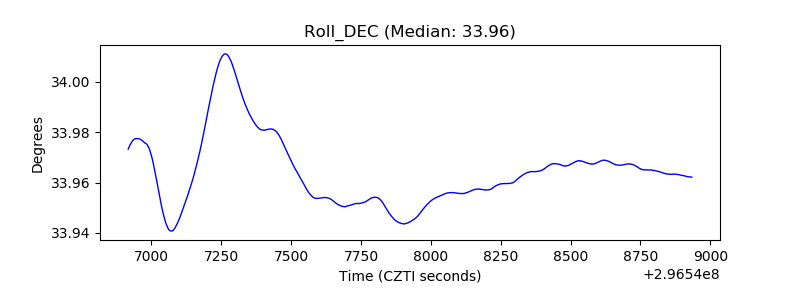 |
| _Roll_RA | 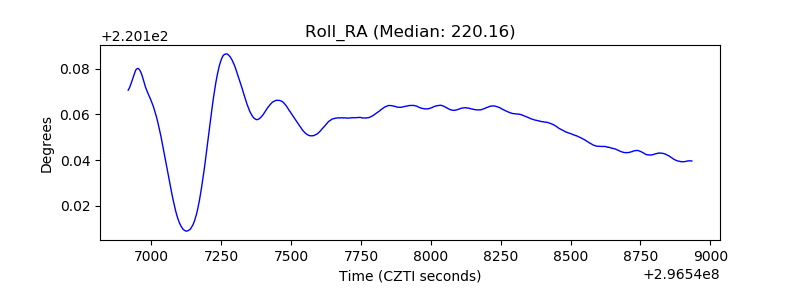 |
| Veto Counter | 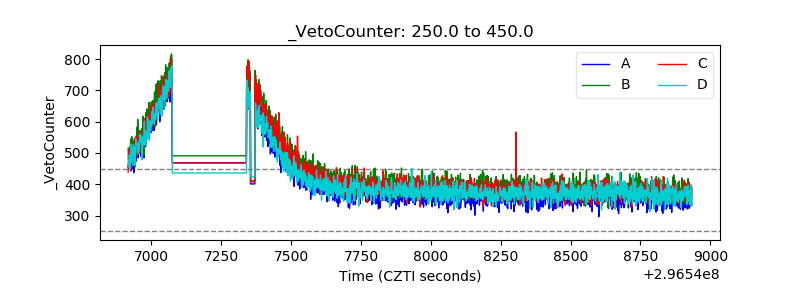 |