| Param | Original file | Final file |
|---|---|---|
| Filename | modeM0/AS1A05_155T04_9000002956_19777cztM0_level2.evt | modeM0/AS1A05_155T04_9000002956_19777cztM0_level2_quad_clean.evt |
| Size (bytes) | 559,618,560 | 87,595,200 |
| Size | 533.7 MB | 83.5 MB |
| Events in quadrant A | 3,974,236 | 530,538 |
| Events in quadrant B | 3,852,820 | 543,249 |
| Events in quadrant C | 4,384,086 | 519,409 |
| Events in quadrant D | 4,205,922 | 515,149 |
| Mode SS | |||
|---|---|---|---|
| Quadrant | BADHDUFLAG | Total packets | Discarded packets |
| A | 0 | 160 | 0 |
| B | 0 | 160 | 0 |
| C | 0 | 160 | 0 |
| D | 0 | 160 | 0 |
| Mode M0 | |||
|---|---|---|---|
| Quadrant | BADHDUFLAG | Total packets | Discarded packets |
| A | 0 | 16891 | 2 |
| B | 0 | 16476 | 2 |
| C | 0 | 17907 | 2 |
| D | 0 | 17800 | 2 |
| Mode M9 | |||
|---|---|---|---|
| Quadrant | BADHDUFLAG | Total packets | Discarded packets |
| A | 0 | 5 | 0 |
| B | 0 | 5 | 0 |
| C | 0 | 5 | 0 |
| D | 0 | 5 | 0 |
| Quadrant | Total seconds | Saturated seconds | Saturation percentage |
|---|---|---|---|
| A | 7825 | 399 | 5.099042% |
| B | 7825 | 412 | 5.265176% |
| C | 7825 | 440 | 5.623003% |
| D | 7824 | 372 | 4.754601% |
Noise dominated data is calculated using 1-second bins in cleaned event files. If a bin has >2000 counts, and if more than 50% of those come from <1% of pixels, then it is considered to be noise-dominated and hence unusable.
| Quadrant | # 1 sec bins | Bins with >0 counts | Bins with >2000 counts | High rate bins dominated by noise | Noise dominated (total time) | Noise dominated (detector-on time) | Marked lightcurve |
|---|---|---|---|---|---|---|---|
| A | 8230 | 7827 | 17 | 17 | 0.21% | 0.22% | 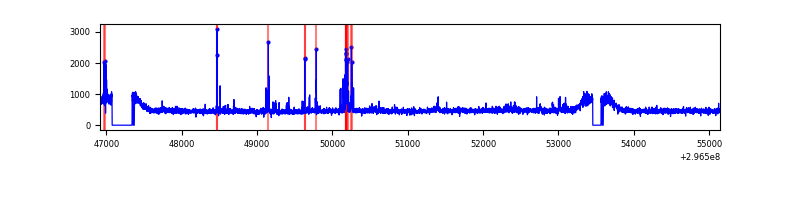 |
| B | 8230 | 7826 | 1 | 1 | 0.01% | 0.01% | 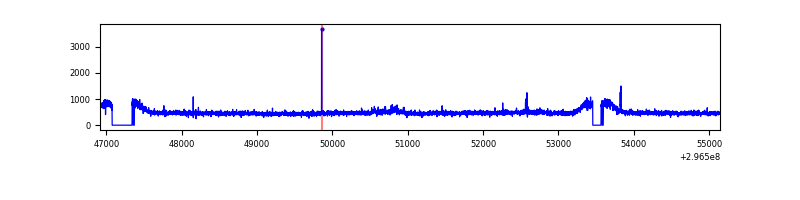 |
| C | 8230 | 7827 | 52 | 52 | 0.63% | 0.66% | 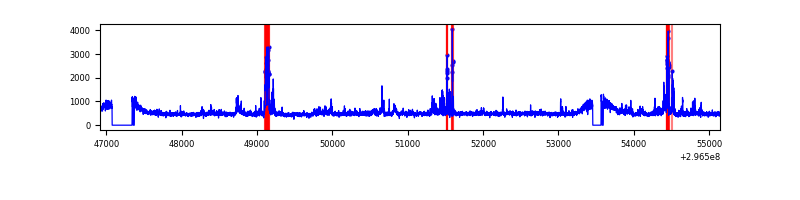 |
| D | 8229 | 7825 | 73 | 73 | 0.89% | 0.93% | 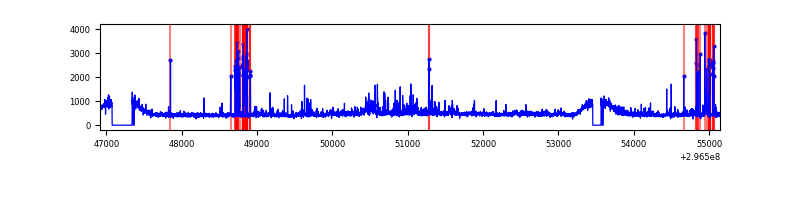 |
Top three noisy pixels from each quadrant. If the there are fewer than three noisy pixels in the level2.evt file, extra rows are filled as -1
| Pixel properties | Quadrant properties | ||||||
|---|---|---|---|---|---|---|---|
| Quadrant | DetID | PixID | Counts | Sigma | Mean | Median | Sigma |
| A | 4 | 2 | 132742 | 671.03 | 970 | 949 | 196.4 |
| A | 0 | 23 | 48989 | 244.6 | 970 | 949 | 196.4 |
| A | 6 | 16 | 23061 | 112.58 | 970 | 949 | 196.4 |
| B | 4 | 216 | 33586 | 170.75 | 969 | 938 | 191.2 |
| B | 12 | 111 | 23788 | 119.51 | 969 | 938 | 191.2 |
| B | 11 | 111 | 21250 | 106.23 | 969 | 938 | 191.2 |
| C | 3 | 233 | 573807 | 2606.18 | 928 | 931 | 219.8 |
| C | 14 | 238 | 140581 | 635.31 | 928 | 931 | 219.8 |
| C | 7 | 247 | 36310 | 160.95 | 928 | 931 | 219.8 |
| D | 1 | 52 | 589992 | 2546.14 | 945 | 913 | 231.4 |
| D | 2 | 234 | 33370 | 140.29 | 945 | 913 | 231.4 |
| D | 7 | 96 | 18304 | 75.17 | 945 | 913 | 231.4 |
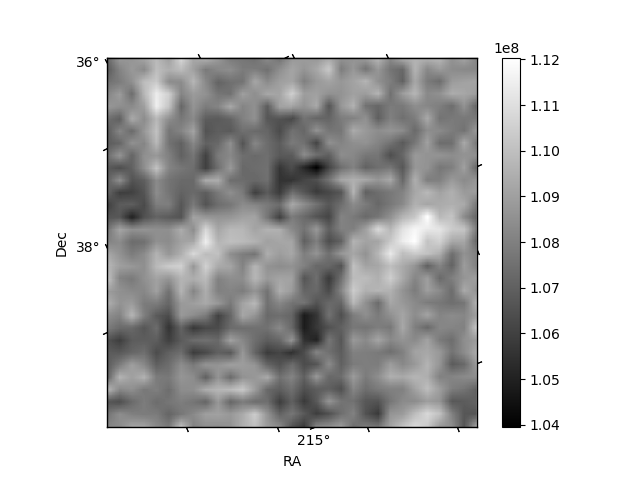
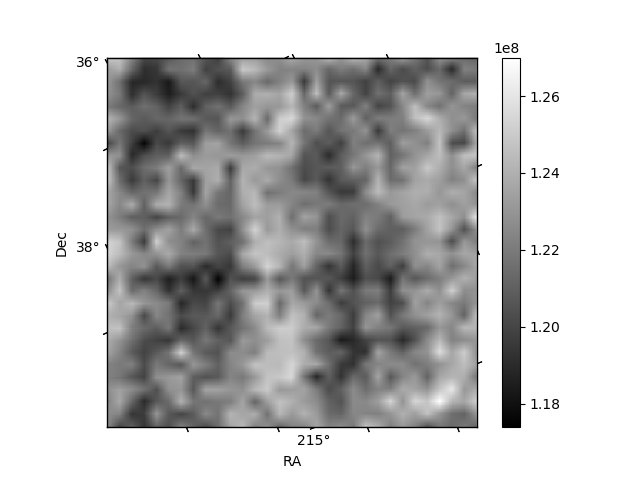
Histogram calculated using DETX and DETY for each event in the final _common_clean file
| Quadrant A | 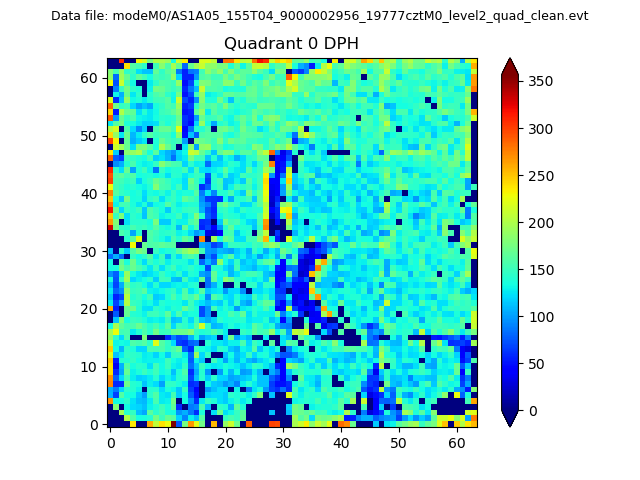 |
 |
Quadrant B |
|---|---|---|---|
| Quadrant D | 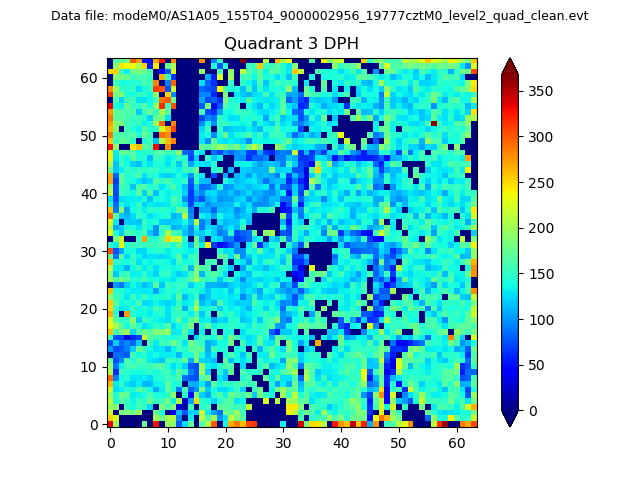 |
 |
Quadrant C |
| Plot type | Count rate plots | Images |
|---|---|---|
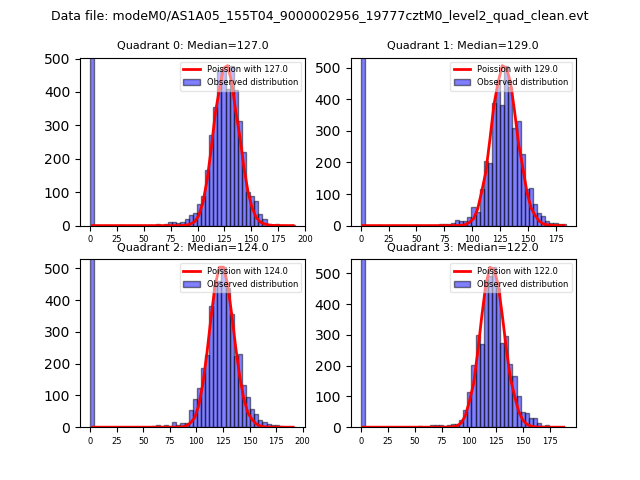
| Comparison with Poisson distribution Blue bars denote a histogram of data divided into 1 sec bins. Red curve is a Poisson curve with rate = median count rate of data. |
 |
 |
| Quadrant-wise count rates Data is divided into 100 sec bins |
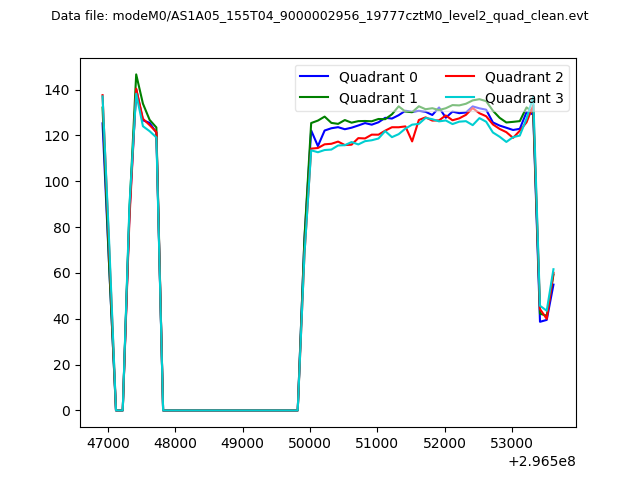 |
|
| Module-wise count rates for Quadrant A Data is divided into 100 sec bins |
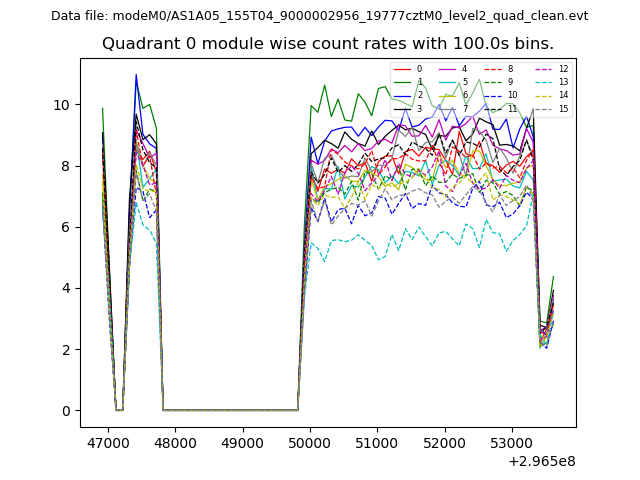 |
 |
| Module-wise count rates for Quadrant B Data is divided into 100 sec bins |
 |
 |
| Module-wise count rates for Quadrant C Data is divided into 100 sec bins |
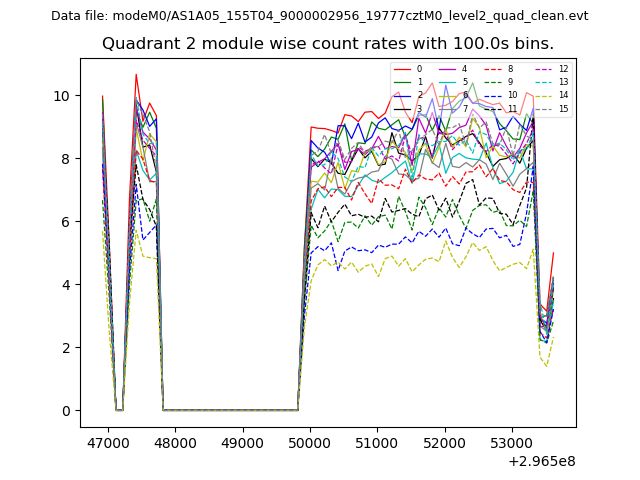 |
 |
| Module-wise count rates for Quadrant D Data is divided into 100 sec bins |
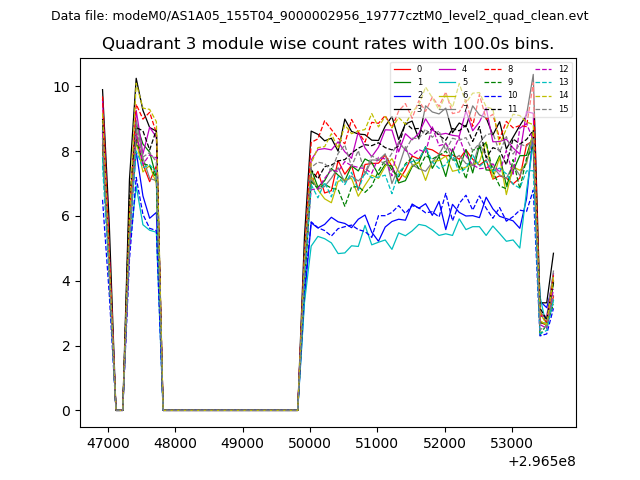 |
 |
| Parameter | Plot |
|---|---|
| CZT HV Monitor |  |
| D_VDD | 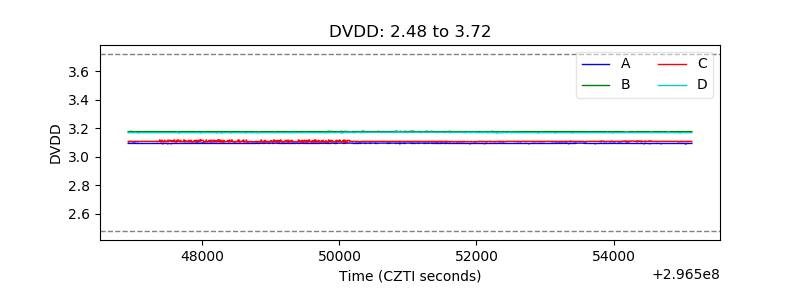 |
| Temperature 1 | 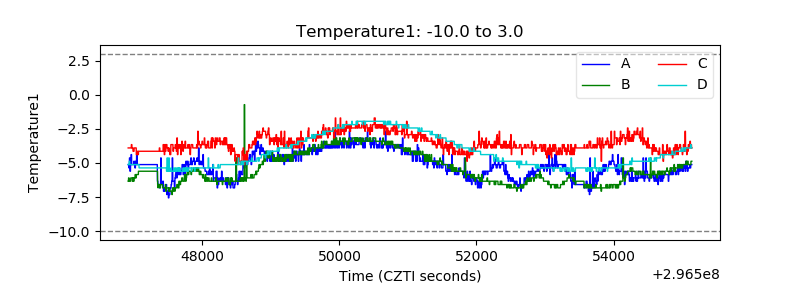 |
| Veto HV Monitor | 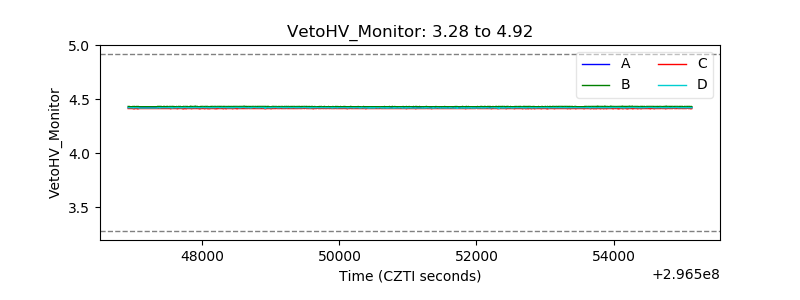 |
| Veto LLD | 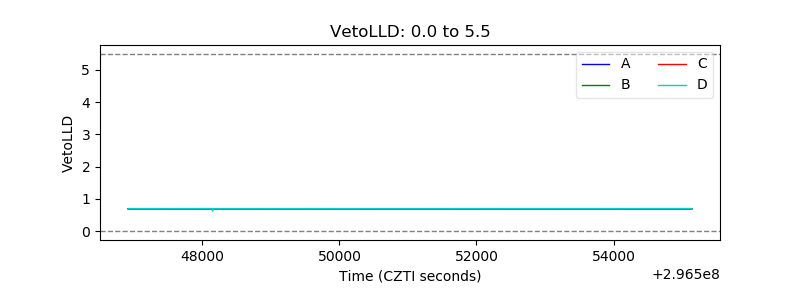 |
| Alpha Counter | 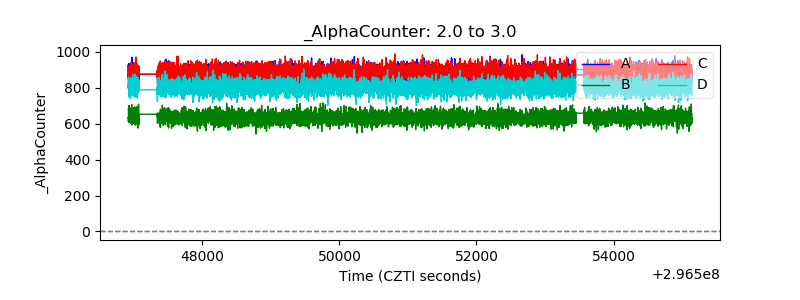 |
| _CPM_Rate | 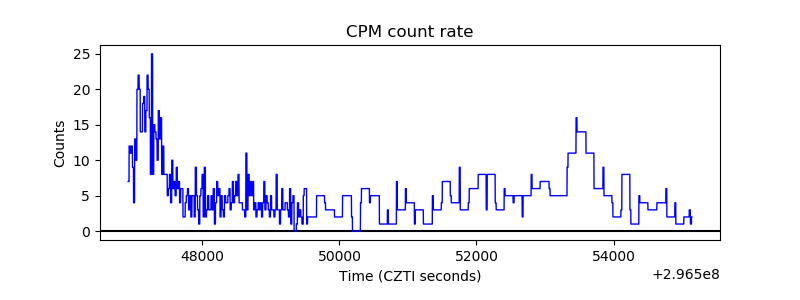 |
| CZT Counter | 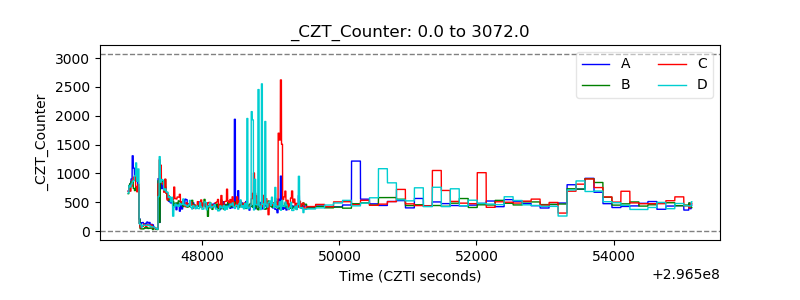 |
| +2.5 Volts monitor |  |
| +5 Volts monitor | 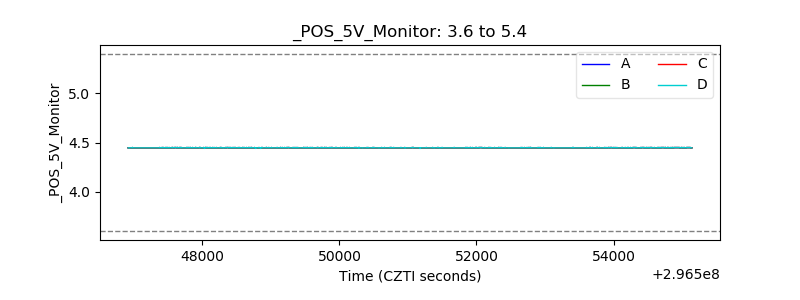 |
| _ROLL_ROT | 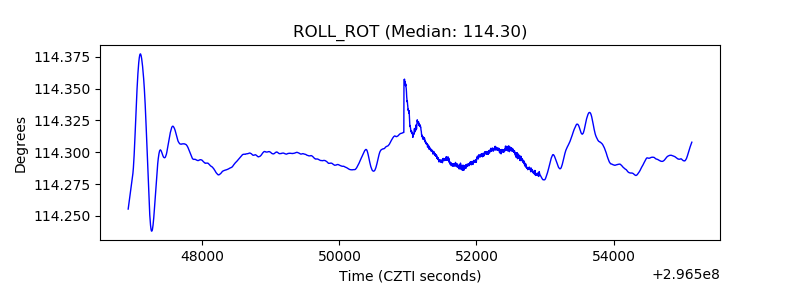 |
| _Roll_DEC | 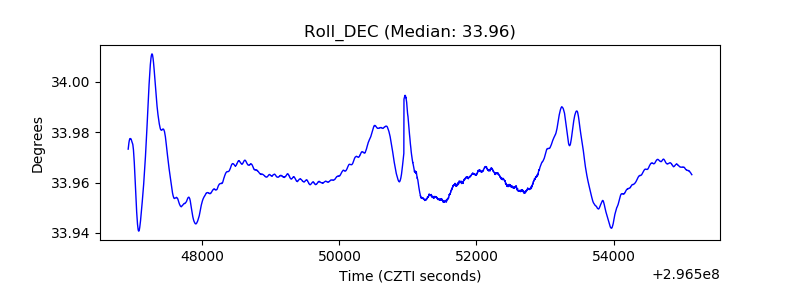 |
| _Roll_RA | 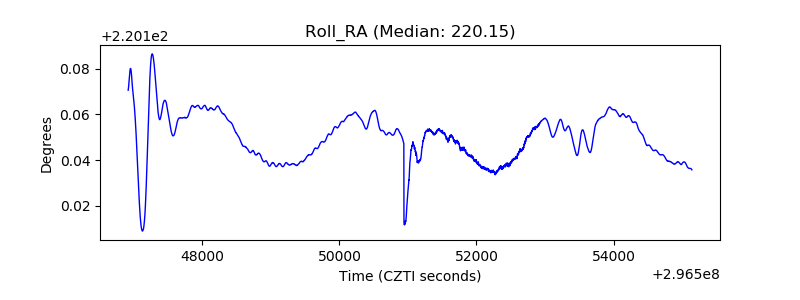 |
| Veto Counter | 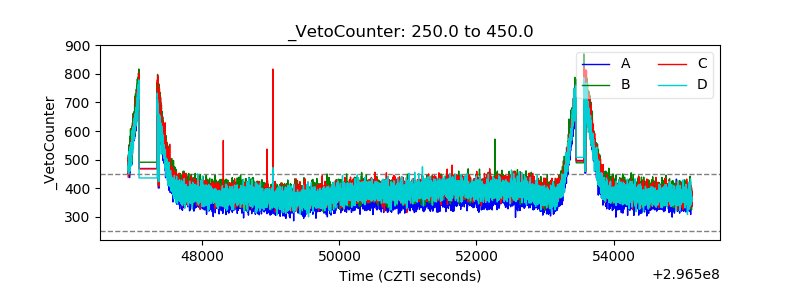 |