| Param | Original file | Final file |
|---|---|---|
| Filename | modeM0/AS1A05_155T04_9000002956_19780cztM0_level2.evt | modeM0/AS1A05_155T04_9000002956_19780cztM0_level2_quad_clean.evt |
| Size (bytes) | 470,301,120 | 69,753,600 |
| Size | 448.5 MB | 66.5 MB |
| Events in quadrant A | 2,601,371 | 446,965 |
| Events in quadrant B | 2,527,311 | 454,742 |
| Events in quadrant C | 5,800,873 | 404,695 |
| Events in quadrant D | 2,946,996 | 427,667 |
| Mode SS | |||
|---|---|---|---|
| Quadrant | BADHDUFLAG | Total packets | Discarded packets |
| A | 0 | 110 | 0 |
| B | 0 | 110 | 0 |
| C | 0 | 110 | 0 |
| D | 0 | 110 | 0 |
| Mode M0 | |||
|---|---|---|---|
| Quadrant | BADHDUFLAG | Total packets | Discarded packets |
| A | 0 | 11324 | 1 |
| B | 0 | 11017 | 1 |
| C | 0 | 20856 | 1 |
| D | 0 | 12454 | 1 |
| Mode M9 | |||
|---|---|---|---|
| Quadrant | BADHDUFLAG | Total packets | Discarded packets |
| A | 0 | 4 | 0 |
| B | 0 | 4 | 0 |
| C | 0 | 4 | 0 |
| D | 0 | 4 | 0 |
| Quadrant | Total seconds | Saturated seconds | Saturation percentage |
|---|---|---|---|
| A | 5394 | 76 | 1.408973% |
| B | 5395 | 75 | 1.390176% |
| C | 5395 | 996 | 18.461538% |
| D | 5395 | 197 | 3.651529% |
Noise dominated data is calculated using 1-second bins in cleaned event files. If a bin has >2000 counts, and if more than 50% of those come from <1% of pixels, then it is considered to be noise-dominated and hence unusable.
| Quadrant | # 1 sec bins | Bins with >0 counts | Bins with >2000 counts | High rate bins dominated by noise | Noise dominated (total time) | Noise dominated (detector-on time) | Marked lightcurve |
|---|---|---|---|---|---|---|---|
| A | 5784 | 5395 | 5 | 5 | 0.09% | 0.09% | 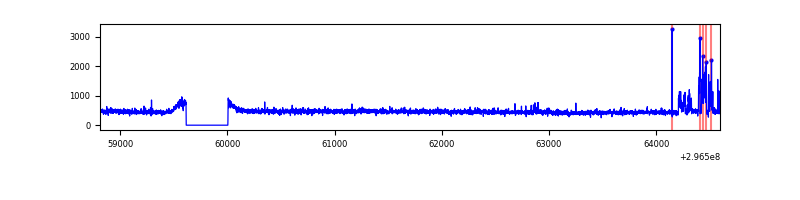 |
| B | 5785 | 5396 | 0 | 0 | 0.00% | 0.00% | 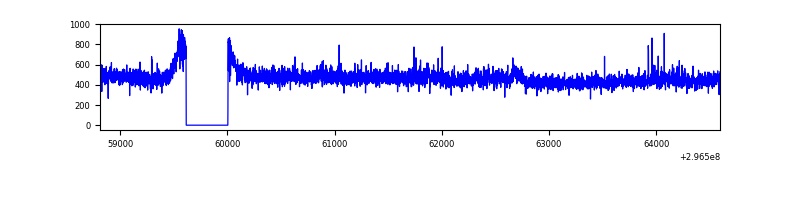 |
| C | 5785 | 5396 | 635 | 635 | 10.98% | 11.77% | 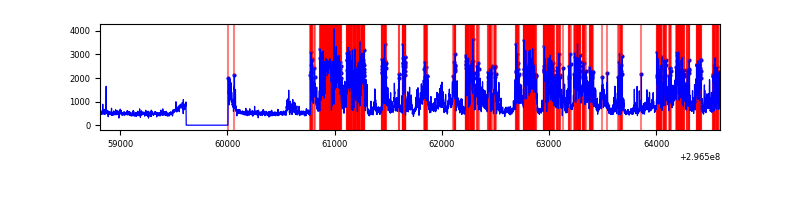 |
| D | 5785 | 5396 | 126 | 126 | 2.18% | 2.34% | 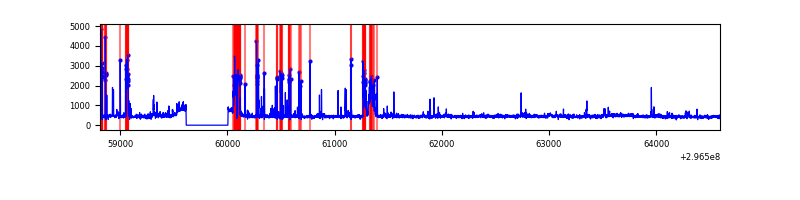 |
Top three noisy pixels from each quadrant. If the there are fewer than three noisy pixels in the level2.evt file, extra rows are filled as -1
| Pixel properties | Quadrant properties | ||||||
|---|---|---|---|---|---|---|---|
| Quadrant | DetID | PixID | Counts | Sigma | Mean | Median | Sigma |
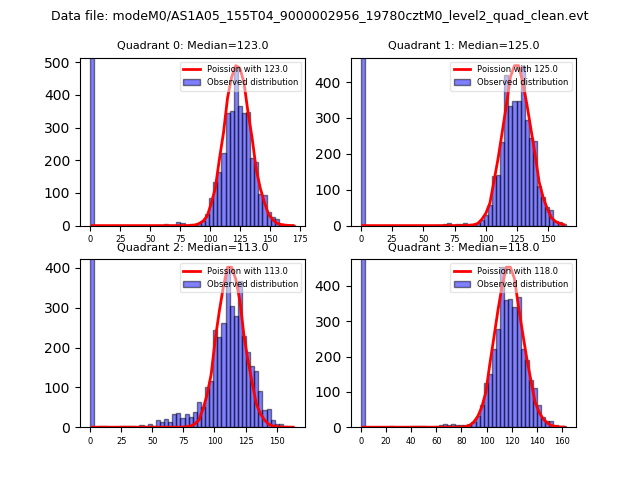
| A | 4 | 2 | 119587 | 915.87 | 637 | 624 | 129.9 |
| A | 9 | 143 | 16035 | 118.65 | 637 | 624 | 129.9 |
| A | 11 | 29 | 8348 | 59.47 | 637 | 624 | 129.9 |
| B | 4 | 216 | 17532 | 136.97 | 634 | 617 | 123.5 |
| B | 0 | 230 | 15432 | 119.97 | 634 | 617 | 123.5 |
| B | 12 | 111 | 15356 | 119.35 | 634 | 617 | 123.5 |
| C | 3 | 233 | 3425951 | 25085.32 | 578 | 582 | 136.5 |
| C | 14 | 238 | 89764 | 653.11 | 578 | 582 | 136.5 |
| C | 7 | 247 | 28340 | 203.28 | 578 | 582 | 136.5 |
| D | 1 | 52 | 430304 | 2873.01 | 611 | 592 | 149.6 |
| D | 7 | 238 | 139466 | 928.5 | 611 | 592 | 149.6 |
| D | 12 | 218 | 48668 | 321.43 | 611 | 592 | 149.6 |
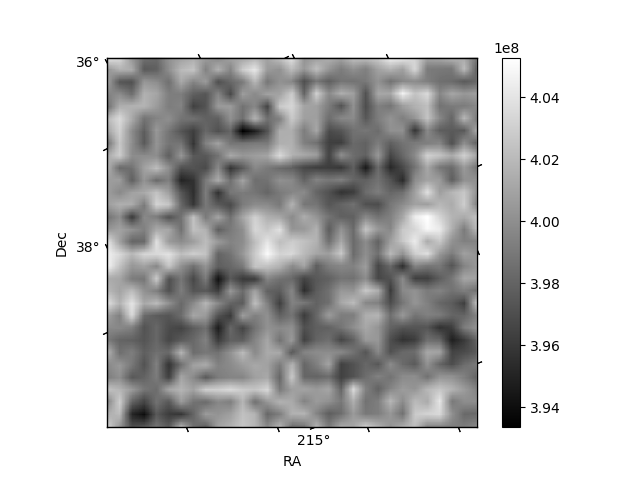
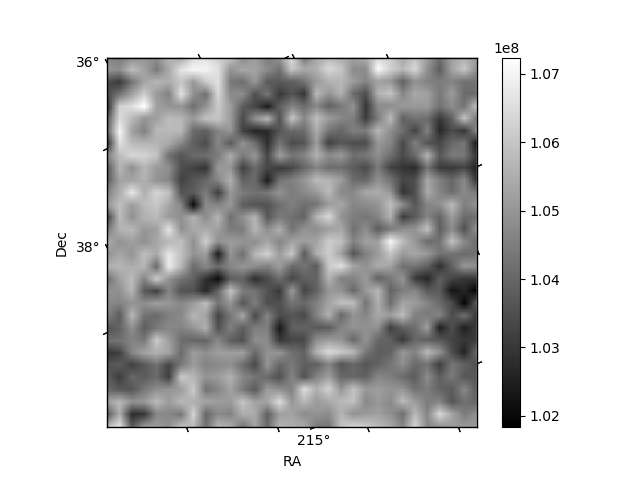
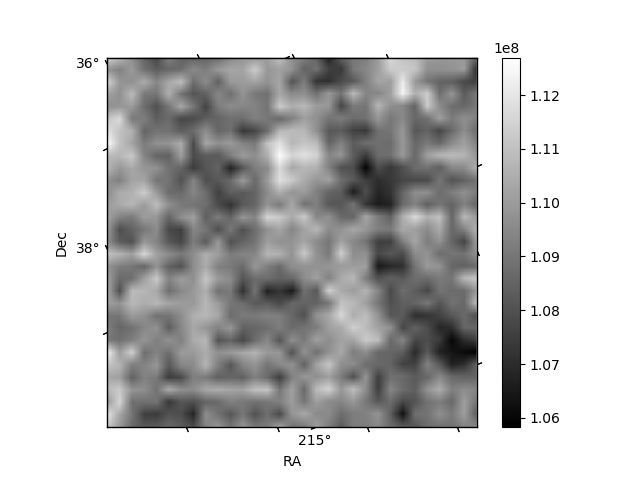
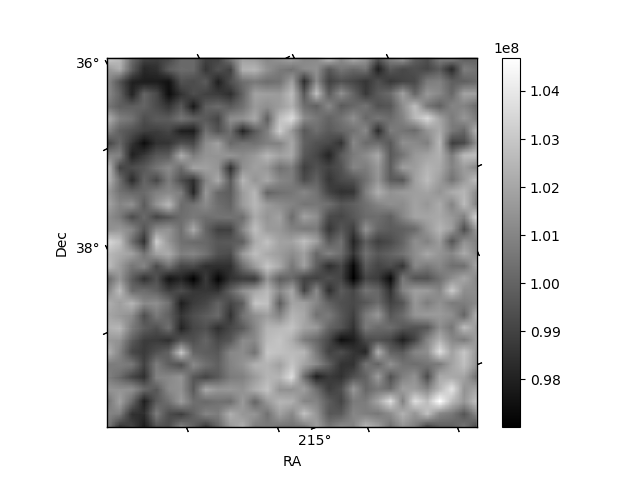
Histogram calculated using DETX and DETY for each event in the final _common_clean file
| Quadrant A | 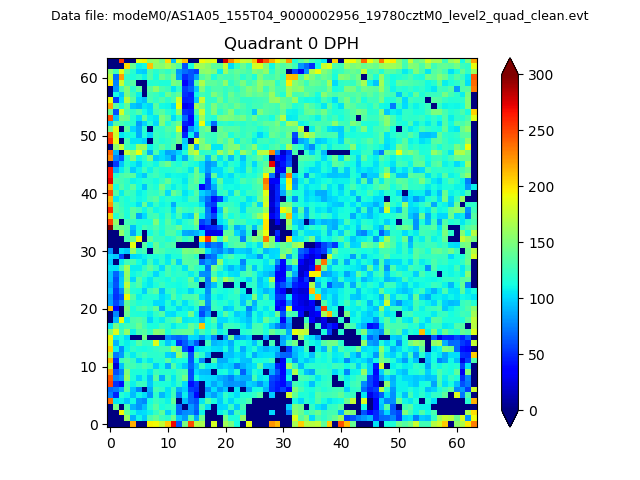 |
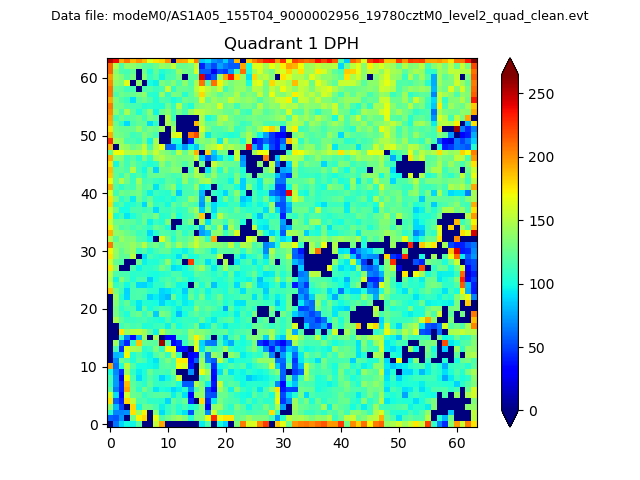 |
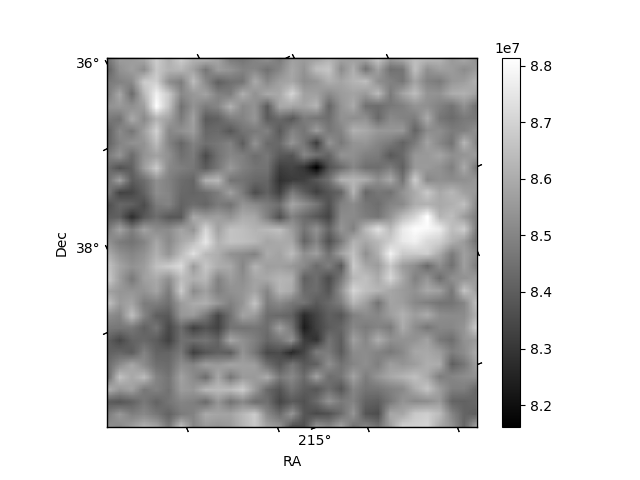
Quadrant B |
|---|---|---|---|
| Quadrant D | 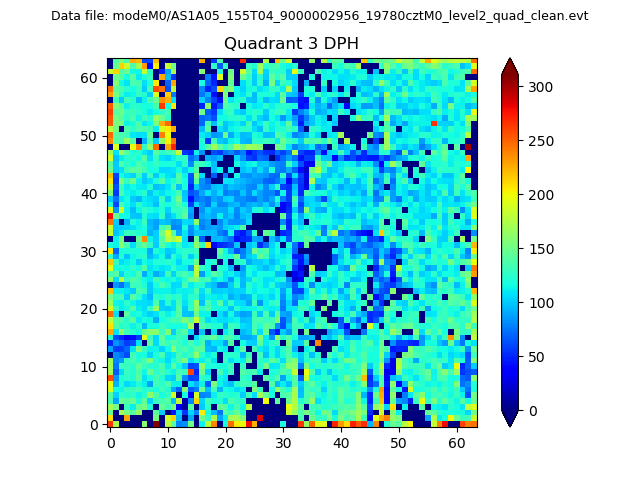 |
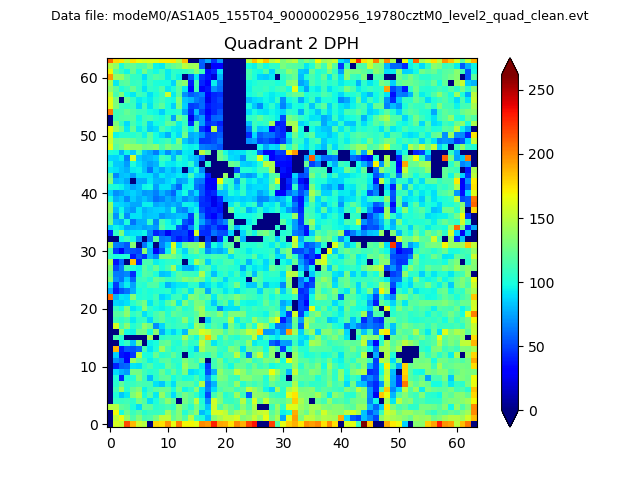 |
Quadrant C |
| Plot type | Count rate plots | Images |
|---|---|---|
| Comparison with Poisson distribution Blue bars denote a histogram of data divided into 1 sec bins. Red curve is a Poisson curve with rate = median count rate of data. |
 |
 |
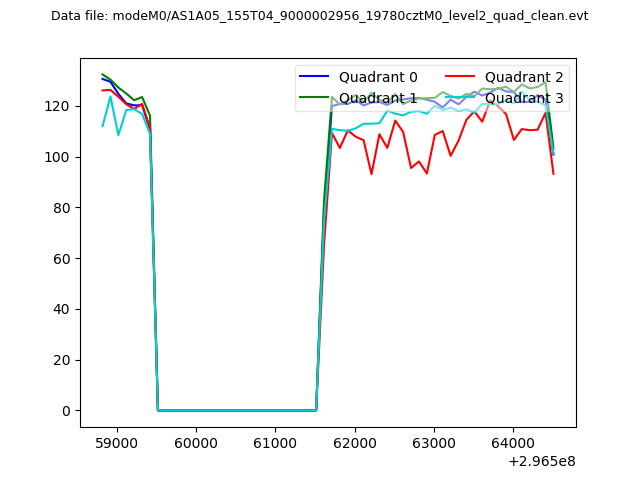
| Quadrant-wise count rates Data is divided into 100 sec bins |
 |
|
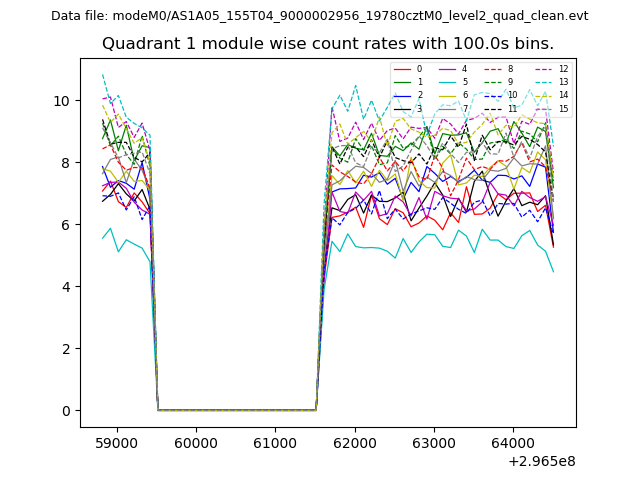
| Module-wise count rates for Quadrant A Data is divided into 100 sec bins |
 |
 |
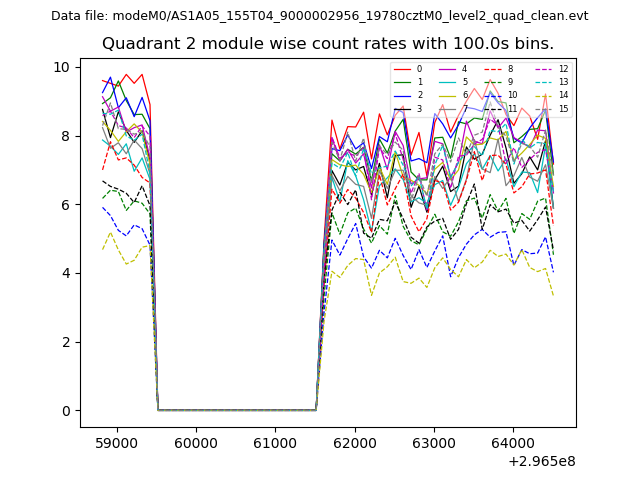
| Module-wise count rates for Quadrant B Data is divided into 100 sec bins |
 |
 |
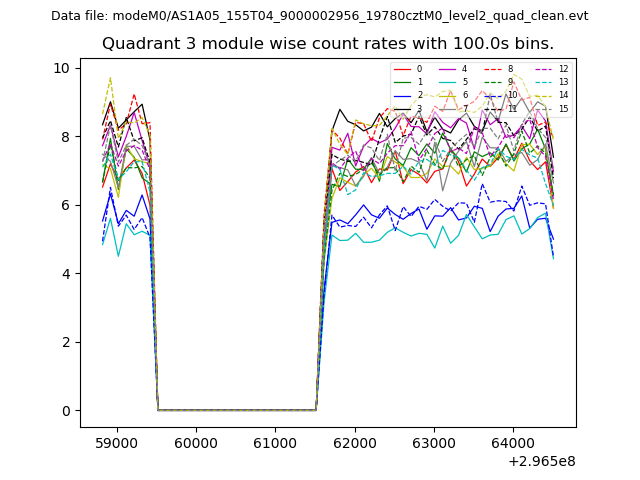
| Module-wise count rates for Quadrant C Data is divided into 100 sec bins |
 |
 |
| Module-wise count rates for Quadrant D Data is divided into 100 sec bins |
 |
 |
| Parameter | Plot |
|---|---|
| CZT HV Monitor | 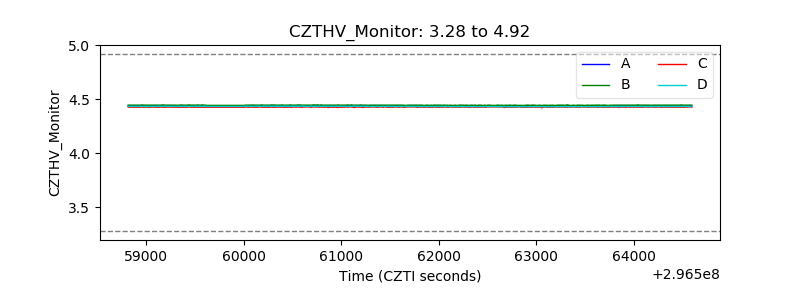 |
| D_VDD | 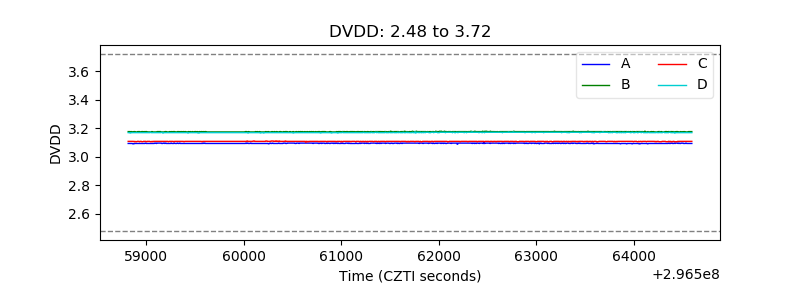 |
| Temperature 1 | 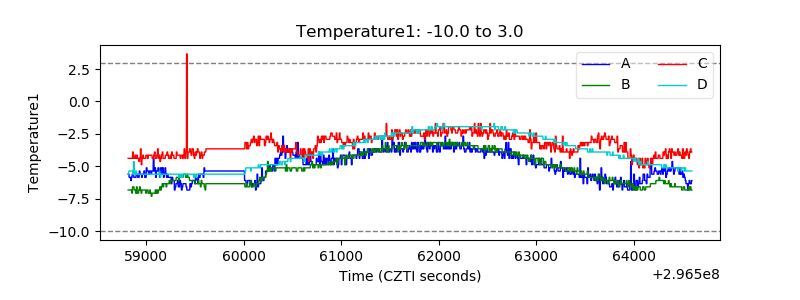 |
| Veto HV Monitor | 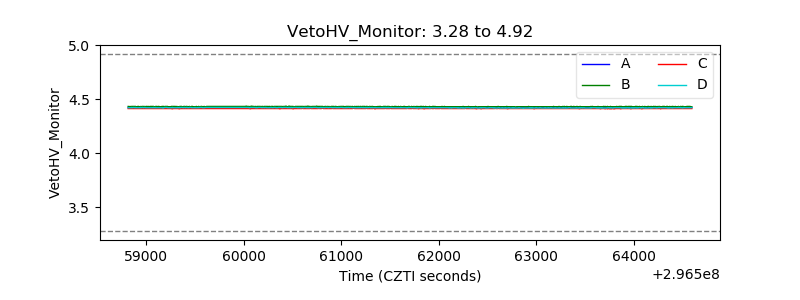 |
| Veto LLD | 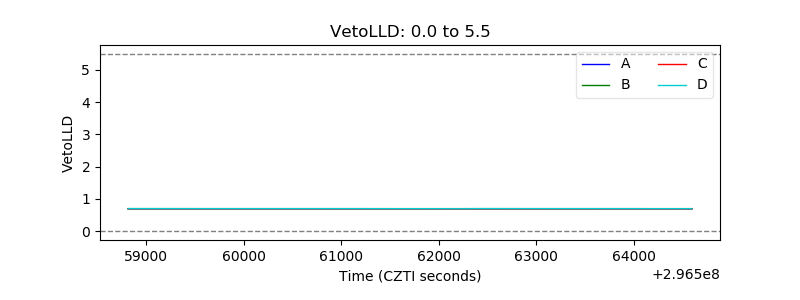 |
| Alpha Counter | 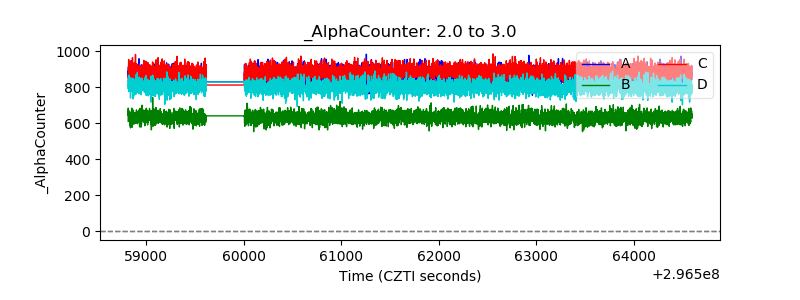 |
| _CPM_Rate | 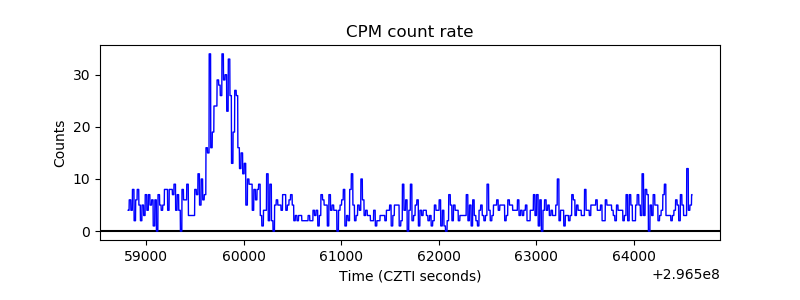 |
| CZT Counter | 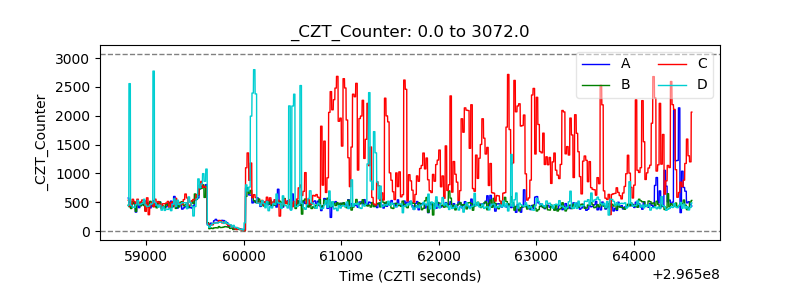 |
| +2.5 Volts monitor |  |
| +5 Volts monitor |  |
| _ROLL_ROT | 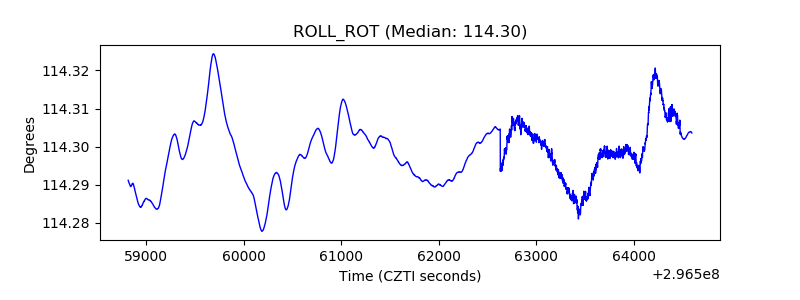 |
| _Roll_DEC | 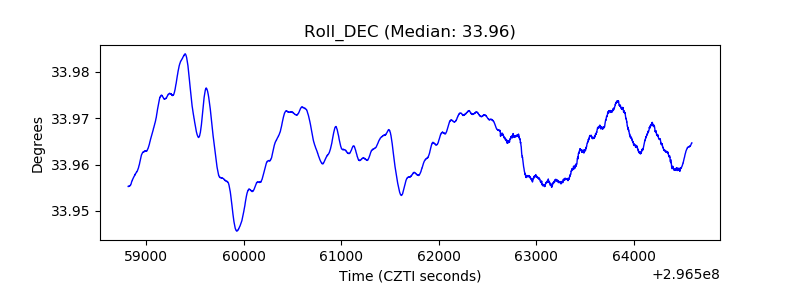 |
| _Roll_RA | 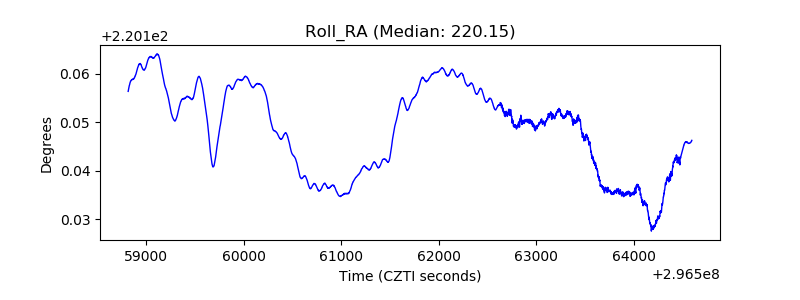 |
| Veto Counter | 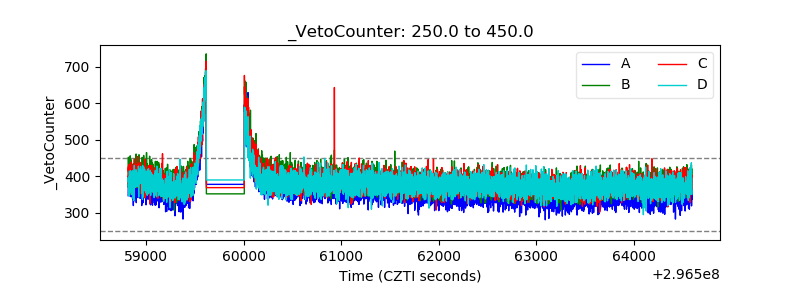 |