| Param | Original file | Final file |
|---|---|---|
| Filename | modeM0/AS1C04_009T06_9000002960_19805cztM0_level2.evt | modeM0/AS1C04_009T06_9000002960_19805cztM0_level2_quad_clean.evt |
| Size (bytes) | 615,939,840 | 134,645,760 |
| Size | 587.4 MB | 128.4 MB |
| Events in quadrant A | 3,327,211 | 926,783 |
| Events in quadrant B | 3,489,079 | 941,448 |
| Events in quadrant C | 3,389,511 | 917,142 |
| Events in quadrant D | 7,941,845 | 773,171 |
| Mode SS | |||
|---|---|---|---|
| Quadrant | BADHDUFLAG | Total packets | Discarded packets |
| A | 0 | 150 | 0 |
| B | 0 | 150 | 0 |
| C | 0 | 150 | 0 |
| D | 0 | 150 | 0 |
| Mode M9 | |||
|---|---|---|---|
| Quadrant | BADHDUFLAG | Total packets | Discarded packets |
| A | 0 | 8 | 0 |
| B | 0 | 9 | 0 |
| C | 0 | 9 | 0 |
| D | 0 | 9 | 0 |
| Mode M0 | |||
|---|---|---|---|
| Quadrant | BADHDUFLAG | Total packets | Discarded packets |
| A | 0 | 15230 | 2 |
| B | 0 | 15539 | 2 |
| C | 0 | 15275 | 2 |
| D | 0 | 28956 | 2 |
| Quadrant | Total seconds | Saturated seconds | Saturation percentage |
|---|---|---|---|
| A | 7461 | 81 | 1.085645% |
| B | 7461 | 106 | 1.420721% |
| C | 7461 | 69 | 0.924809% |
| D | 7460 | 1811 | 24.276139% |
Noise dominated data is calculated using 1-second bins in cleaned event files. If a bin has >2000 counts, and if more than 50% of those come from <1% of pixels, then it is considered to be noise-dominated and hence unusable.
| Quadrant | # 1 sec bins | Bins with >0 counts | Bins with >2000 counts | High rate bins dominated by noise | Noise dominated (total time) | Noise dominated (detector-on time) | Marked lightcurve |
|---|---|---|---|---|---|---|---|
| A | 7791 | 7462 | 0 | 0 | 0.00% | 0.00% | 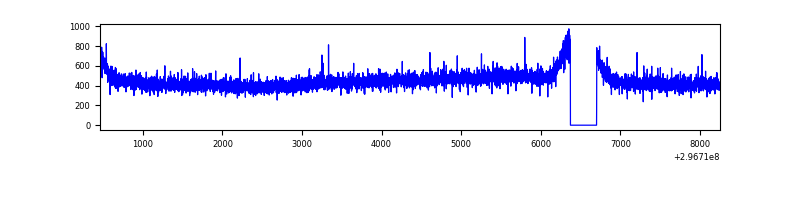 |
| B | 7791 | 7461 | 6 | 6 | 0.08% | 0.08% |  |
| C | 7791 | 7462 | 0 | 0 | 0.00% | 0.00% | 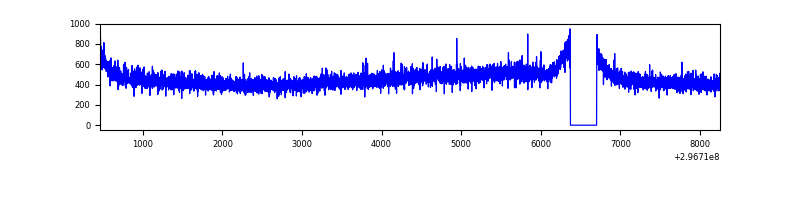 |
| D | 7790 | 7460 | 1596 | 1596 | 20.49% | 21.39% |  |
Top three noisy pixels from each quadrant. If the there are fewer than three noisy pixels in the level2.evt file, extra rows are filled as -1
| Pixel properties | Quadrant properties | ||||||
|---|---|---|---|---|---|---|---|
| Quadrant | DetID | PixID | Counts | Sigma | Mean | Median | Sigma |
| A | 0 | 226 | 7550 | 38.04 | 864 | 842 | 176.3 |
| A | 3 | 137 | 7123 | 35.62 | 864 | 842 | 176.3 |
| A | 12 | 194 | 6337 | 31.16 | 864 | 842 | 176.3 |
| B | 7 | 220 | 33723 | 200.54 | 864 | 840 | 164.0 |
| B | 0 | 197 | 26279 | 155.14 | 864 | 840 | 164.0 |
| B | 4 | 216 | 20902 | 122.35 | 864 | 840 | 164.0 |
| C | 14 | 238 | 130564 | 671.59 | 831 | 836 | 193.2 |
| C | 3 | 233 | 18939 | 93.72 | 831 | 836 | 193.2 |
| C | 13 | 61 | 5920 | 26.32 | 831 | 836 | 193.2 |
| D | 7 | 238 | 3340904 | 18744.46 | 739 | 715 | 178.2 |
| D | 7 | 38 | 1199699 | 6728.45 | 739 | 715 | 178.2 |
| D | 2 | 69 | 236282 | 1321.95 | 739 | 715 | 178.2 |
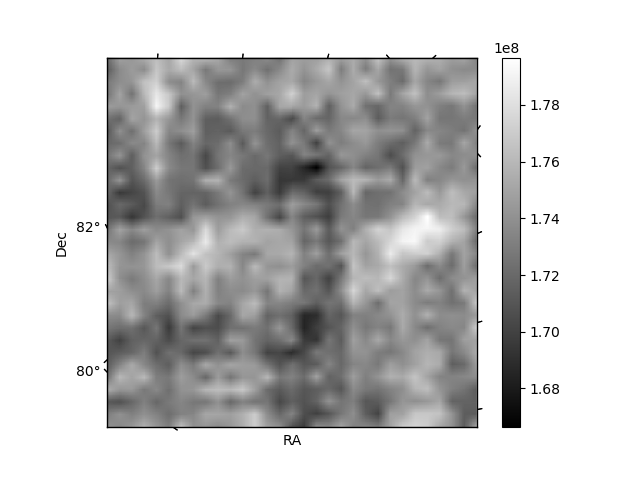
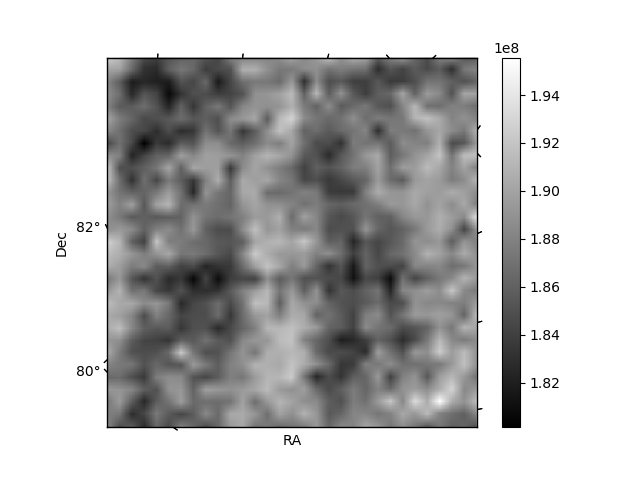
Histogram calculated using DETX and DETY for each event in the final _common_clean file
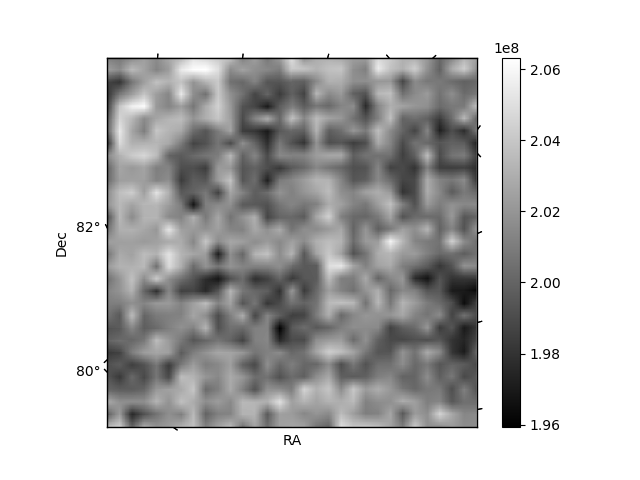
| Quadrant A | 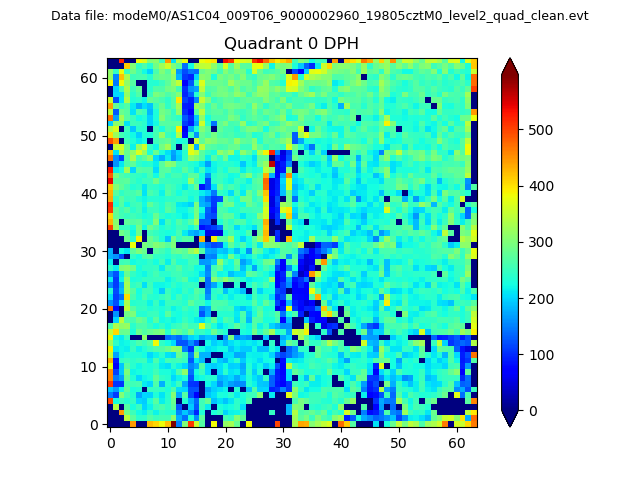 |
 |
Quadrant B |
|---|---|---|---|
| Quadrant D | 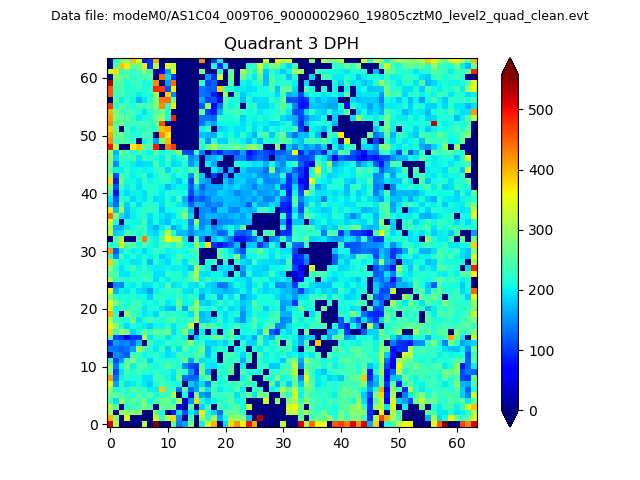 |
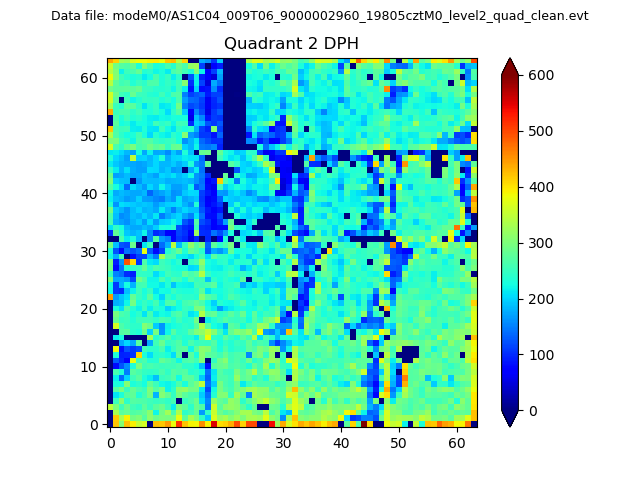 |
Quadrant C |
| Plot type | Count rate plots | Images |
|---|---|---|
| Comparison with Poisson distribution Blue bars denote a histogram of data divided into 1 sec bins. Red curve is a Poisson curve with rate = median count rate of data. |
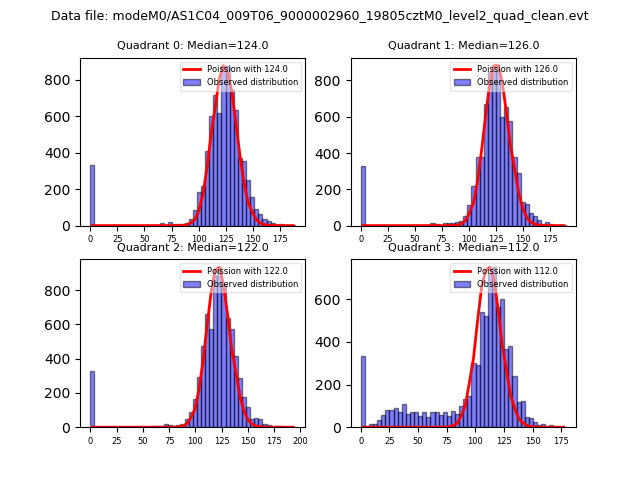 |
 |
| Quadrant-wise count rates Data is divided into 100 sec bins |
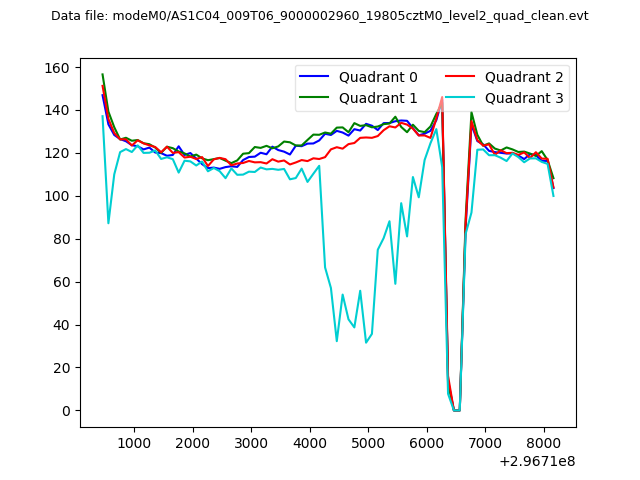 |
|
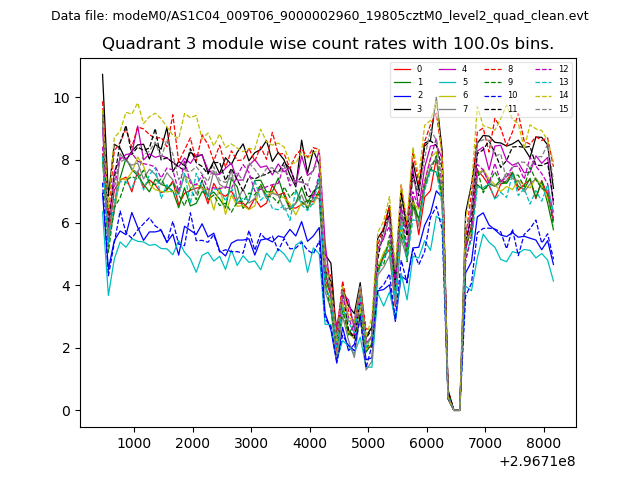
| Module-wise count rates for Quadrant A Data is divided into 100 sec bins |
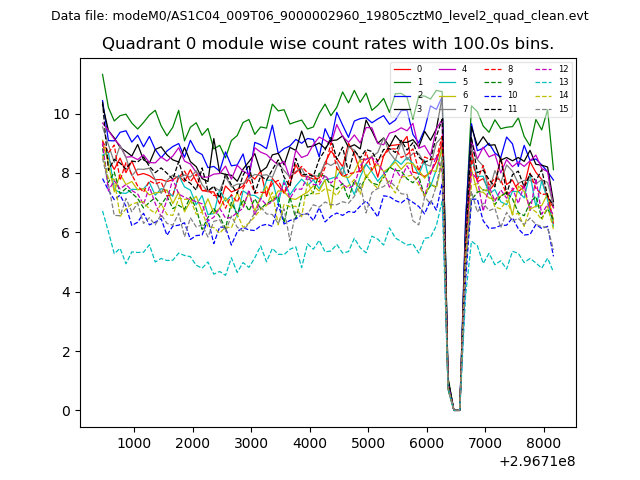 |
 |
| Module-wise count rates for Quadrant B Data is divided into 100 sec bins |
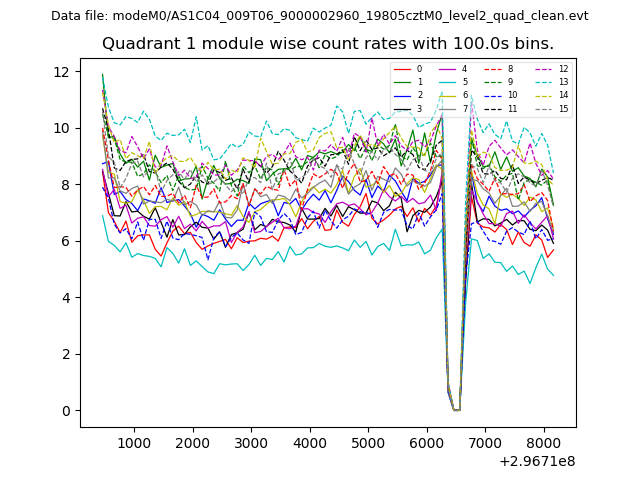 |
 |
| Module-wise count rates for Quadrant C Data is divided into 100 sec bins |
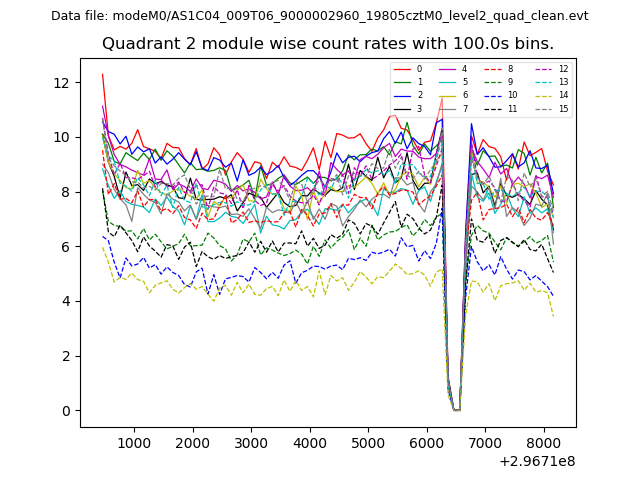 |
 |
| Module-wise count rates for Quadrant D Data is divided into 100 sec bins |
 |
 |
| Parameter | Plot |
|---|---|
| CZT HV Monitor | 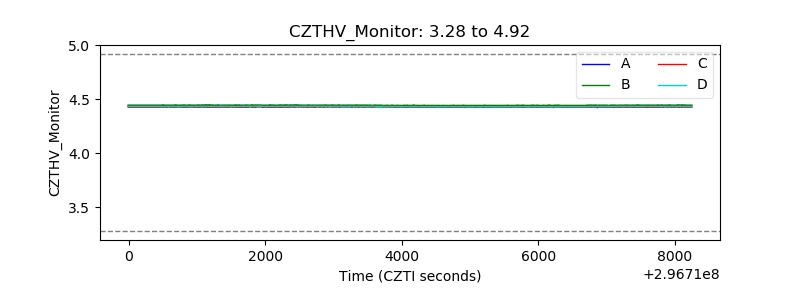 |
| D_VDD | 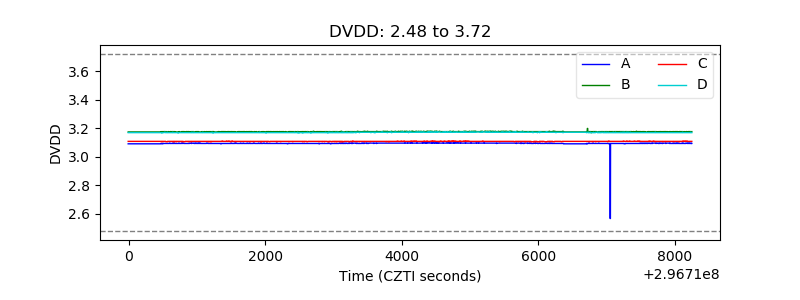 |
| Temperature 1 |  |
| Veto HV Monitor | 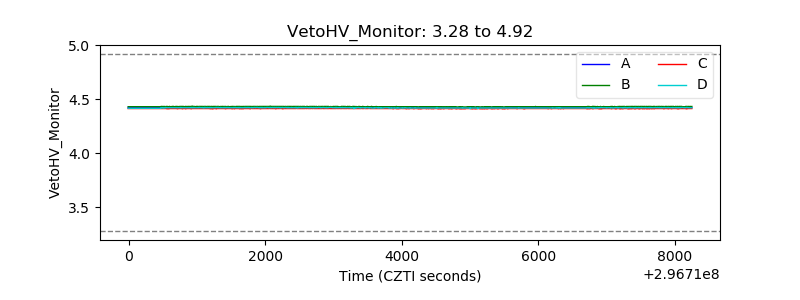 |
| Veto LLD | 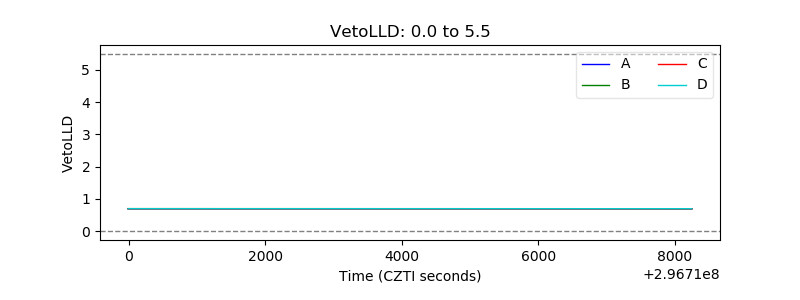 |
| Alpha Counter | 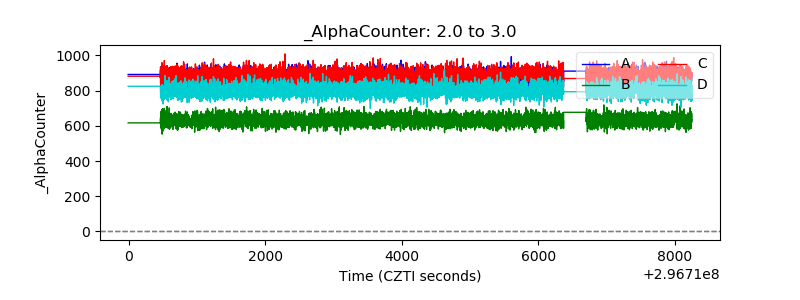 |
| _CPM_Rate | 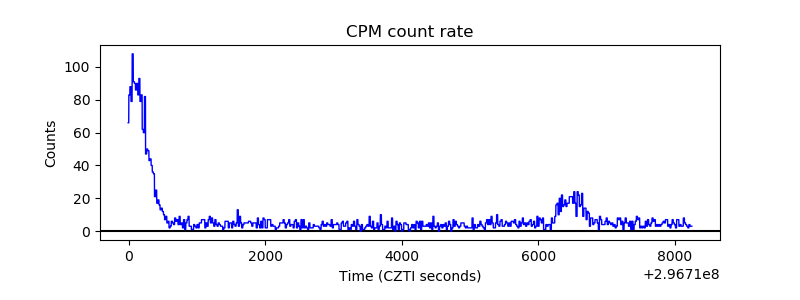 |
| CZT Counter | 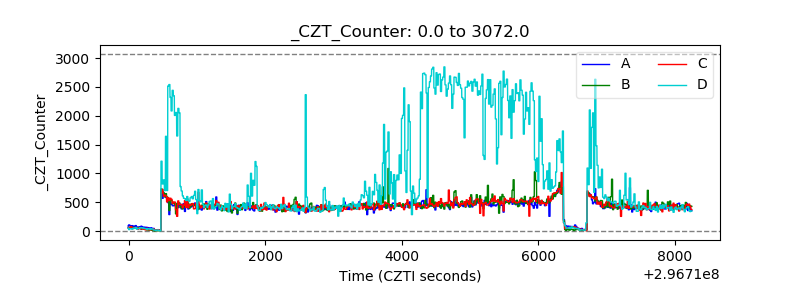 |
| +2.5 Volts monitor |  |
| +5 Volts monitor |  |
| _ROLL_ROT | 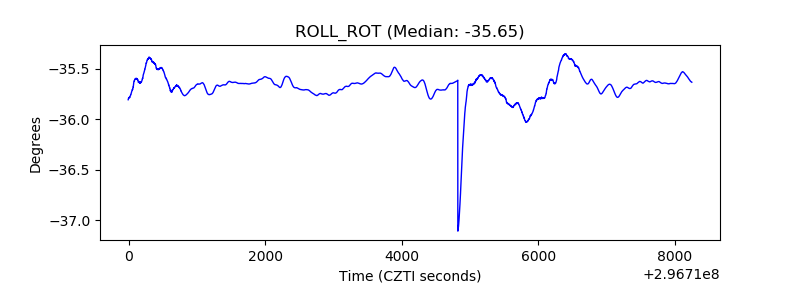 |
| _Roll_DEC | 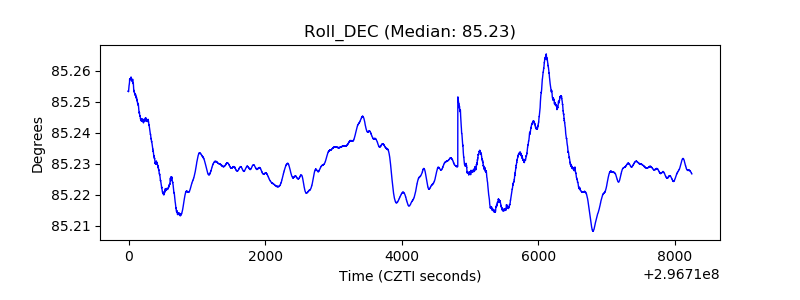 |
| _Roll_RA | 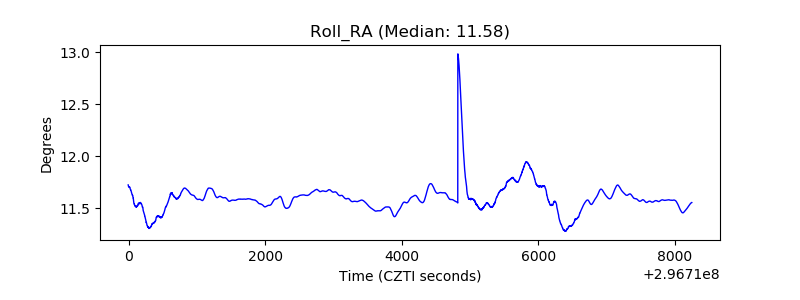 |
| Veto Counter | 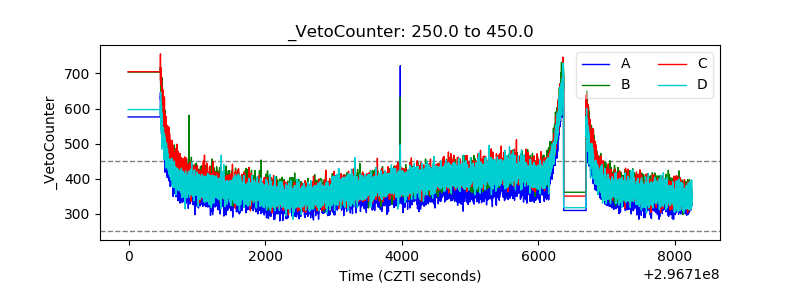 |