| Param | Original file | Final file |
|---|---|---|
| Filename | modeM0/AS1C04_009T06_9000002960_19810cztM0_level2.evt | modeM0/AS1C04_009T06_9000002960_19810cztM0_level2_quad_clean.evt |
| Size (bytes) | 1,066,392,000 | 226,788,480 |
| Size | 1017.0 MB | 216.3 MB |
| Events in quadrant A | 5,683,455 | 1,555,474 |
| Events in quadrant B | 8,471,866 | 1,546,851 |
| Events in quadrant C | 5,781,328 | 1,510,859 |
| Events in quadrant D | 11,513,418 | 1,389,791 |
| Mode SS | |||
|---|---|---|---|
| Quadrant | BADHDUFLAG | Total packets | Discarded packets |
| A | 0 | 254 | 0 |
| B | 0 | 254 | 0 |
| C | 0 | 254 | 0 |
| D | 0 | 254 | 0 |
| Mode M9 | |||
|---|---|---|---|
| Quadrant | BADHDUFLAG | Total packets | Discarded packets |
| A | 0 | 17 | 0 |
| B | 0 | 18 | 0 |
| C | 0 | 18 | 0 |
| D | 0 | 18 | 0 |
| Mode M0 | |||
|---|---|---|---|
| Quadrant | BADHDUFLAG | Total packets | Discarded packets |
| A | 0 | 25430 | 3 |
| B | 0 | 33449 | 3 |
| C | 0 | 25432 | 3 |
| D | 0 | 42896 | 3 |
| Quadrant | Total seconds | Saturated seconds | Saturation percentage |
|---|---|---|---|
| A | 12525 | 82 | 0.654691% |
| B | 12525 | 483 | 3.856287% |
| C | 12525 | 128 | 1.021956% |
| D | 12525 | 1453 | 11.600798% |
Noise dominated data is calculated using 1-second bins in cleaned event files. If a bin has >2000 counts, and if more than 50% of those come from <1% of pixels, then it is considered to be noise-dominated and hence unusable.
| Quadrant | # 1 sec bins | Bins with >0 counts | Bins with >2000 counts | High rate bins dominated by noise | Noise dominated (total time) | Noise dominated (detector-on time) | Marked lightcurve |
|---|---|---|---|---|---|---|---|
| A | 14125 | 12526 | 1 | 1 | 0.01% | 0.01% |  |
| B | 14125 | 12527 | 347 | 347 | 2.46% | 2.77% |  |
| C | 14125 | 12527 | 3 | 3 | 0.02% | 0.02% | 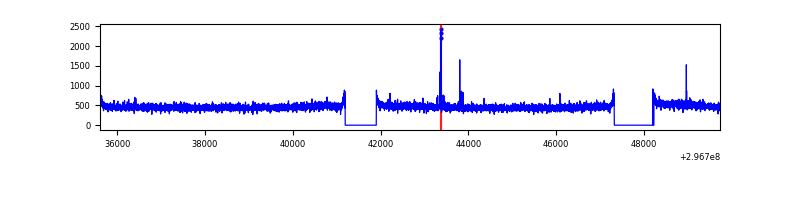 |
| D | 14125 | 12526 | 1218 | 1218 | 8.62% | 9.72% |  |
Top three noisy pixels from each quadrant. If the there are fewer than three noisy pixels in the level2.evt file, extra rows are filled as -1
| Pixel properties | Quadrant properties | ||||||
|---|---|---|---|---|---|---|---|
| Quadrant | DetID | PixID | Counts | Sigma | Mean | Median | Sigma |
| A | 0 | 226 | 13008 | 39.06 | 1469 | 1436 | 296.3 |
| A | 3 | 137 | 11498 | 33.96 | 1469 | 1436 | 296.3 |
| A | 4 | 2 | 10778 | 31.53 | 1469 | 1436 | 296.3 |
| B | 10 | 245 | 2351229 | 8543.45 | 1451 | 1411 | 275.0 |
| B | 7 | 220 | 161329 | 581.43 | 1451 | 1411 | 275.0 |
| B | 4 | 216 | 100911 | 361.76 | 1451 | 1411 | 275.0 |
| C | 14 | 238 | 220516 | 668.58 | 1407 | 1414 | 327.7 |
| C | 3 | 233 | 48608 | 144.01 | 1407 | 1414 | 327.7 |
| C | 0 | 207 | 29410 | 85.43 | 1407 | 1414 | 327.7 |
| D | 1 | 52 | 3060720 | 9252.8 | 1364 | 1322 | 330.6 |
| D | 7 | 38 | 1111425 | 3357.38 | 1364 | 1322 | 330.6 |
| D | 2 | 69 | 777798 | 2348.36 | 1364 | 1322 | 330.6 |
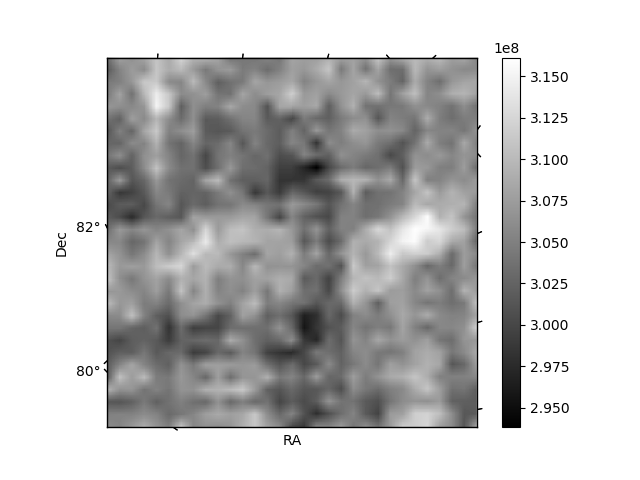
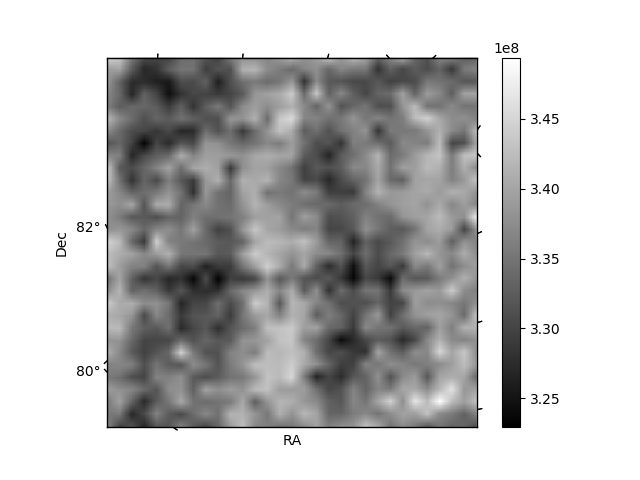
Histogram calculated using DETX and DETY for each event in the final _common_clean file
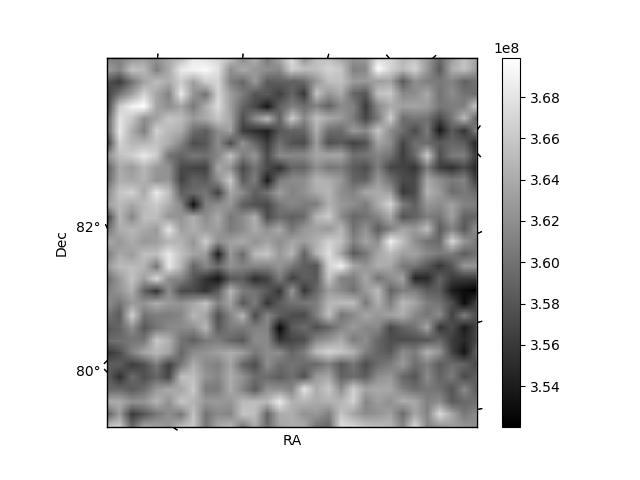
| Quadrant A | 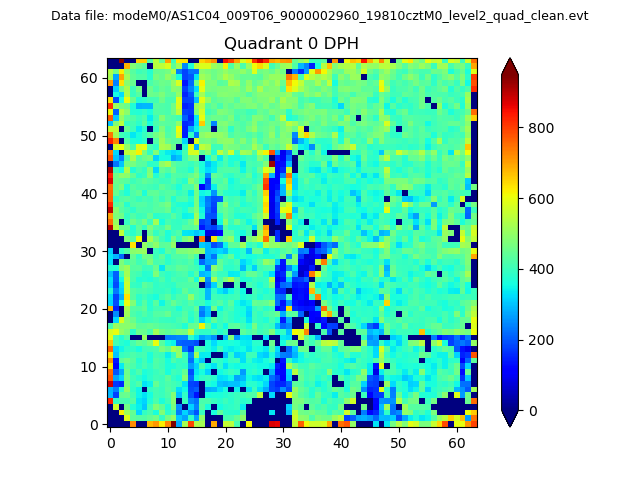 |
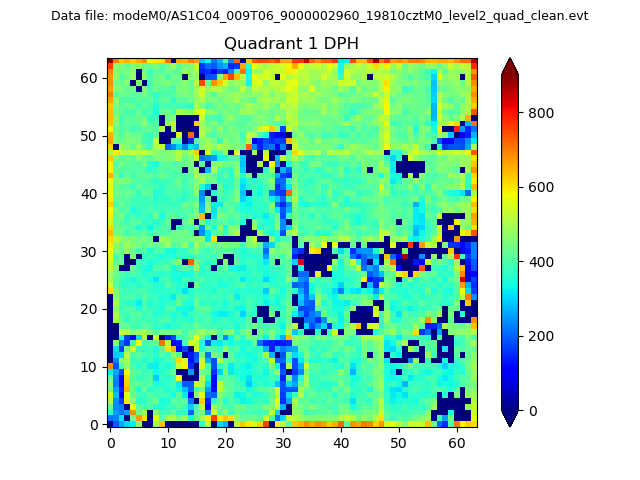 |
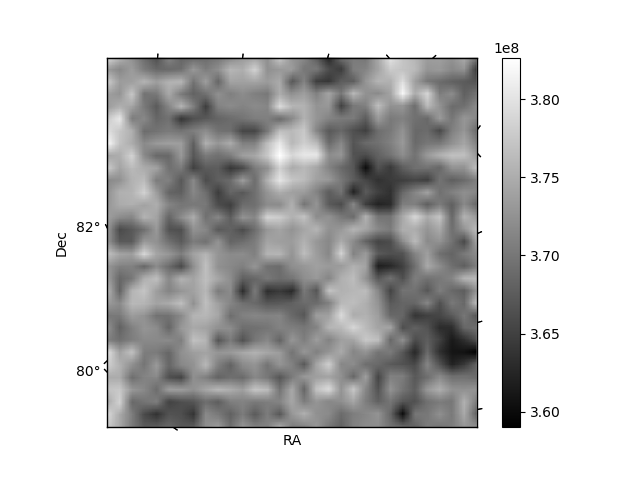
Quadrant B |
|---|---|---|---|
| Quadrant D | 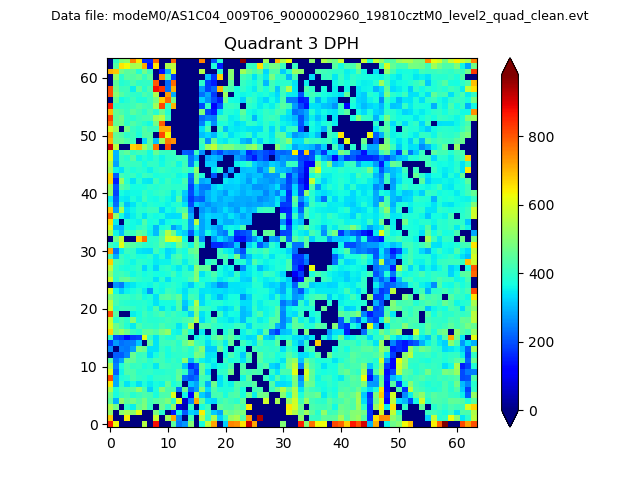 |
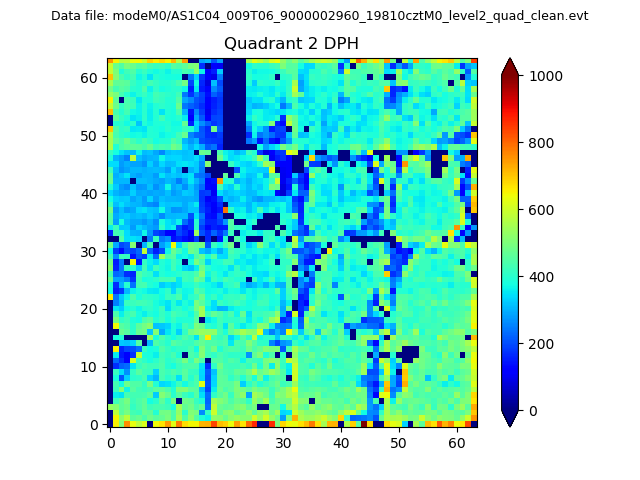 |
Quadrant C |
| Plot type | Count rate plots | Images |
|---|---|---|
| Comparison with Poisson distribution Blue bars denote a histogram of data divided into 1 sec bins. Red curve is a Poisson curve with rate = median count rate of data. |
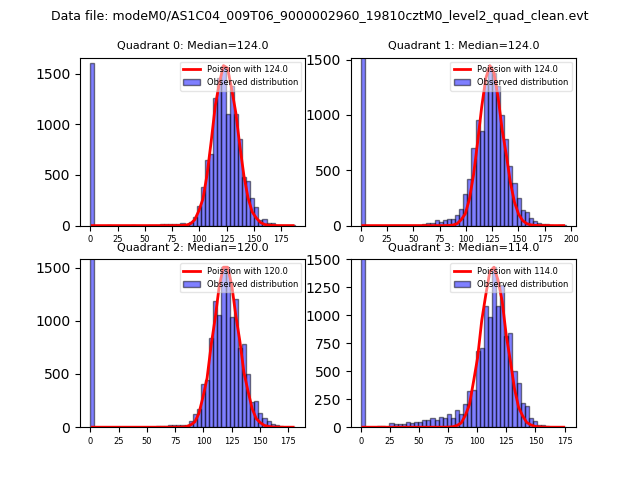 |
 |
| Quadrant-wise count rates Data is divided into 100 sec bins |
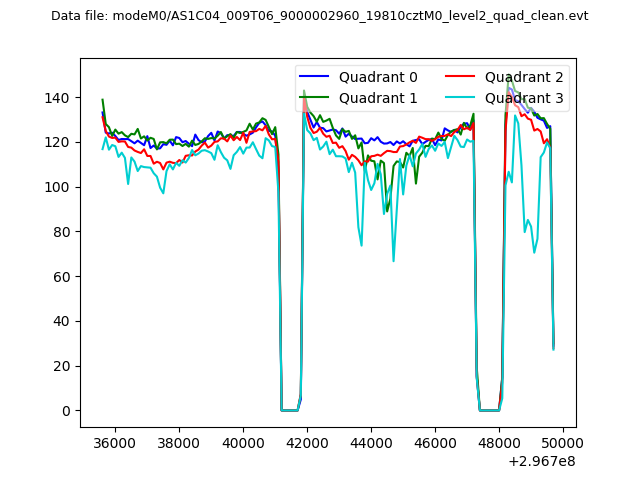 |
|
| Module-wise count rates for Quadrant A Data is divided into 100 sec bins |
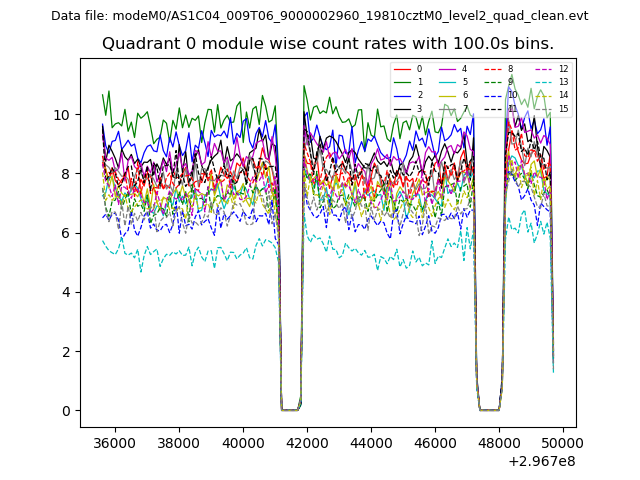 |
 |
| Module-wise count rates for Quadrant B Data is divided into 100 sec bins |
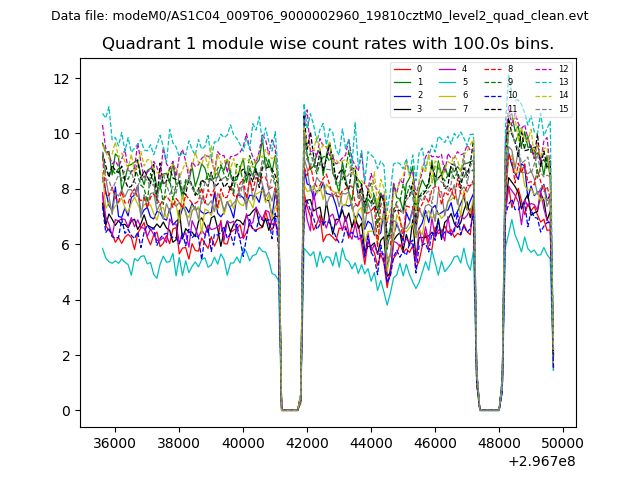 |
 |
| Module-wise count rates for Quadrant C Data is divided into 100 sec bins |
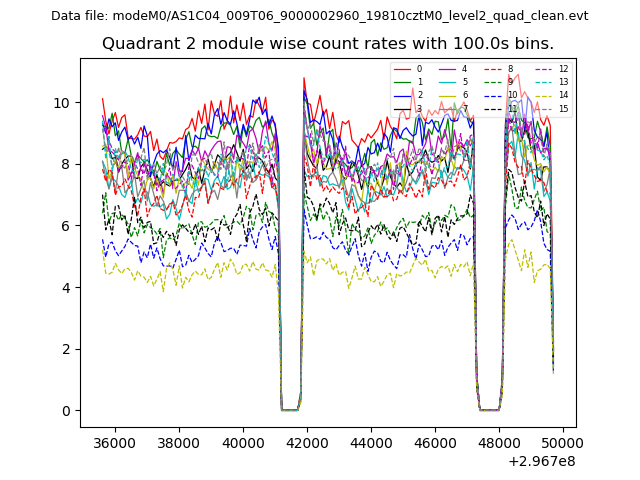 |
 |
| Module-wise count rates for Quadrant D Data is divided into 100 sec bins |
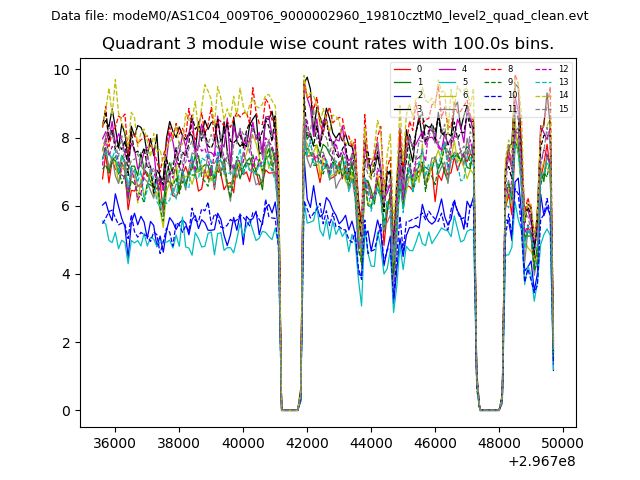 |
 |
| Parameter | Plot |
|---|---|
| CZT HV Monitor | 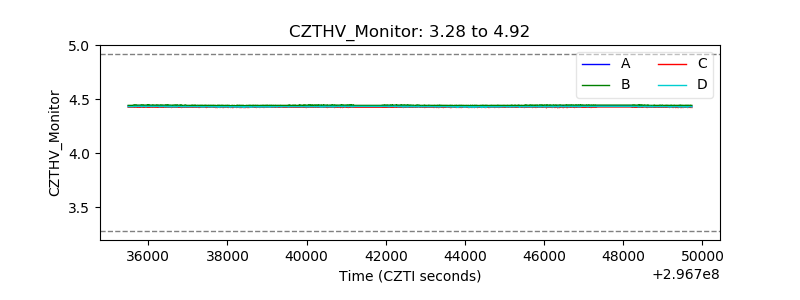 |
| D_VDD | 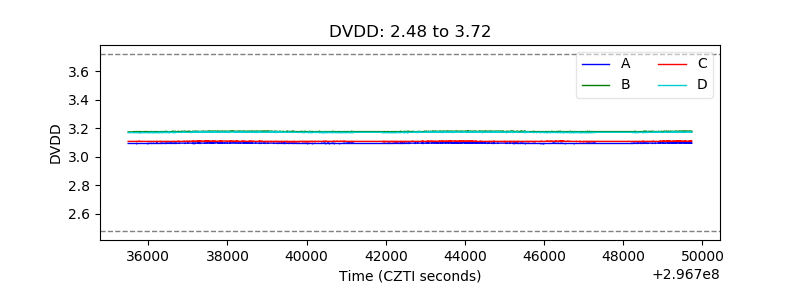 |
| Temperature 1 | 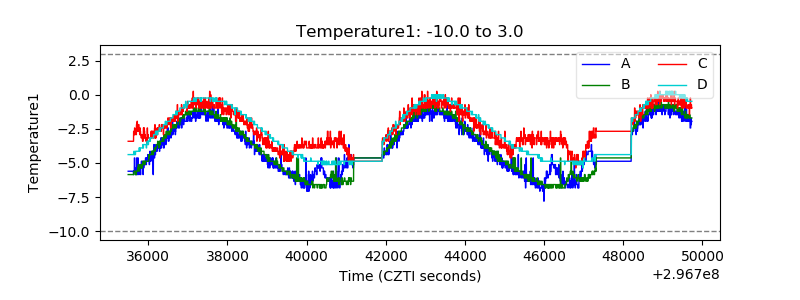 |
| Veto HV Monitor | 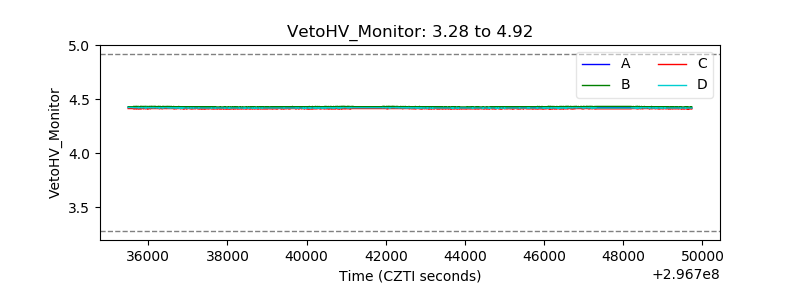 |
| Veto LLD | 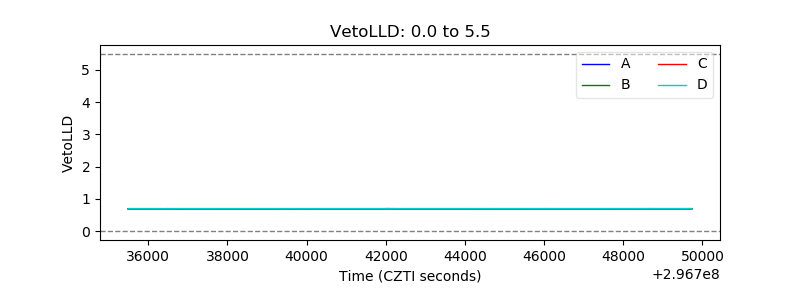 |
| Alpha Counter | 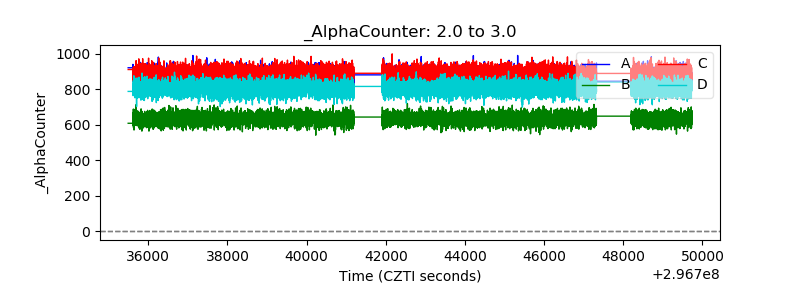 |
| _CPM_Rate | 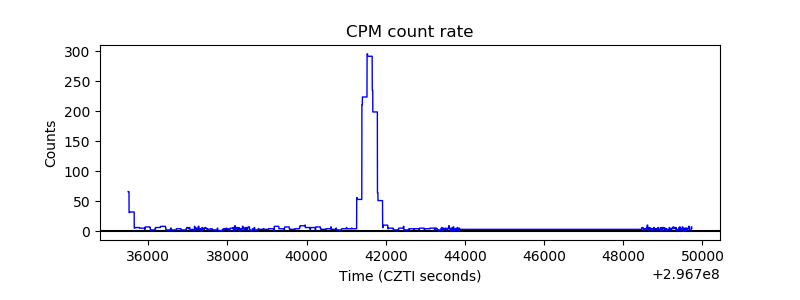 |
| CZT Counter | 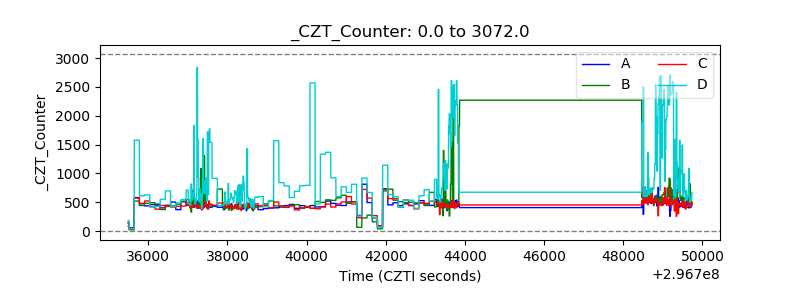 |
| +2.5 Volts monitor |  |
| +5 Volts monitor | 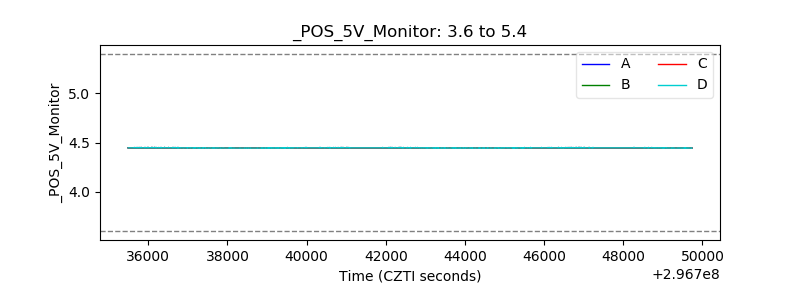 |
| _ROLL_ROT | 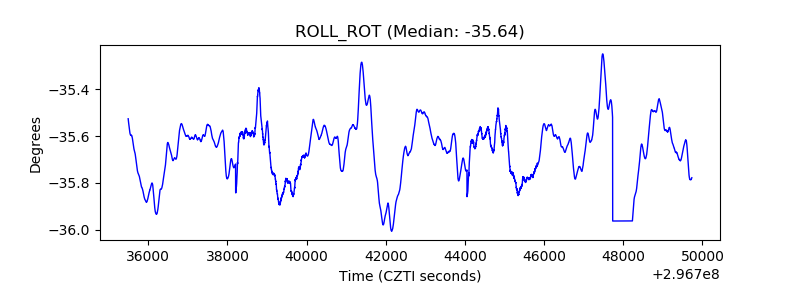 |
| _Roll_DEC | 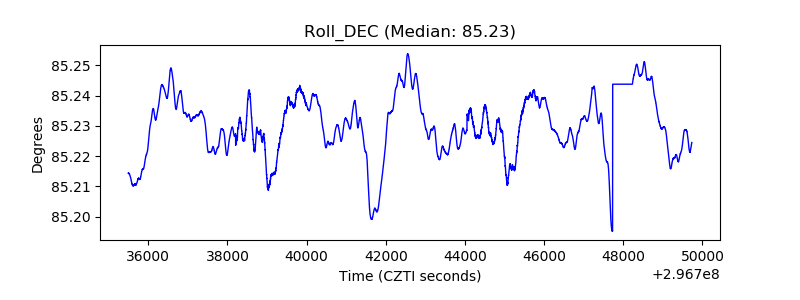 |
| _Roll_RA | 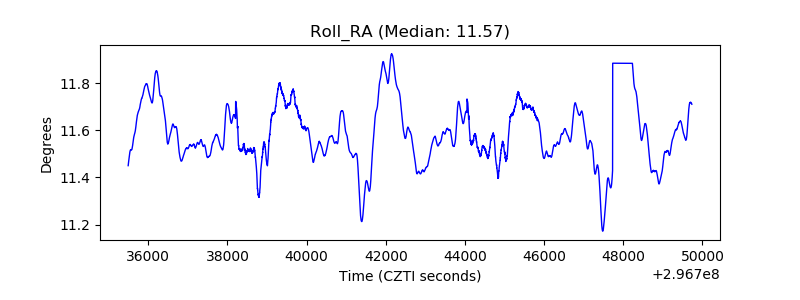 |
| Veto Counter | 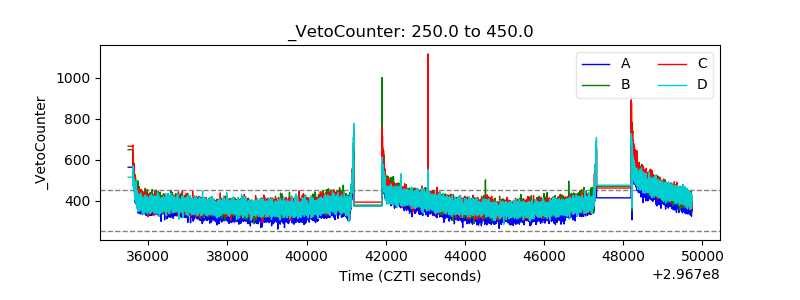 |