| Param | Original file | Final file |
|---|---|---|
| Filename | modeM0/AS1C04_009T06_9000002960_19811cztM0_level2.evt | modeM0/AS1C04_009T06_9000002960_19811cztM0_level2_quad_clean.evt |
| Size (bytes) | 529,902,720 | 120,888,000 |
| Size | 505.4 MB | 115.3 MB |
| Events in quadrant A | 2,967,193 | 831,008 |
| Events in quadrant B | 3,494,204 | 834,437 |
| Events in quadrant C | 3,095,230 | 812,484 |
| Events in quadrant D | 6,060,185 | 739,589 |
| Mode SS | |||
|---|---|---|---|
| Quadrant | BADHDUFLAG | Total packets | Discarded packets |
| A | 0 | 128 | 0 |
| B | 0 | 128 | 0 |
| C | 0 | 128 | 0 |
| D | 0 | 128 | 0 |
| Mode M9 | |||
|---|---|---|---|
| Quadrant | BADHDUFLAG | Total packets | Discarded packets |
| A | 0 | 11 | 0 |
| B | 0 | 11 | 0 |
| C | 0 | 11 | 0 |
| D | 0 | 11 | 0 |
| Mode M0 | |||
|---|---|---|---|
| Quadrant | BADHDUFLAG | Total packets | Discarded packets |
| A | 0 | 13123 | 1 |
| B | 0 | 14614 | 1 |
| C | 0 | 13422 | 2 |
| D | 0 | 22377 | 1 |
| Quadrant | Total seconds | Saturated seconds | Saturation percentage |
|---|---|---|---|
| A | 6361 | 45 | 0.707436% |
| B | 6362 | 68 | 1.068846% |
| C | 6361 | 81 | 1.273385% |
| D | 6361 | 912 | 14.337368% |
Noise dominated data is calculated using 1-second bins in cleaned event files. If a bin has >2000 counts, and if more than 50% of those come from <1% of pixels, then it is considered to be noise-dominated and hence unusable.
| Quadrant | # 1 sec bins | Bins with >0 counts | Bins with >2000 counts | High rate bins dominated by noise | Noise dominated (total time) | Noise dominated (detector-on time) | Marked lightcurve |
|---|---|---|---|---|---|---|---|
| A | 7406 | 6361 | 1 | 1 | 0.01% | 0.02% | 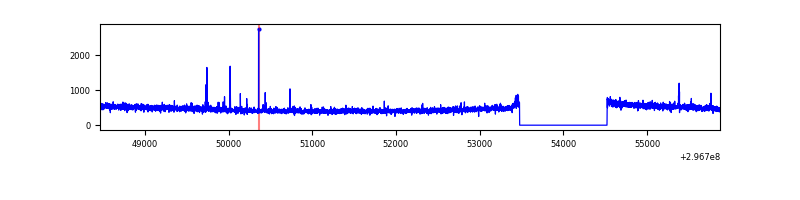 |
| B | 7407 | 6362 | 16 | 16 | 0.22% | 0.25% | 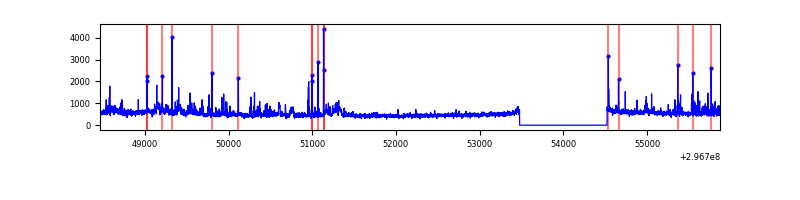 |
| C | 7406 | 6361 | 6 | 6 | 0.08% | 0.09% | 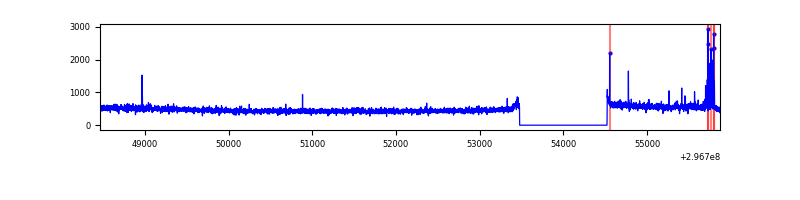 |
| D | 7406 | 6361 | 721 | 721 | 9.74% | 11.33% | 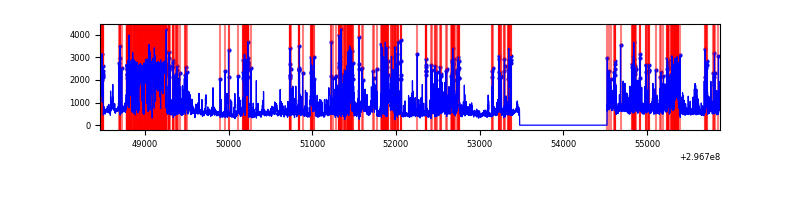 |
Top three noisy pixels from each quadrant. If the there are fewer than three noisy pixels in the level2.evt file, extra rows are filled as -1
| Pixel properties | Quadrant properties | ||||||
|---|---|---|---|---|---|---|---|
| Quadrant | DetID | PixID | Counts | Sigma | Mean | Median | Sigma |
| A | 5 | 16 | 18748 | 117.36 | 765 | 749 | 153.4 |
| A | 0 | 226 | 6698 | 38.79 | 765 | 749 | 153.4 |
| A | 12 | 194 | 5732 | 32.49 | 765 | 749 | 153.4 |
| B | 10 | 245 | 251778 | 1756.79 | 761 | 743 | 142.9 |
| B | 0 | 197 | 74541 | 516.45 | 761 | 743 | 142.9 |
| B | 7 | 220 | 47173 | 324.93 | 761 | 743 | 142.9 |
| C | 14 | 238 | 115177 | 663.99 | 738 | 742 | 172.3 |
| C | 0 | 207 | 70277 | 403.46 | 738 | 742 | 172.3 |
| C | 3 | 233 | 32882 | 186.49 | 738 | 742 | 172.3 |
| D | 1 | 52 | 2517217 | 14656.55 | 708 | 687 | 171.7 |
| D | 12 | 218 | 149978 | 869.49 | 708 | 687 | 171.7 |
| D | 7 | 38 | 145416 | 842.92 | 708 | 687 | 171.7 |
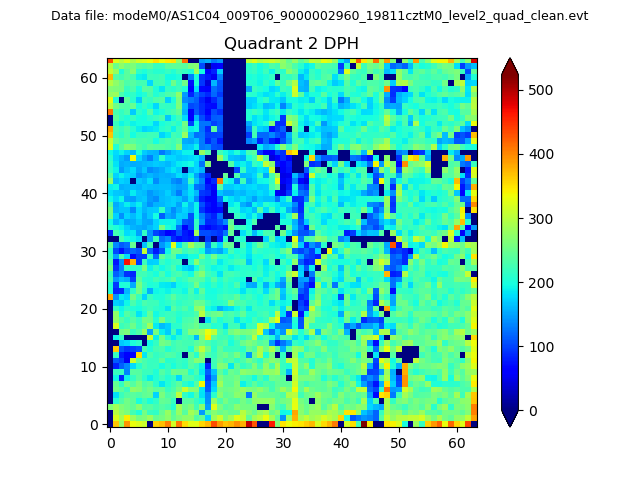
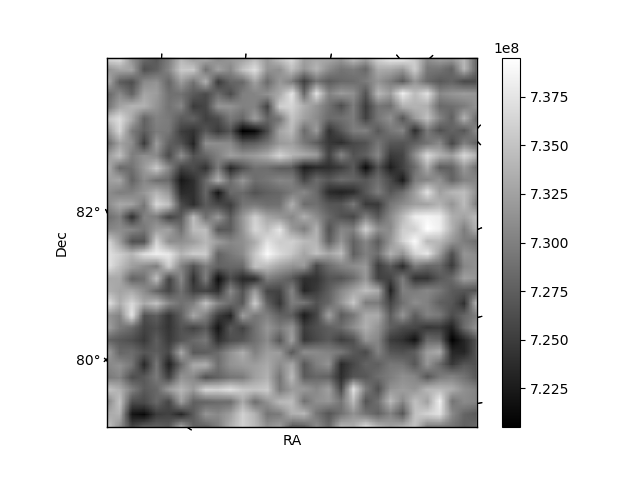
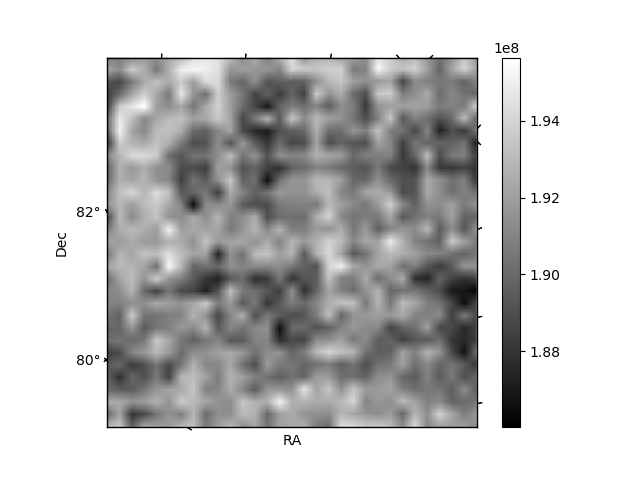
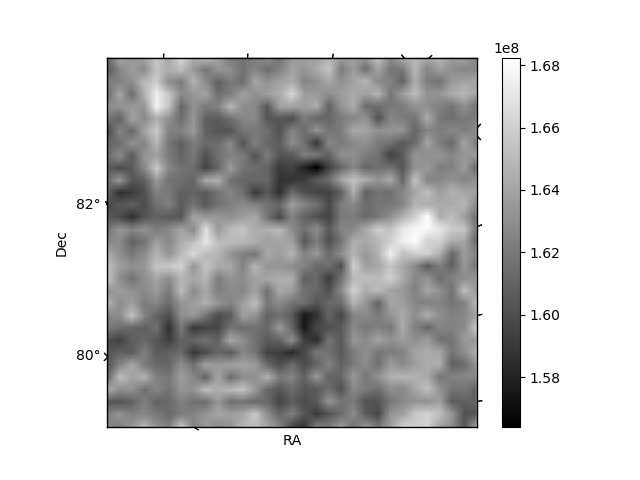
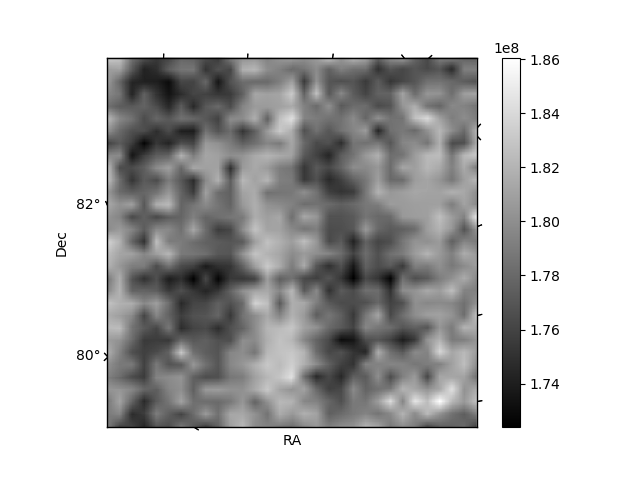
Histogram calculated using DETX and DETY for each event in the final _common_clean file
| Quadrant A | 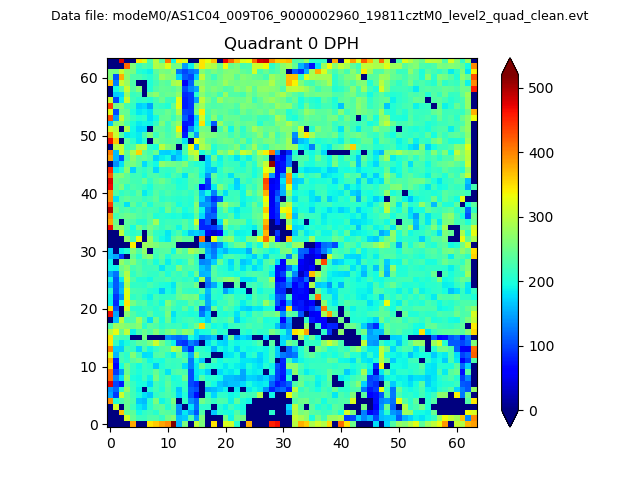 |
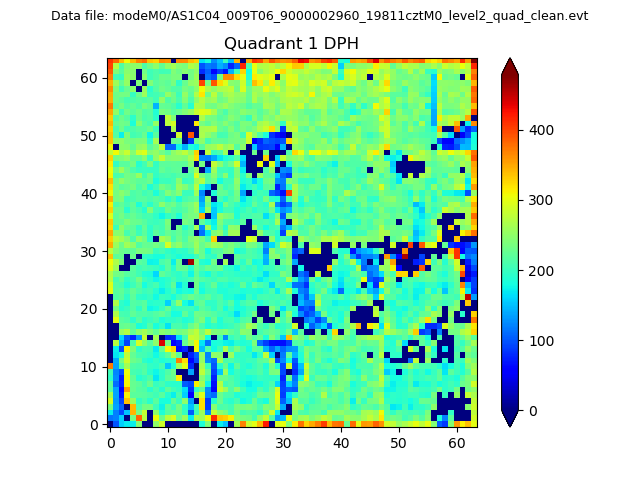 |
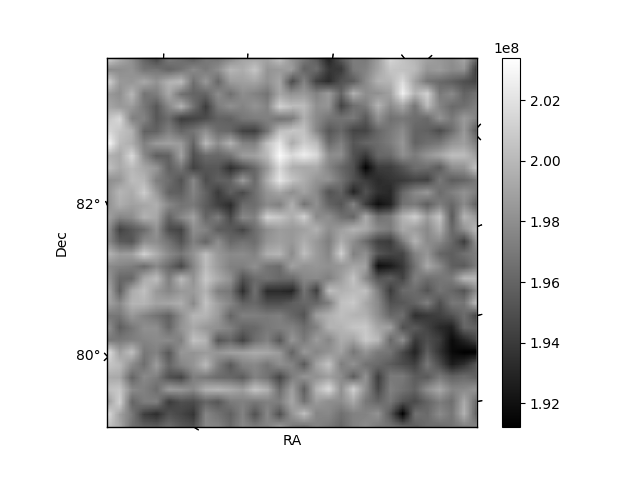
Quadrant B |
|---|---|---|---|
| Quadrant D | 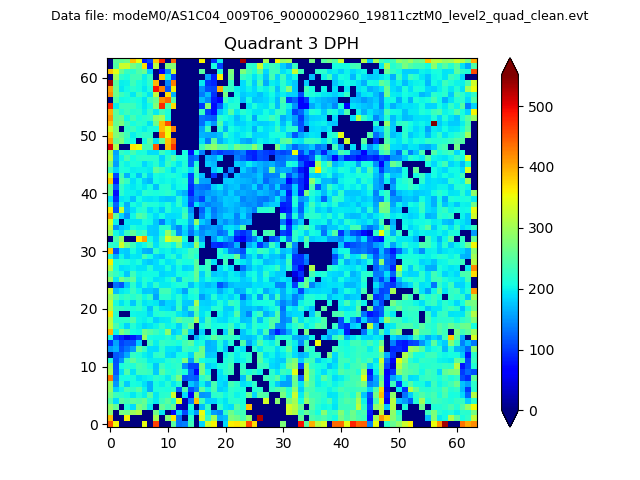 |
 |
Quadrant C |
| Plot type | Count rate plots | Images |
|---|---|---|
| Comparison with Poisson distribution Blue bars denote a histogram of data divided into 1 sec bins. Red curve is a Poisson curve with rate = median count rate of data. |
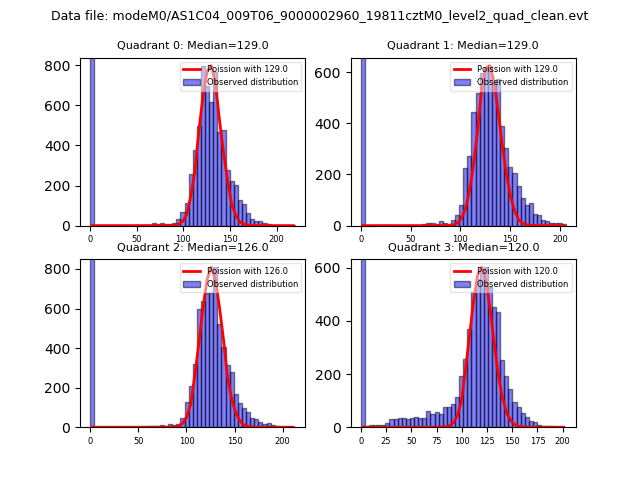 |
 |
| Quadrant-wise count rates Data is divided into 100 sec bins |
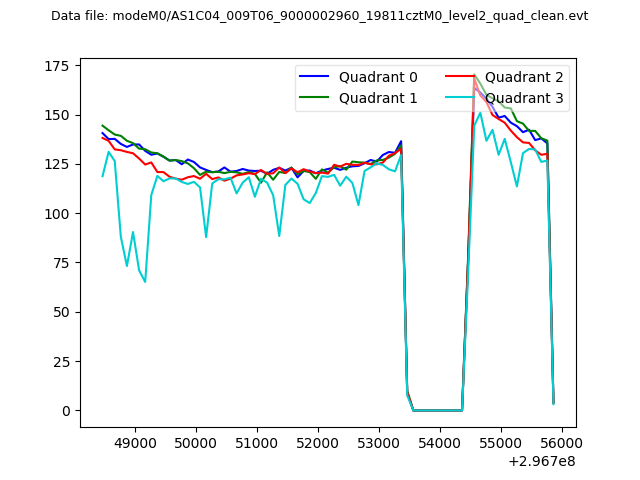 |
|
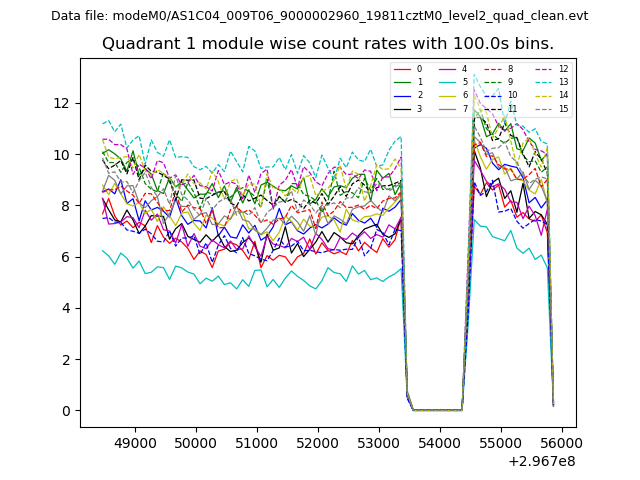
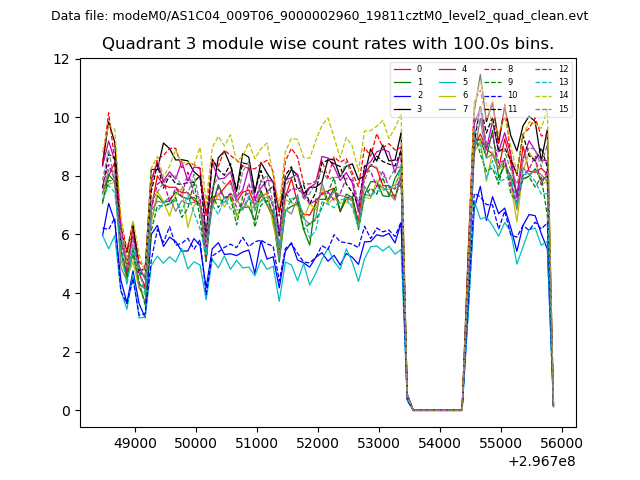
| Module-wise count rates for Quadrant A Data is divided into 100 sec bins |
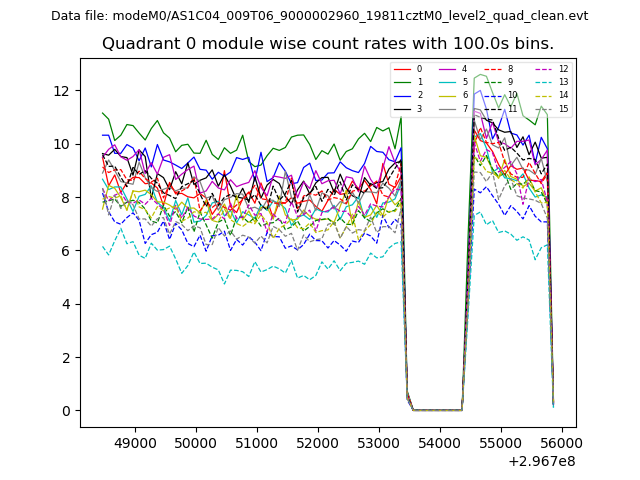 |
 |
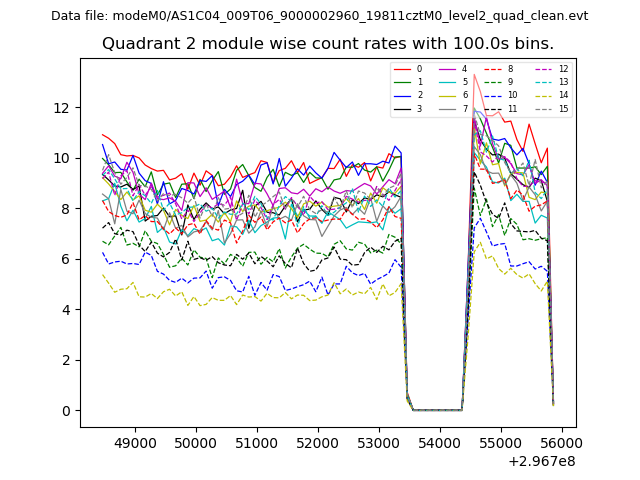
| Module-wise count rates for Quadrant B Data is divided into 100 sec bins |
 |
 |
| Module-wise count rates for Quadrant C Data is divided into 100 sec bins |
 |
 |
| Module-wise count rates for Quadrant D Data is divided into 100 sec bins |
 |
 |
| Parameter | Plot |
|---|---|
| CZT HV Monitor | 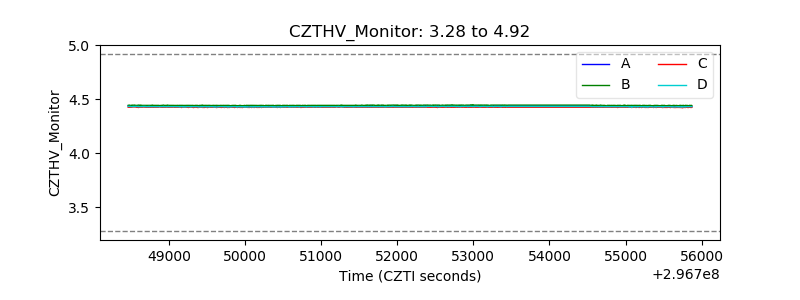 |
| D_VDD | 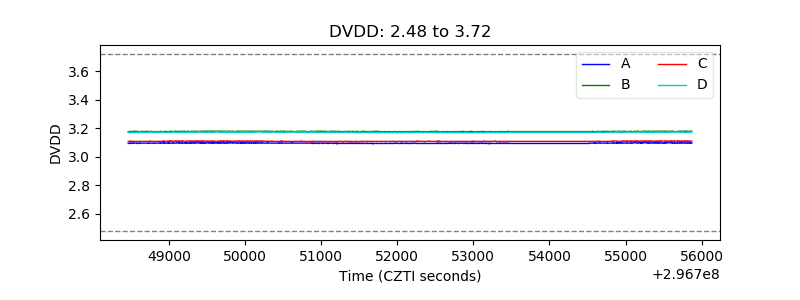 |
| Temperature 1 | 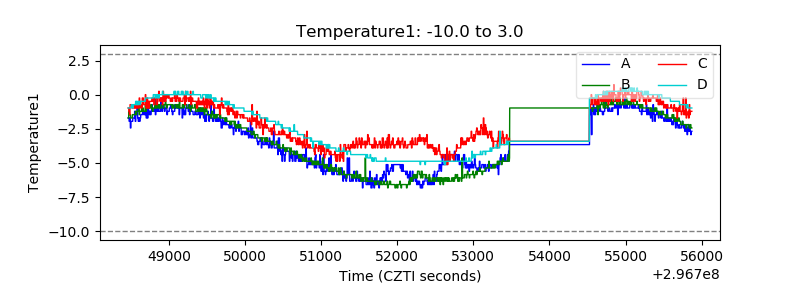 |
| Veto HV Monitor | 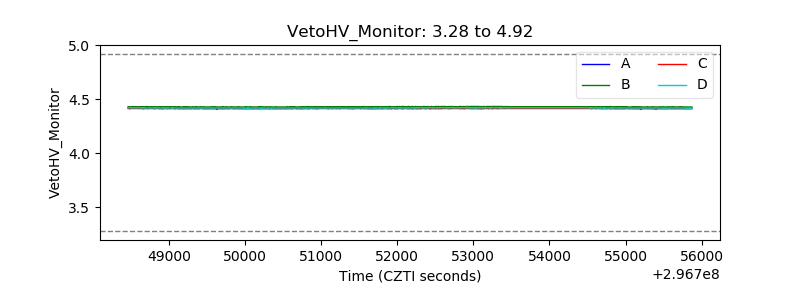 |
| Veto LLD | 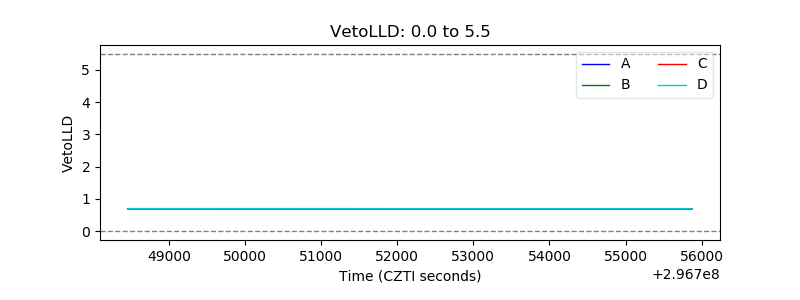 |
| Alpha Counter | 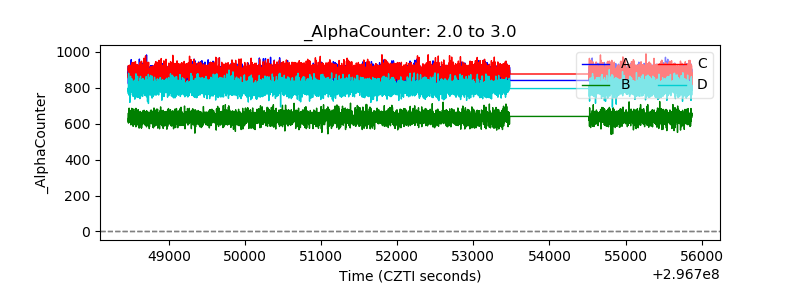 |
| _CPM_Rate | 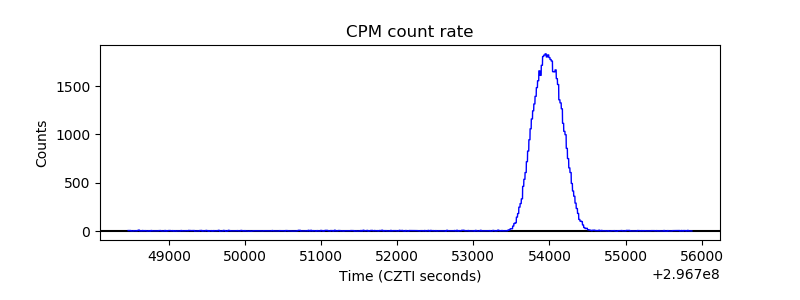 |
| CZT Counter | 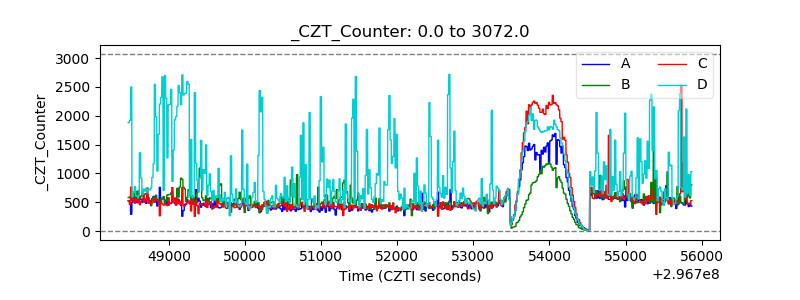 |
| +2.5 Volts monitor |  |
| +5 Volts monitor |  |
| _ROLL_ROT | 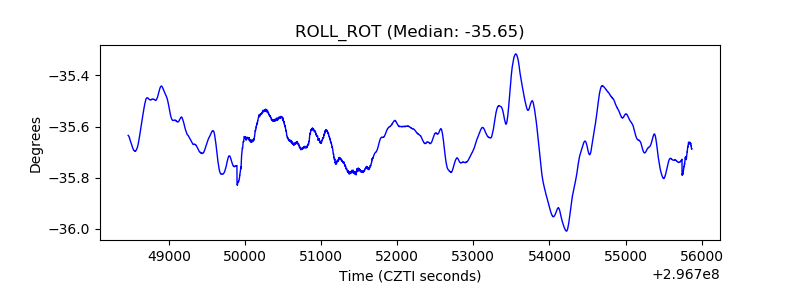 |
| _Roll_DEC | 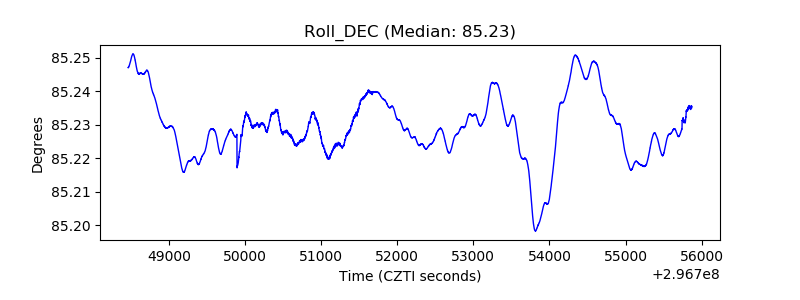 |
| _Roll_RA | 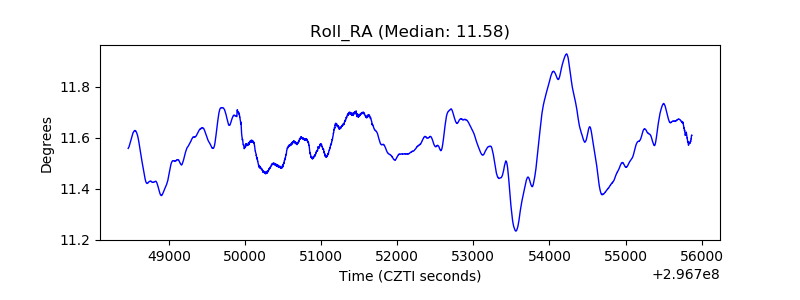 |
| Veto Counter | 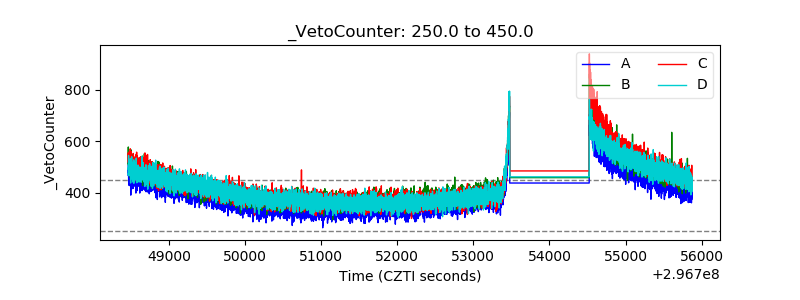 |