| Param | Original file | Final file |
|---|---|---|
| Filename | modeM0/AS1C04_009T06_9000002960_19813cztM0_level2.evt | modeM0/AS1C04_009T06_9000002960_19813cztM0_level2_quad_clean.evt |
| Size (bytes) | 463,645,440 | 114,739,200 |
| Size | 442.2 MB | 109.4 MB |
| Events in quadrant A | 2,714,100 | 781,972 |
| Events in quadrant B | 2,973,116 | 792,410 |
| Events in quadrant C | 2,883,619 | 777,164 |
| Events in quadrant D | 5,079,828 | 721,024 |
| Mode SS | |||
|---|---|---|---|
| Quadrant | BADHDUFLAG | Total packets | Discarded packets |
| A | 0 | 116 | 0 |
| B | 0 | 116 | 0 |
| C | 0 | 116 | 0 |
| D | 0 | 116 | 0 |
| Mode M9 | |||
|---|---|---|---|
| Quadrant | BADHDUFLAG | Total packets | Discarded packets |
| A | 0 | 12 | 0 |
| B | 0 | 12 | 0 |
| C | 0 | 12 | 0 |
| D | 0 | 12 | 0 |
| Mode M0 | |||
|---|---|---|---|
| Quadrant | BADHDUFLAG | Total packets | Discarded packets |
| A | 0 | 12048 | 1 |
| B | 0 | 12784 | 1 |
| C | 0 | 12475 | 1 |
| D | 0 | 19070 | 1 |
| Quadrant | Total seconds | Saturated seconds | Saturation percentage |
|---|---|---|---|
| A | 5759 | 47 | 0.816114% |
| B | 5760 | 77 | 1.336806% |
| C | 5760 | 89 | 1.545139% |
| D | 5760 | 536 | 9.305556% |
Noise dominated data is calculated using 1-second bins in cleaned event files. If a bin has >2000 counts, and if more than 50% of those come from <1% of pixels, then it is considered to be noise-dominated and hence unusable.
| Quadrant | # 1 sec bins | Bins with >0 counts | Bins with >2000 counts | High rate bins dominated by noise | Noise dominated (total time) | Noise dominated (detector-on time) | Marked lightcurve |
|---|---|---|---|---|---|---|---|
| A | 6934 | 5759 | 1 | 1 | 0.01% | 0.02% | 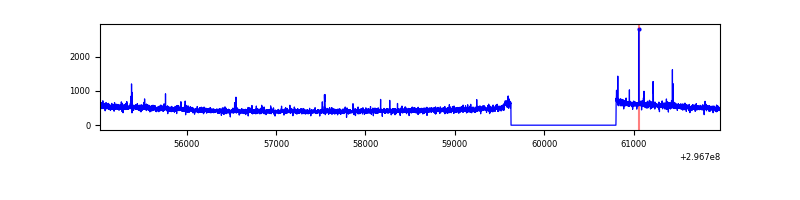 |
| B | 6935 | 5760 | 21 | 21 | 0.30% | 0.36% | 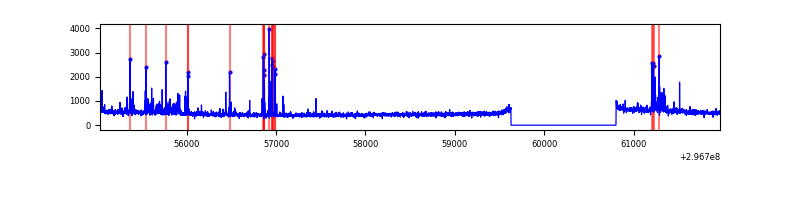 |
| C | 6935 | 5760 | 6 | 6 | 0.09% | 0.10% | 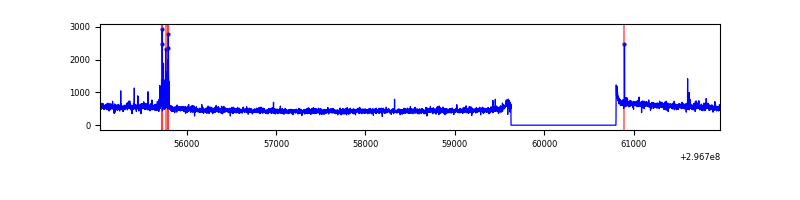 |
| D | 6934 | 5759 | 369 | 369 | 5.32% | 6.41% | 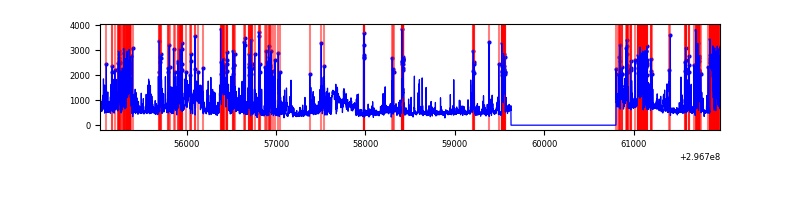 |
Top three noisy pixels from each quadrant. If the there are fewer than three noisy pixels in the level2.evt file, extra rows are filled as -1
| Pixel properties | Quadrant properties | ||||||
|---|---|---|---|---|---|---|---|
| Quadrant | DetID | PixID | Counts | Sigma | Mean | Median | Sigma |
| A | 5 | 16 | 17254 | 117.88 | 698 | 684 | 140.6 |
| A | 6 | 12 | 7328 | 47.27 | 698 | 684 | 140.6 |
| A | 0 | 226 | 6151 | 38.89 | 698 | 684 | 140.6 |
| B | 0 | 197 | 131787 | 1018.08 | 699 | 683 | 128.8 |
| B | 7 | 220 | 52014 | 398.61 | 699 | 683 | 128.8 |
| B | 0 | 228 | 25899 | 195.81 | 699 | 683 | 128.8 |
| C | 14 | 238 | 106051 | 665.56 | 684 | 689 | 158.3 |
| C | 0 | 207 | 66364 | 414.86 | 684 | 689 | 158.3 |
| C | 3 | 233 | 41654 | 258.77 | 684 | 689 | 158.3 |
| D | 1 | 52 | 1333305 | 8270.73 | 666 | 647 | 161.1 |
| D | 12 | 233 | 303719 | 1880.92 | 666 | 647 | 161.1 |
| D | 7 | 38 | 301564 | 1867.55 | 666 | 647 | 161.1 |
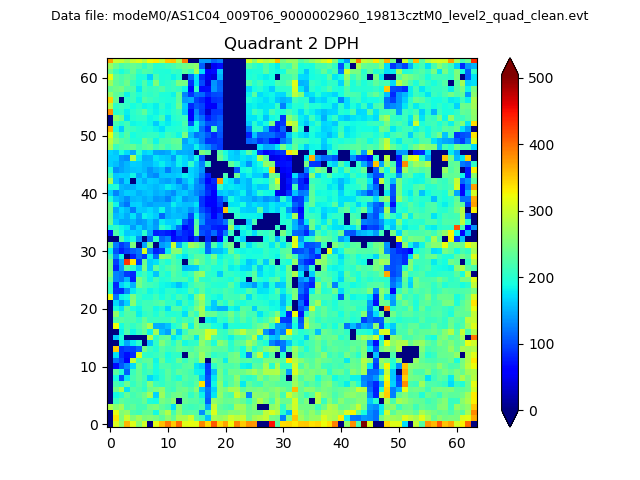
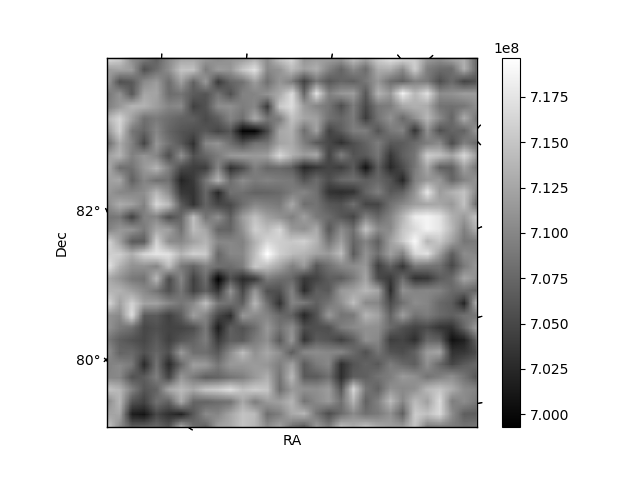
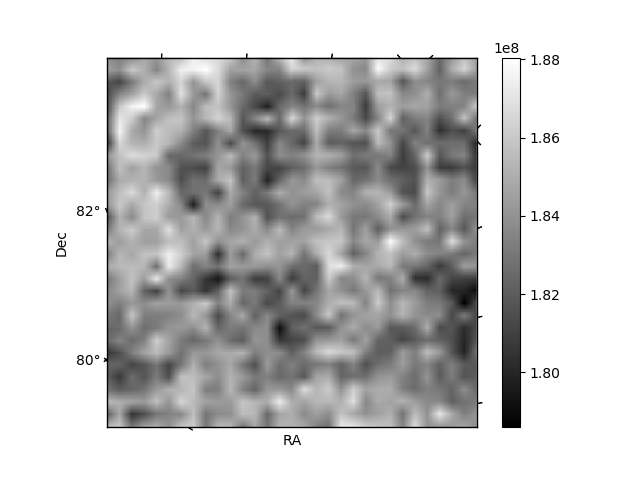
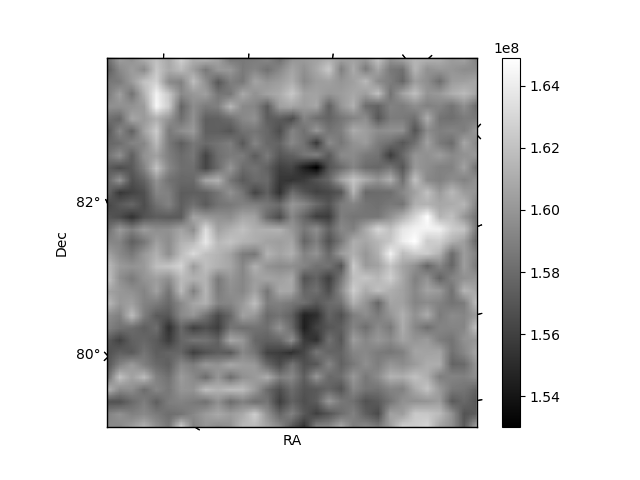
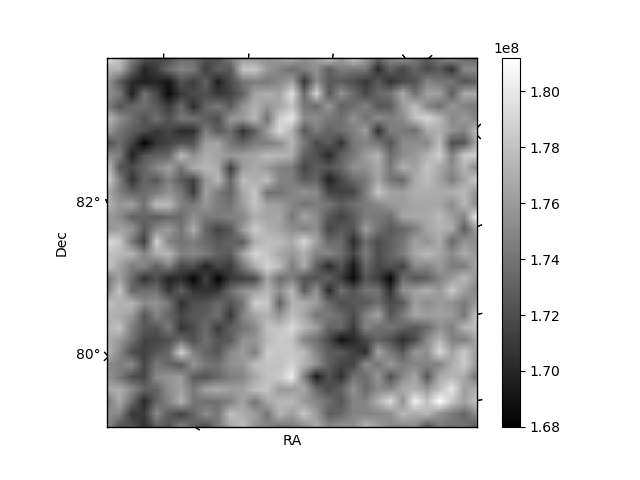
Histogram calculated using DETX and DETY for each event in the final _common_clean file
| Quadrant A | 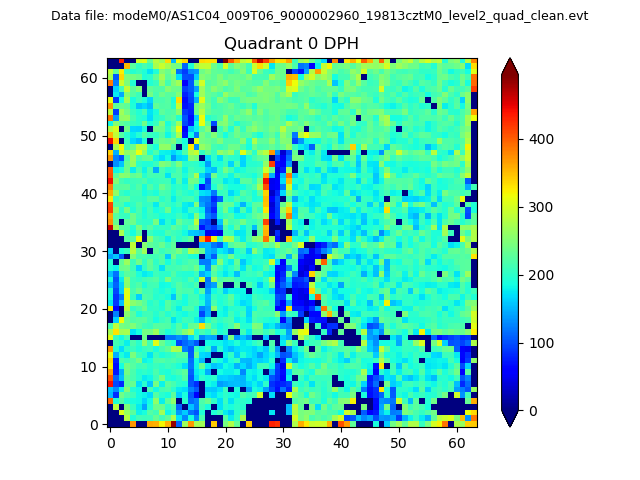 |
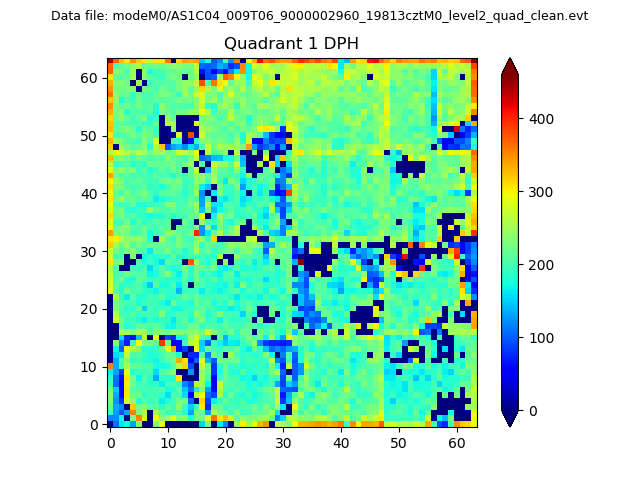 |
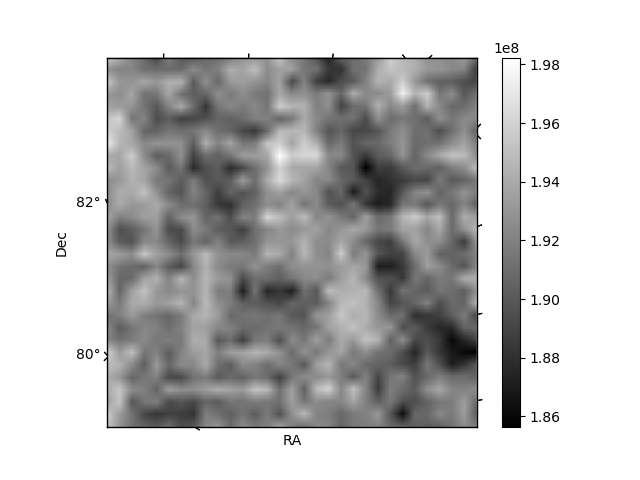
Quadrant B |
|---|---|---|---|
| Quadrant D | 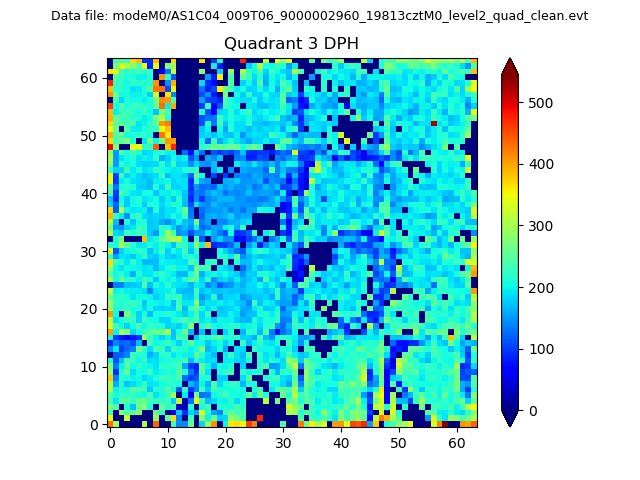 |
 |
Quadrant C |
| Plot type | Count rate plots | Images |
|---|---|---|
| Comparison with Poisson distribution Blue bars denote a histogram of data divided into 1 sec bins. Red curve is a Poisson curve with rate = median count rate of data. |
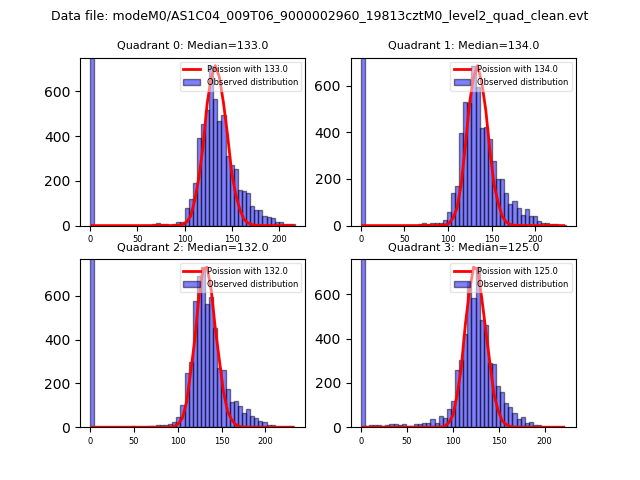 |
 |
| Quadrant-wise count rates Data is divided into 100 sec bins |
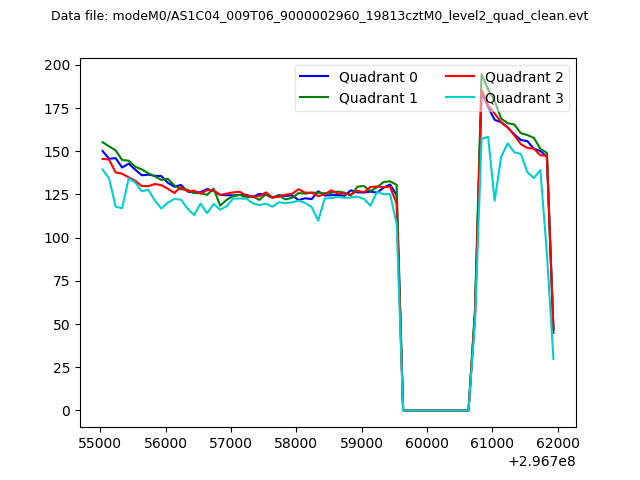 |
|
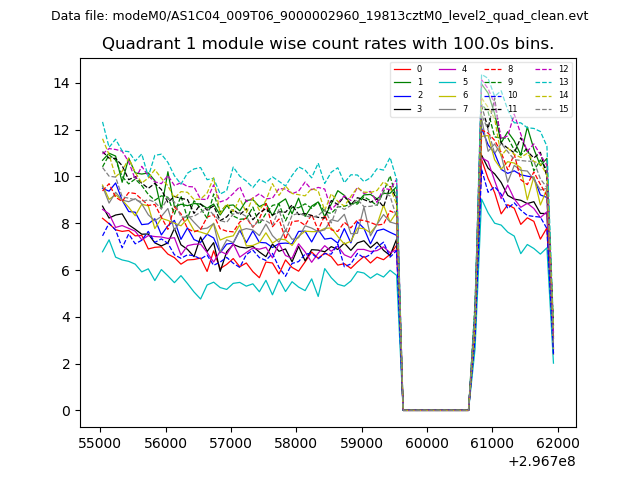
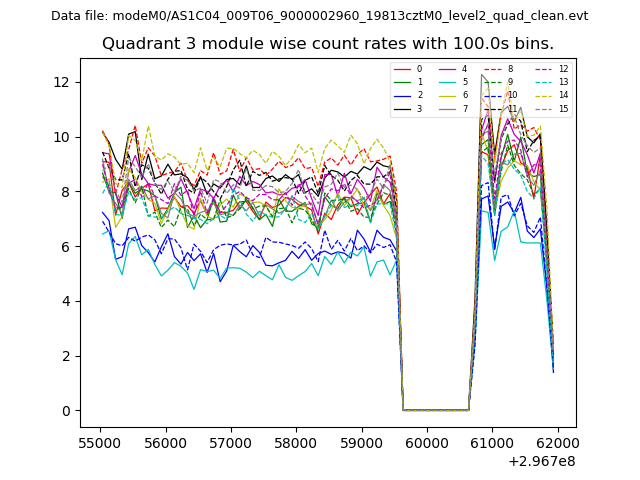
| Module-wise count rates for Quadrant A Data is divided into 100 sec bins |
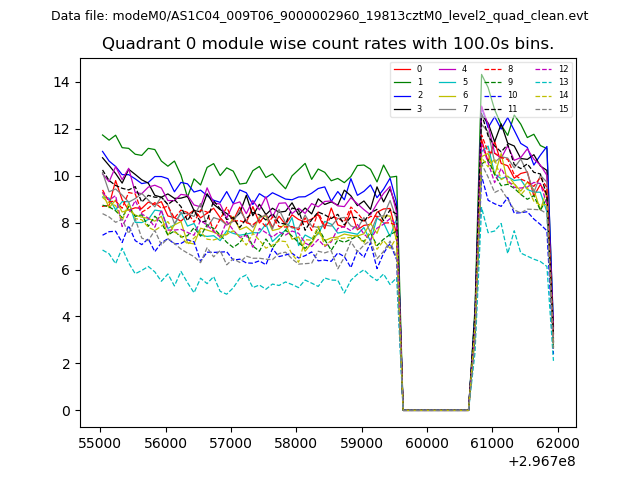 |
 |
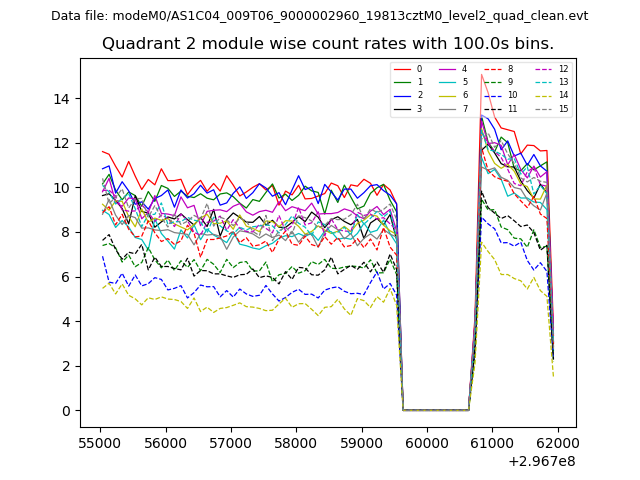
| Module-wise count rates for Quadrant B Data is divided into 100 sec bins |
 |
 |
| Module-wise count rates for Quadrant C Data is divided into 100 sec bins |
 |
 |
| Module-wise count rates for Quadrant D Data is divided into 100 sec bins |
 |
 |
| Parameter | Plot |
|---|---|
| CZT HV Monitor |  |
| D_VDD | 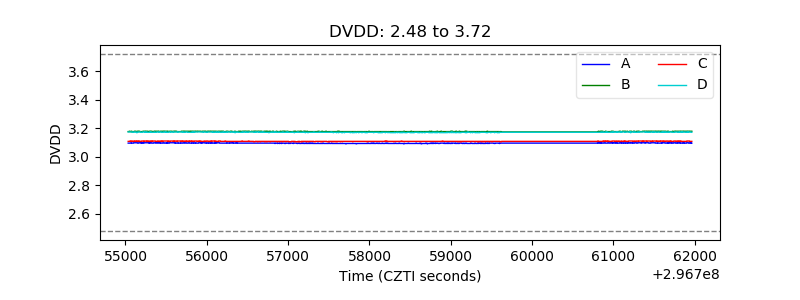 |
| Temperature 1 | 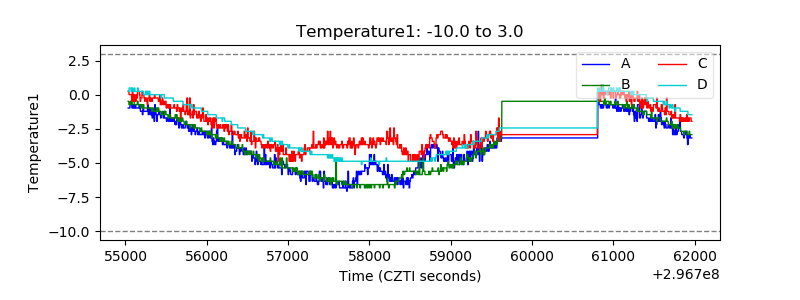 |
| Veto HV Monitor | 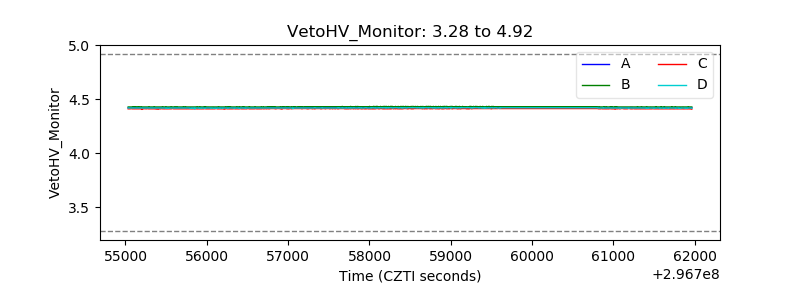 |
| Veto LLD | 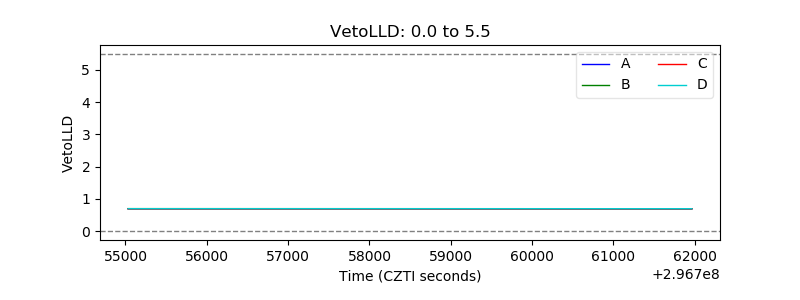 |
| Alpha Counter | 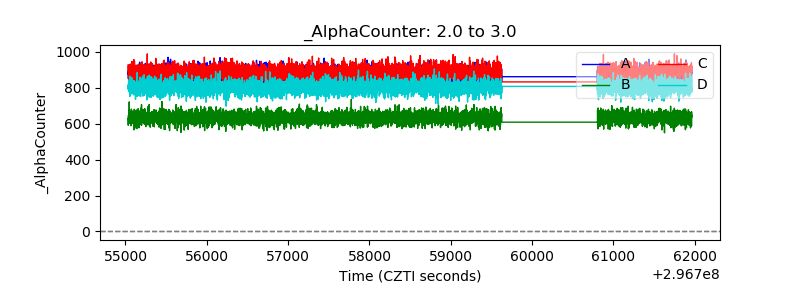 |
| _CPM_Rate | 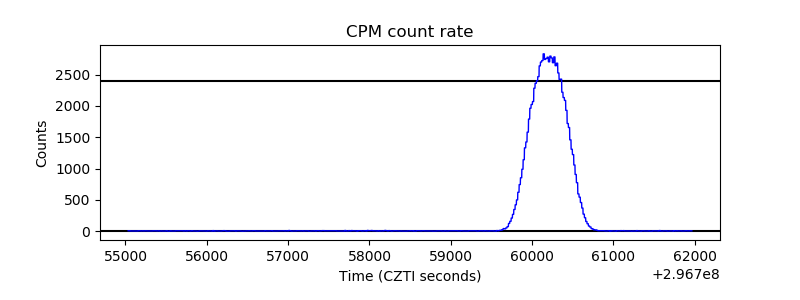 |
| CZT Counter | 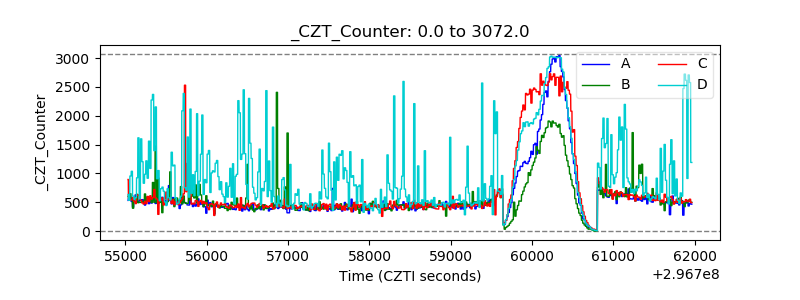 |
| +2.5 Volts monitor |  |
| +5 Volts monitor |  |
| _ROLL_ROT | 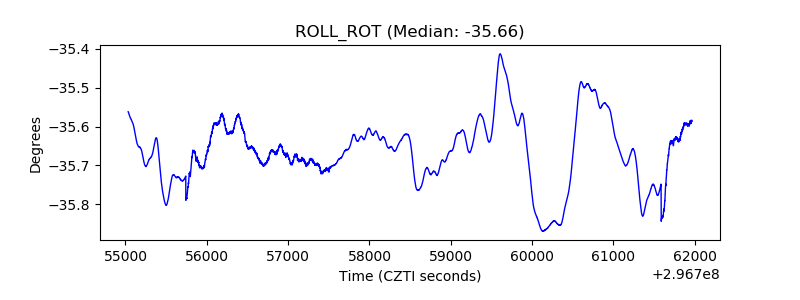 |
| _Roll_DEC | 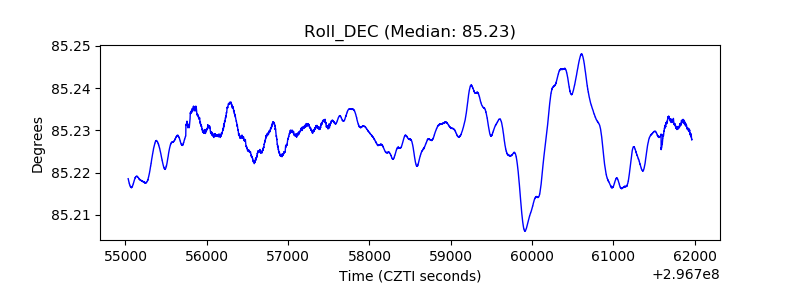 |
| _Roll_RA | 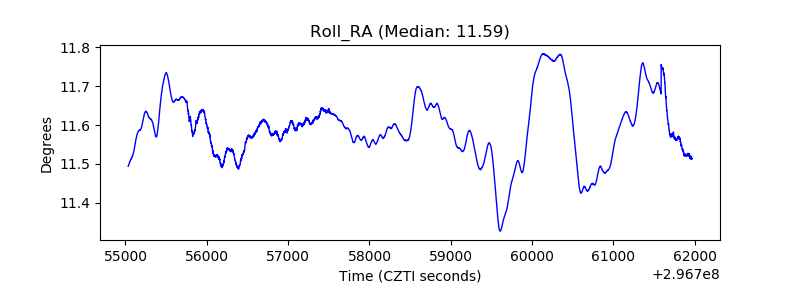 |
| Veto Counter | 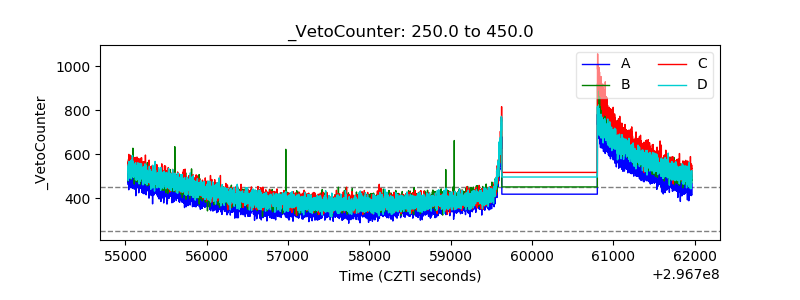 |