| Param | Original file | Final file |
|---|---|---|
| Filename | modeM0/AS1C04_009T06_9000002960_19814cztM0_level2.evt | modeM0/AS1C04_009T06_9000002960_19814cztM0_level2_quad_clean.evt |
| Size (bytes) | 549,682,560 | 125,663,040 |
| Size | 524.2 MB | 119.8 MB |
| Events in quadrant A | 3,811,142 | 824,993 |
| Events in quadrant B | 3,460,899 | 884,605 |
| Events in quadrant C | 3,091,532 | 876,385 |
| Events in quadrant D | 5,869,996 | 793,638 |
| Mode SS | |||
|---|---|---|---|
| Quadrant | BADHDUFLAG | Total packets | Discarded packets |
| A | 0 | 124 | 0 |
| B | 0 | 124 | 0 |
| C | 0 | 124 | 0 |
| D | 0 | 124 | 0 |
| Mode M9 | |||
|---|---|---|---|
| Quadrant | BADHDUFLAG | Total packets | Discarded packets |
| A | 0 | 13 | 0 |
| B | 0 | 13 | 0 |
| C | 0 | 13 | 0 |
| D | 0 | 13 | 0 |
| Mode M0 | |||
|---|---|---|---|
| Quadrant | BADHDUFLAG | Total packets | Discarded packets |
| A | 0 | 15511 | 1 |
| B | 0 | 14398 | 1 |
| C | 0 | 13298 | 1 |
| D | 0 | 21625 | 3 |
| Quadrant | Total seconds | Saturated seconds | Saturation percentage |
|---|---|---|---|
| A | 6099 | 505 | 8.280046% |
| B | 6100 | 165 | 2.704918% |
| C | 6100 | 91 | 1.491803% |
| D | 6099 | 751 | 12.313494% |
Noise dominated data is calculated using 1-second bins in cleaned event files. If a bin has >2000 counts, and if more than 50% of those come from <1% of pixels, then it is considered to be noise-dominated and hence unusable.
| Quadrant | # 1 sec bins | Bins with >0 counts | Bins with >2000 counts | High rate bins dominated by noise | Noise dominated (total time) | Noise dominated (detector-on time) | Marked lightcurve |
|---|---|---|---|---|---|---|---|
| A | 7373 | 6098 | 347 | 347 | 4.71% | 5.69% | 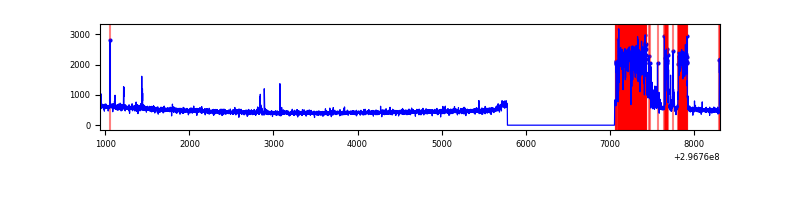 |
| B | 7375 | 6100 | 62 | 62 | 0.84% | 1.02% | 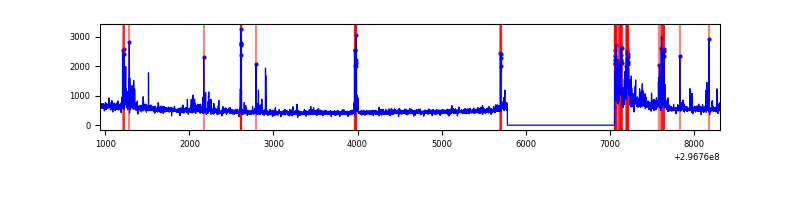 |
| C | 7375 | 6100 | 0 | 0 | 0.00% | 0.00% | 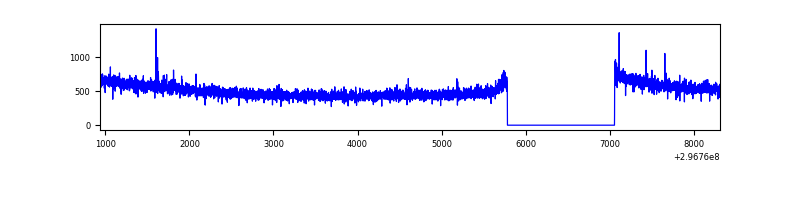 |
| D | 7373 | 6098 | 578 | 578 | 7.84% | 9.48% | 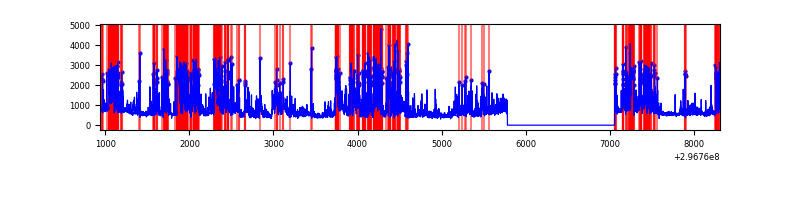 |
Top three noisy pixels from each quadrant. If the there are fewer than three noisy pixels in the level2.evt file, extra rows are filled as -1
| Pixel properties | Quadrant properties | ||||||
|---|---|---|---|---|---|---|---|
| Quadrant | DetID | PixID | Counts | Sigma | Mean | Median | Sigma |
| A | 14 | 238 | 827171 | 5638.94 | 725 | 710 | 146.6 |
| A | 14 | 254 | 153923 | 1045.37 | 725 | 710 | 146.6 |
| A | 5 | 16 | 28765 | 191.42 | 725 | 710 | 146.6 |
| B | 5 | 172 | 116682 | 825.08 | 765 | 746 | 140.5 |
| B | 10 | 245 | 114628 | 810.46 | 765 | 746 | 140.5 |
| B | 0 | 197 | 97571 | 689.07 | 765 | 746 | 140.5 |
| C | 14 | 238 | 118555 | 676.66 | 754 | 762 | 174.1 |
| C | 3 | 233 | 23418 | 130.15 | 754 | 762 | 174.1 |
| C | 0 | 207 | 7910 | 41.06 | 754 | 762 | 174.1 |
| D | 1 | 52 | 1316390 | 7552.21 | 720 | 700 | 174.2 |
| D | 12 | 33 | 494503 | 2834.48 | 720 | 700 | 174.2 |
| D | 12 | 233 | 388415 | 2225.53 | 720 | 700 | 174.2 |
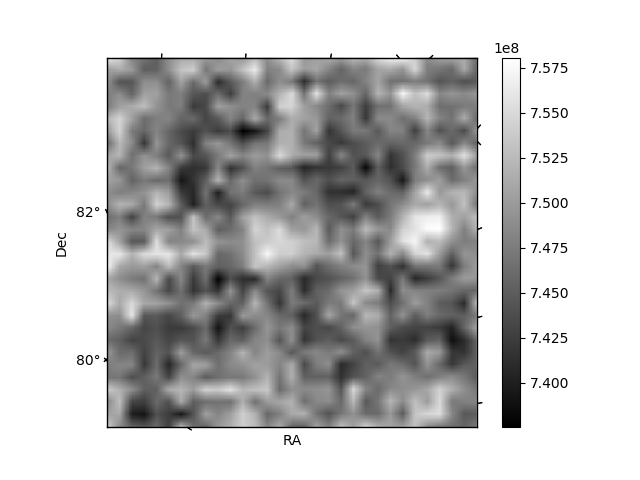
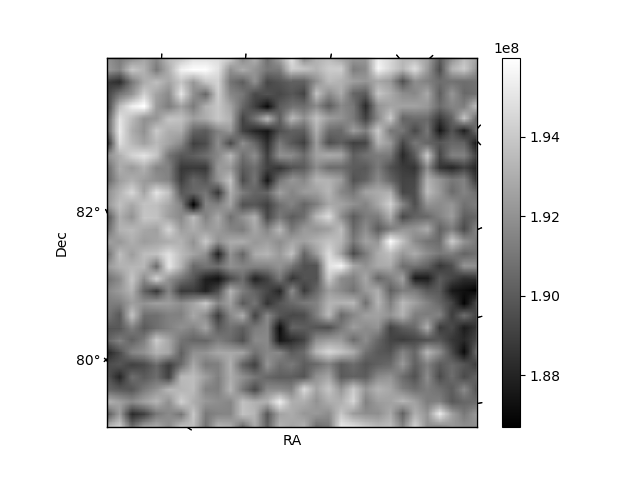
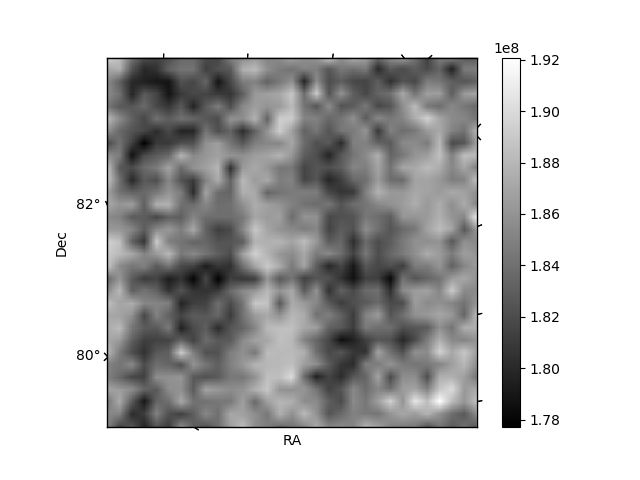
Histogram calculated using DETX and DETY for each event in the final _common_clean file
| Quadrant A | 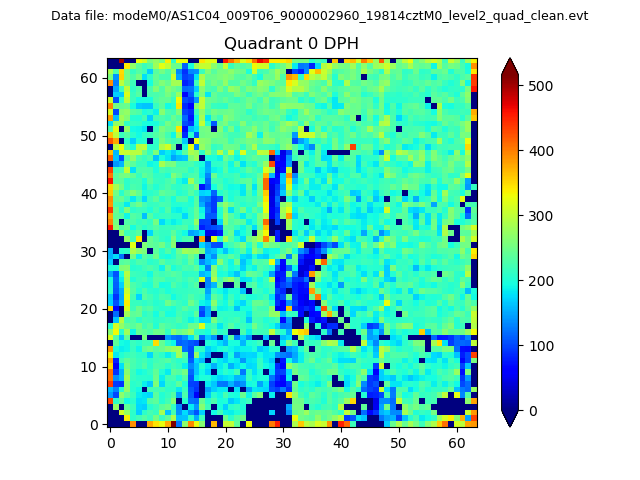 |
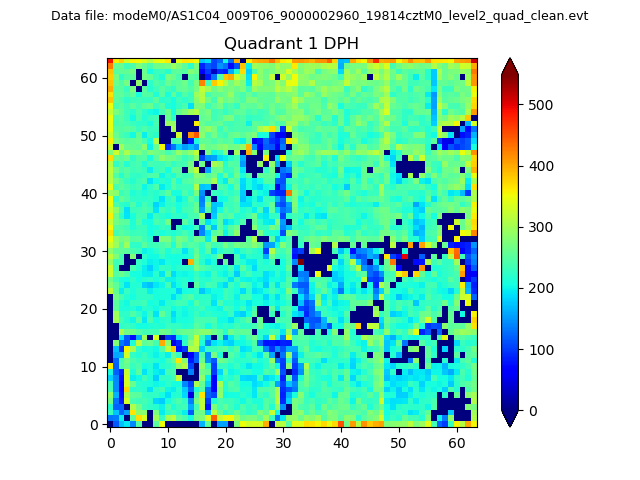 |
Quadrant B |
|---|---|---|---|
| Quadrant D | 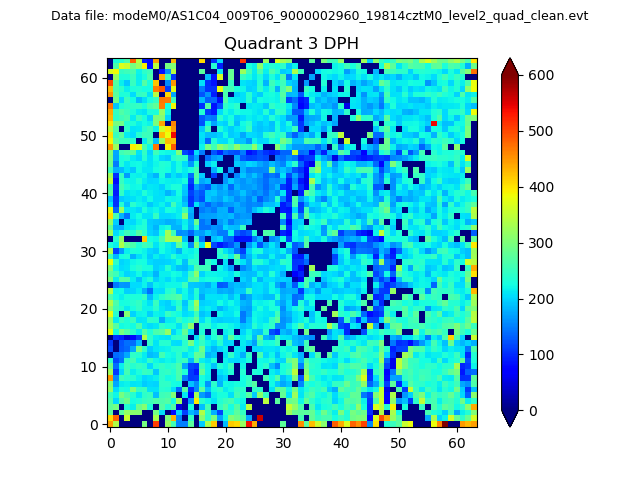 |
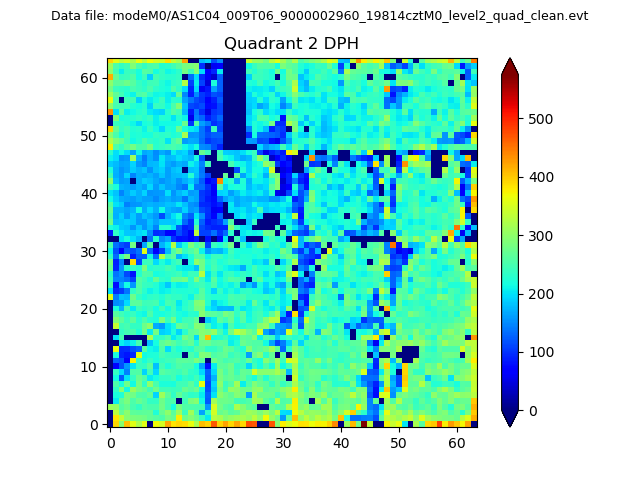 |
Quadrant C |
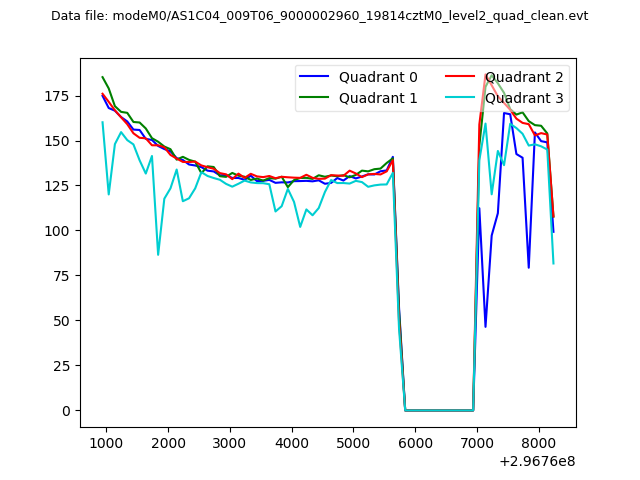
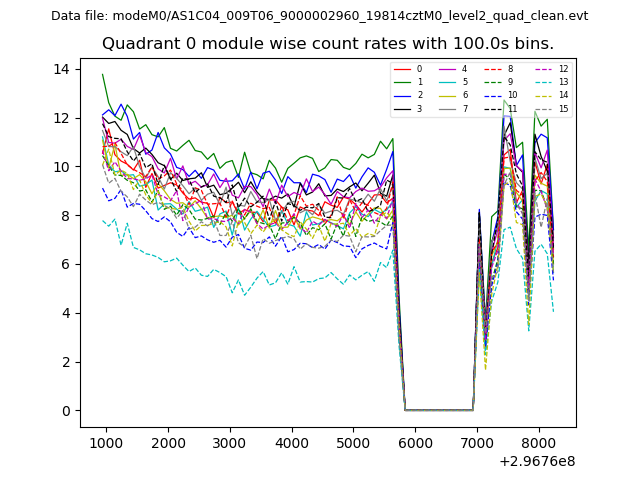
| Plot type | Count rate plots | Images |
|---|---|---|
| Comparison with Poisson distribution Blue bars denote a histogram of data divided into 1 sec bins. Red curve is a Poisson curve with rate = median count rate of data. |
 |
 |
| Quadrant-wise count rates Data is divided into 100 sec bins |
 |
|
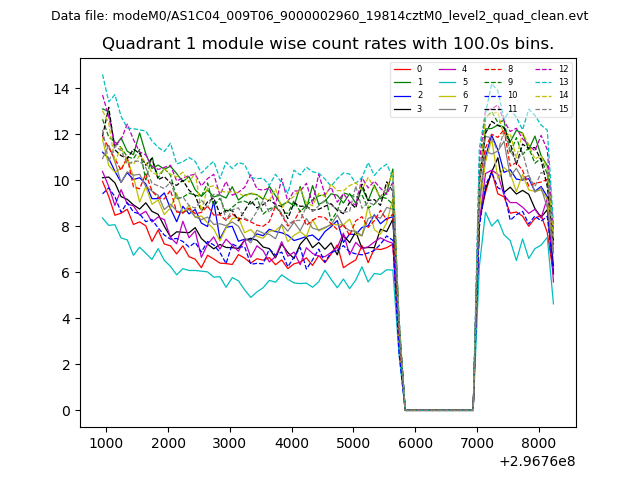
| Module-wise count rates for Quadrant A Data is divided into 100 sec bins |
 |
 |
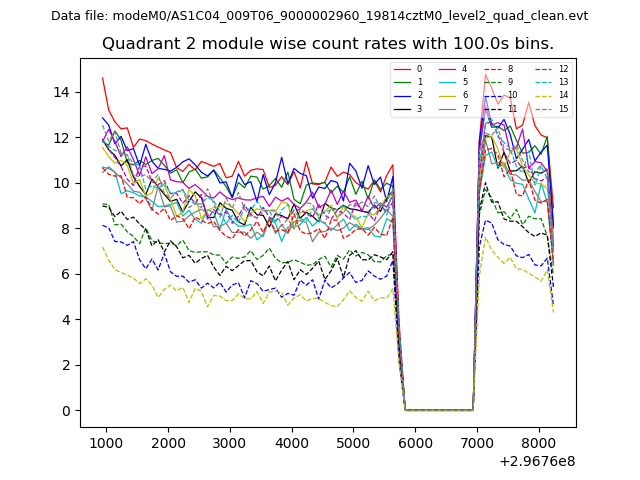
| Module-wise count rates for Quadrant B Data is divided into 100 sec bins |
 |
 |
| Module-wise count rates for Quadrant C Data is divided into 100 sec bins |
 |
 |
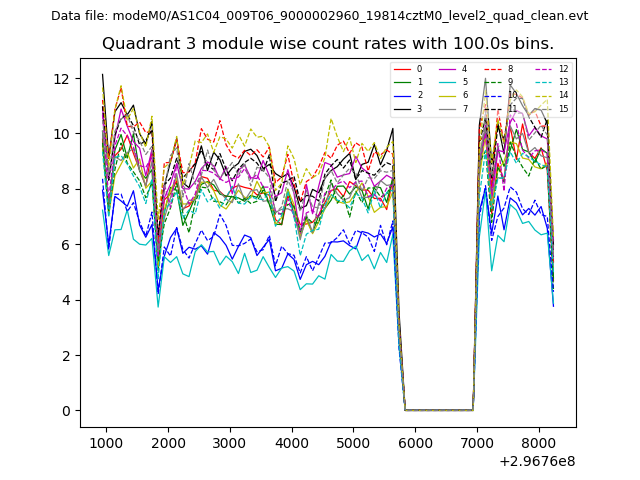
| Module-wise count rates for Quadrant D Data is divided into 100 sec bins |
 |
 |
| Parameter | Plot |
|---|---|
| CZT HV Monitor | 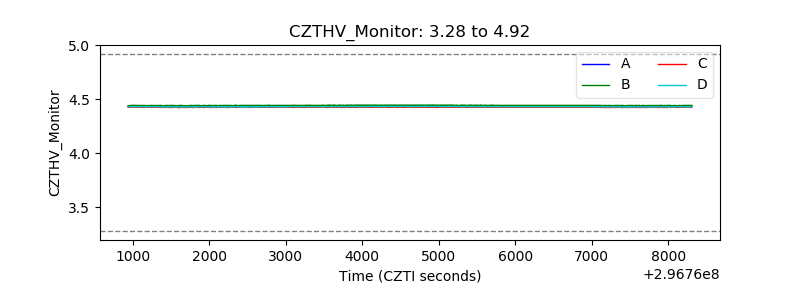 |
| D_VDD | 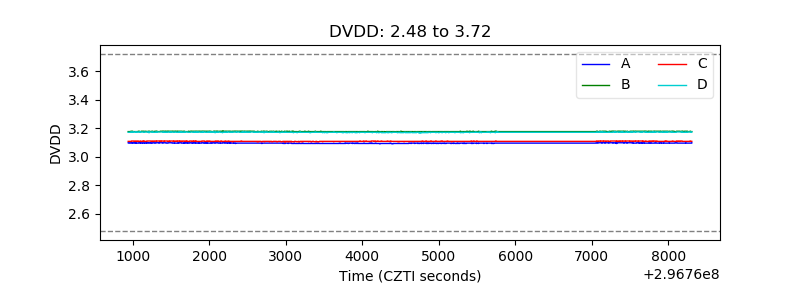 |
| Temperature 1 | 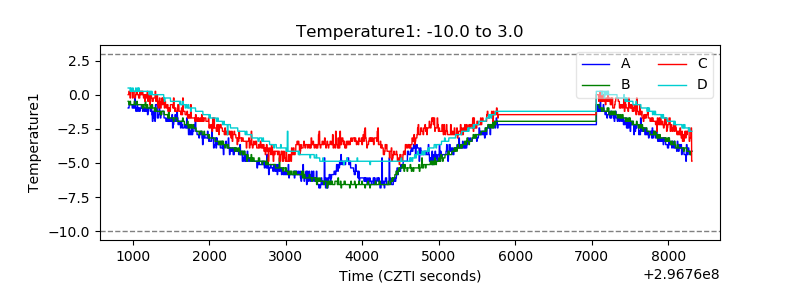 |
| Veto HV Monitor | 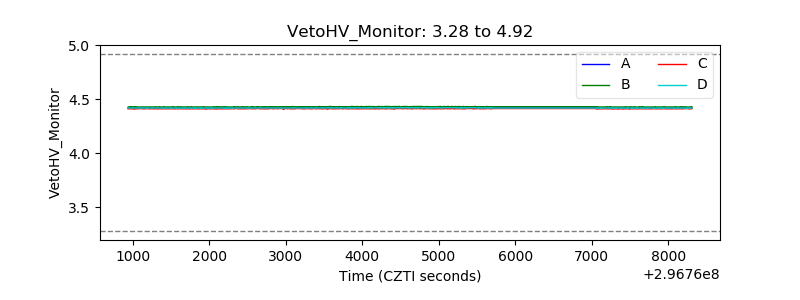 |
| Veto LLD | 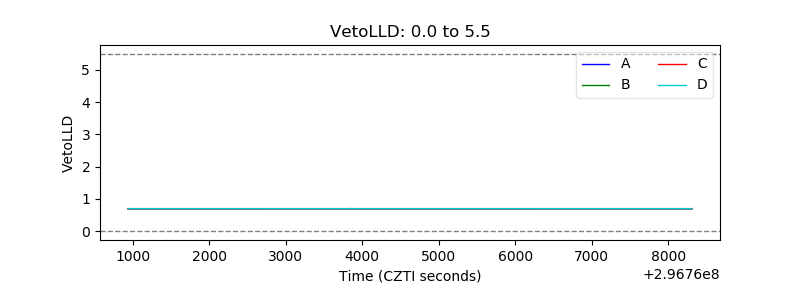 |
| Alpha Counter | 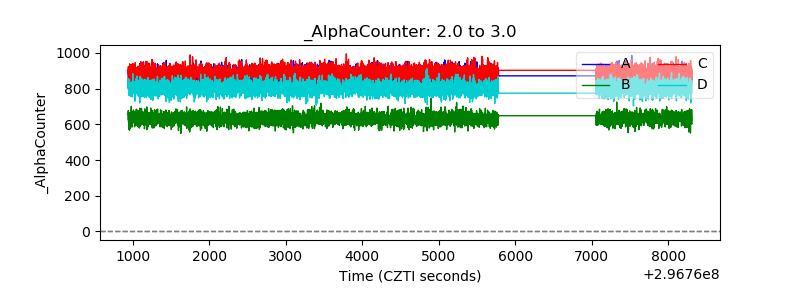 |
| _CPM_Rate | 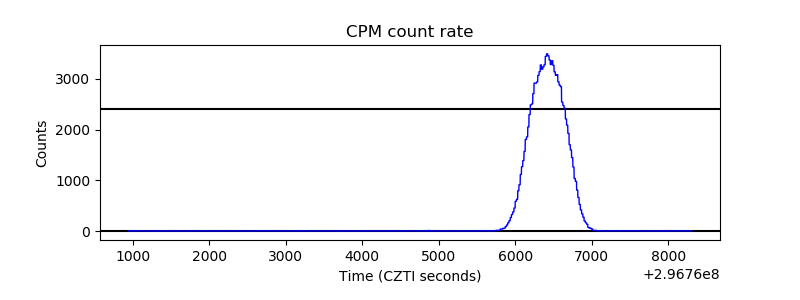 |
| CZT Counter | 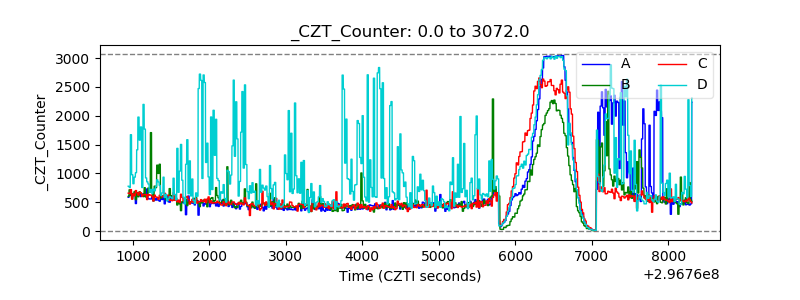 |
| +2.5 Volts monitor |  |
| +5 Volts monitor |  |
| _ROLL_ROT | 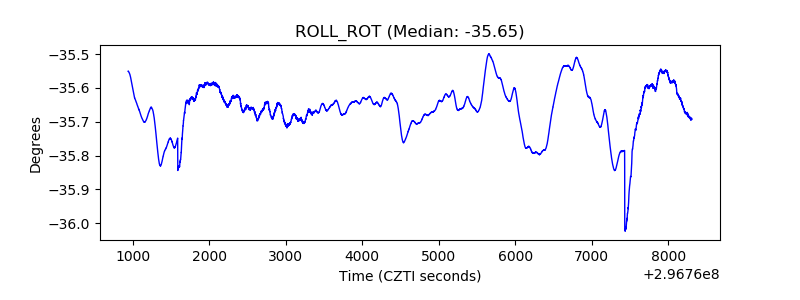 |
| _Roll_DEC | 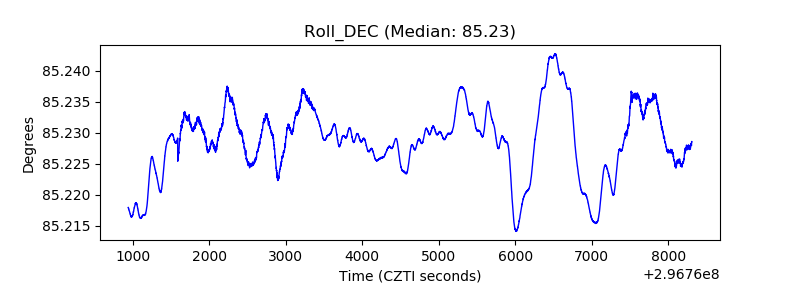 |
| _Roll_RA | 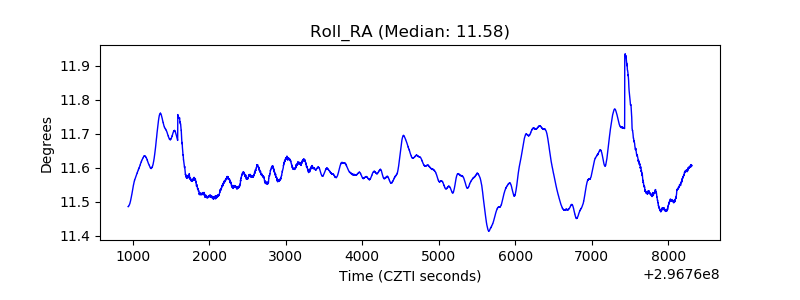 |
| Veto Counter | 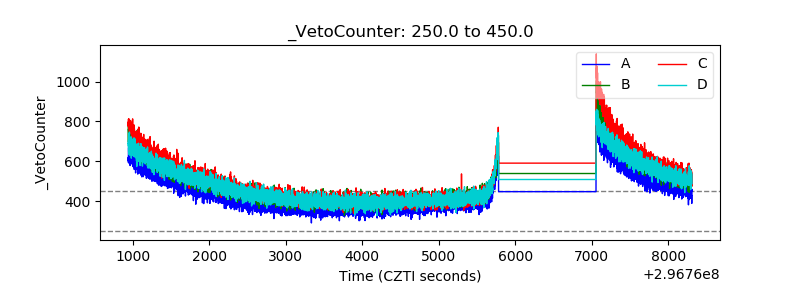 |