| Param | Original file | Final file |
|---|---|---|
| Filename | modeM0/AS1C04_009T06_9000002960_19815cztM0_level2.evt | modeM0/AS1C04_009T06_9000002960_19815cztM0_level2_quad_clean.evt |
| Size (bytes) | 658,788,480 | 127,402,560 |
| Size | 628.3 MB | 121.5 MB |
| Events in quadrant A | 4,610,906 | 827,976 |
| Events in quadrant B | 3,552,547 | 922,911 |
| Events in quadrant C | 3,188,834 | 911,608 |
| Events in quadrant D | 8,181,037 | 763,962 |
| Mode SS | |||
|---|---|---|---|
| Quadrant | BADHDUFLAG | Total packets | Discarded packets |
| A | 0 | 124 | 0 |
| B | 0 | 124 | 0 |
| C | 0 | 124 | 0 |
| D | 0 | 124 | 0 |
| Mode M9 | |||
|---|---|---|---|
| Quadrant | BADHDUFLAG | Total packets | Discarded packets |
| A | 0 | 16 | 0 |
| B | 0 | 17 | 0 |
| C | 0 | 17 | 0 |
| D | 0 | 17 | 0 |
| Mode M0 | |||
|---|---|---|---|
| Quadrant | BADHDUFLAG | Total packets | Discarded packets |
| A | 0 | 17804 | 2 |
| B | 0 | 14642 | 2 |
| C | 0 | 13574 | 2 |
| D | 0 | 28507 | 2 |
| Quadrant | Total seconds | Saturated seconds | Saturation percentage |
|---|---|---|---|
| A | 6180 | 794 | 12.847896% |
| B | 6180 | 171 | 2.766990% |
| C | 6180 | 131 | 2.119741% |
| D | 6180 | 1796 | 29.061489% |
Noise dominated data is calculated using 1-second bins in cleaned event files. If a bin has >2000 counts, and if more than 50% of those come from <1% of pixels, then it is considered to be noise-dominated and hence unusable.
| Quadrant | # 1 sec bins | Bins with >0 counts | Bins with >2000 counts | High rate bins dominated by noise | Noise dominated (total time) | Noise dominated (detector-on time) | Marked lightcurve |
|---|---|---|---|---|---|---|---|
| A | 7520 | 6181 | 573 | 573 | 7.62% | 9.27% | 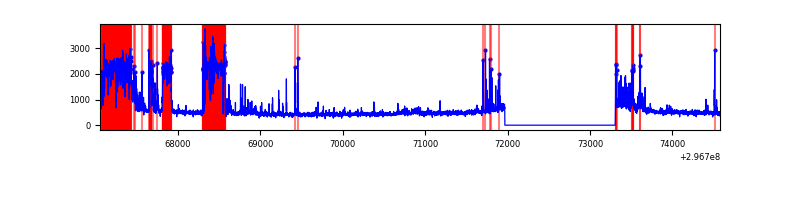 |
| B | 7520 | 6180 | 53 | 53 | 0.70% | 0.86% | 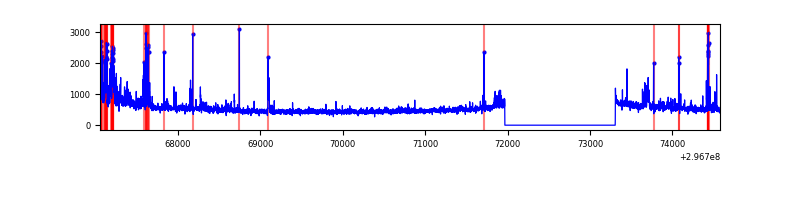 |
| C | 7520 | 6180 | 1 | 1 | 0.01% | 0.02% | 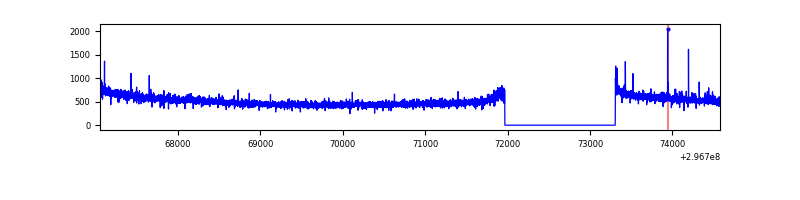 |
| D | 7520 | 6180 | 1667 | 1667 | 22.17% | 26.97% | 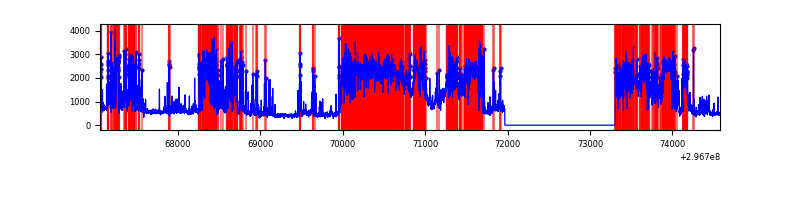 |
Top three noisy pixels from each quadrant. If the there are fewer than three noisy pixels in the level2.evt file, extra rows are filled as -1
| Pixel properties | Quadrant properties | ||||||
|---|---|---|---|---|---|---|---|
| Quadrant | DetID | PixID | Counts | Sigma | Mean | Median | Sigma |
| A | 14 | 238 | 1408630 | 9647.94 | 725 | 710 | 145.9 |
| A | 14 | 254 | 274335 | 1875.05 | 725 | 710 | 145.9 |
| A | 5 | 16 | 88104 | 598.88 | 725 | 710 | 145.9 |
| B | 5 | 172 | 109893 | 758.01 | 787 | 767 | 144.0 |
| B | 10 | 245 | 84497 | 581.6 | 787 | 767 | 144.0 |
| B | 0 | 190 | 50836 | 347.79 | 787 | 767 | 144.0 |
| C | 14 | 238 | 122257 | 681.74 | 775 | 783 | 178.2 |
| C | 3 | 233 | 18985 | 102.15 | 775 | 783 | 178.2 |
| C | 5 | 112 | 13900 | 73.62 | 775 | 783 | 178.2 |
| D | 12 | 33 | 2718627 | 16108.29 | 698 | 679 | 168.7 |
| D | 7 | 38 | 1136621 | 6732.31 | 698 | 679 | 168.7 |
| D | 1 | 52 | 759288 | 4496.0 | 698 | 679 | 168.7 |
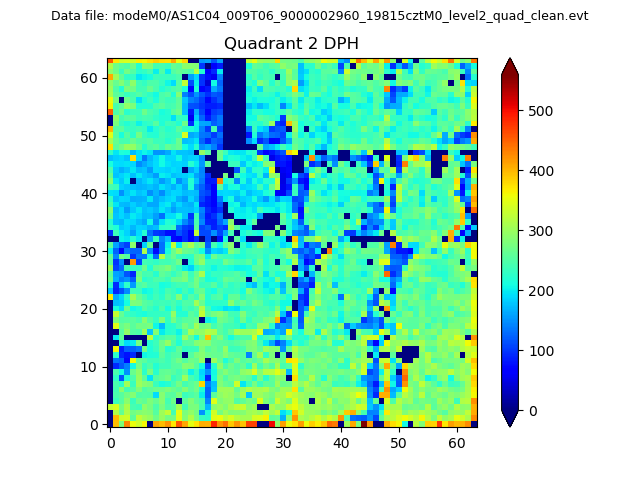
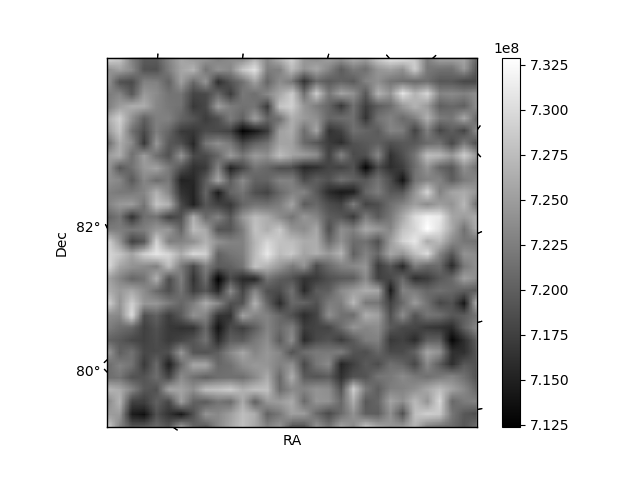
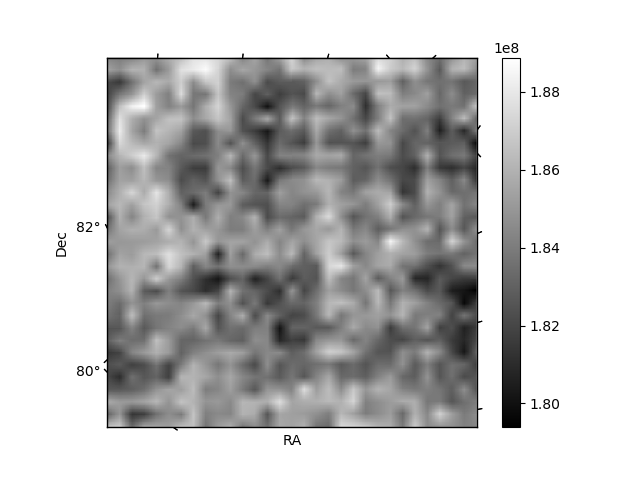
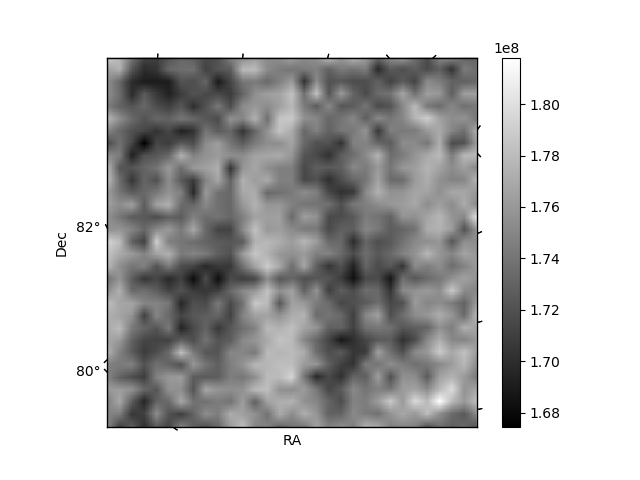
Histogram calculated using DETX and DETY for each event in the final _common_clean file
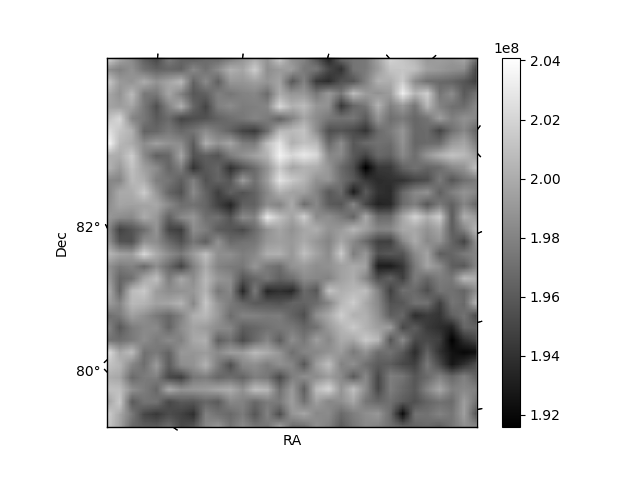
| Quadrant A | 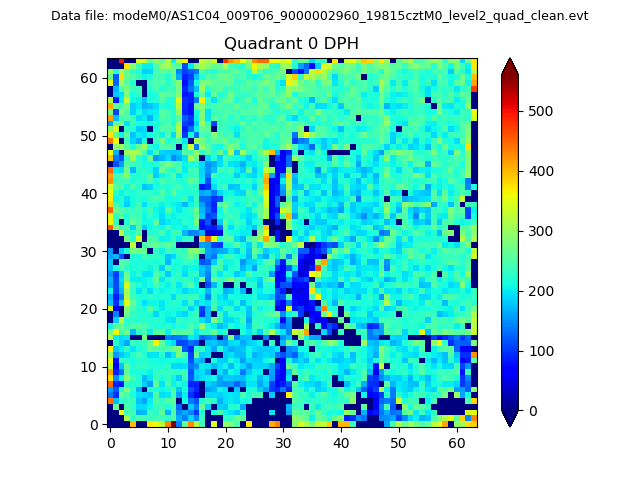 |
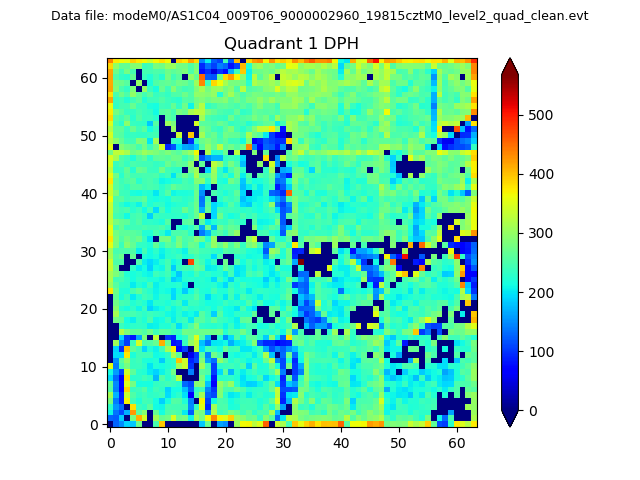 |
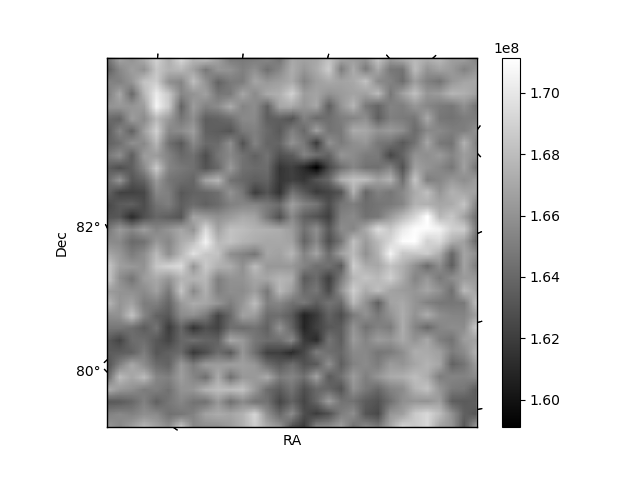
Quadrant B |
|---|---|---|---|
| Quadrant D | 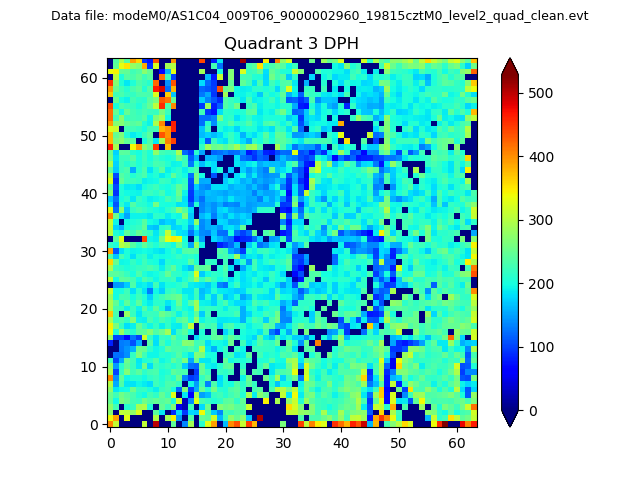 |
 |
Quadrant C |
| Plot type | Count rate plots | Images |
|---|---|---|
| Comparison with Poisson distribution Blue bars denote a histogram of data divided into 1 sec bins. Red curve is a Poisson curve with rate = median count rate of data. |
 |
 |
| Quadrant-wise count rates Data is divided into 100 sec bins |
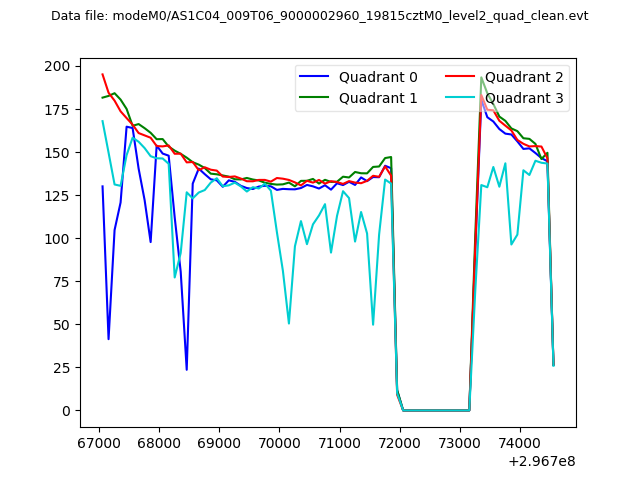 |
|
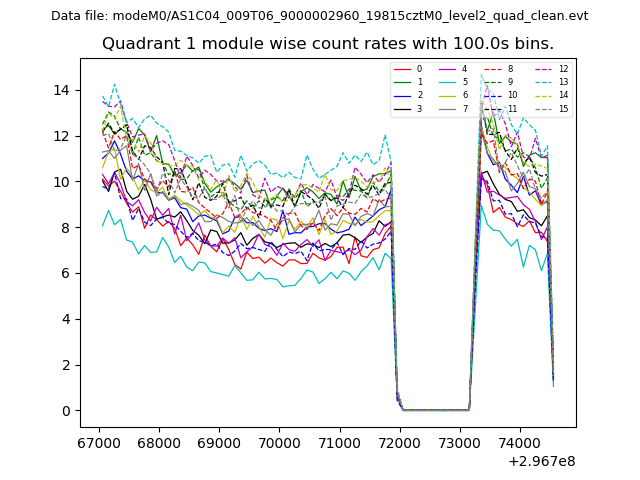
| Module-wise count rates for Quadrant A Data is divided into 100 sec bins |
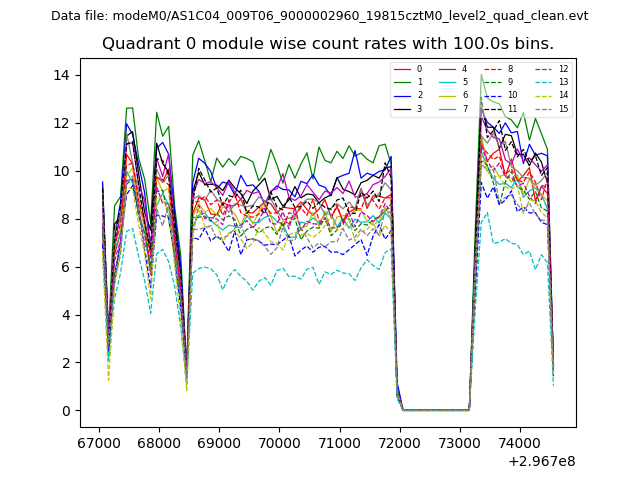 |
 |
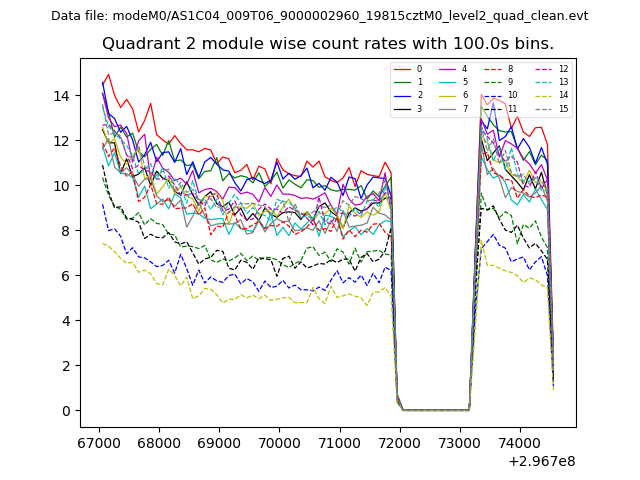
| Module-wise count rates for Quadrant B Data is divided into 100 sec bins |
 |
 |
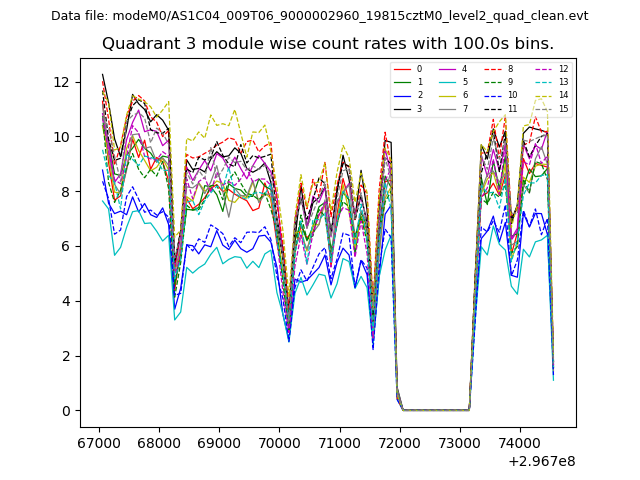
| Module-wise count rates for Quadrant C Data is divided into 100 sec bins |
 |
 |
| Module-wise count rates for Quadrant D Data is divided into 100 sec bins |
 |
 |
| Parameter | Plot |
|---|---|
| CZT HV Monitor | 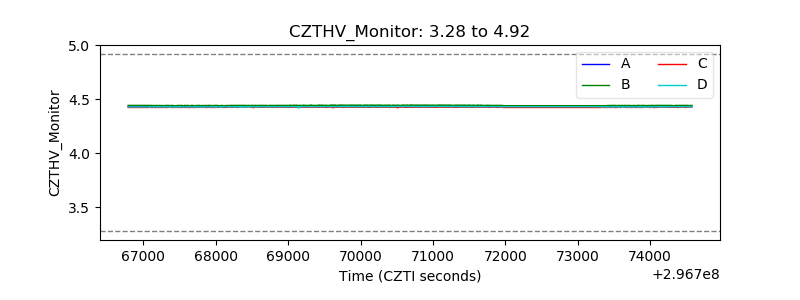 |
| D_VDD | 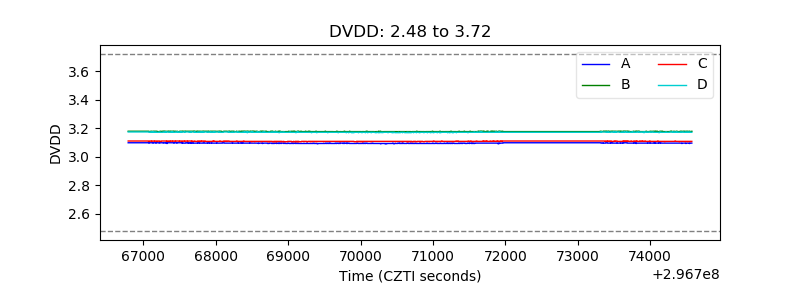 |
| Temperature 1 | 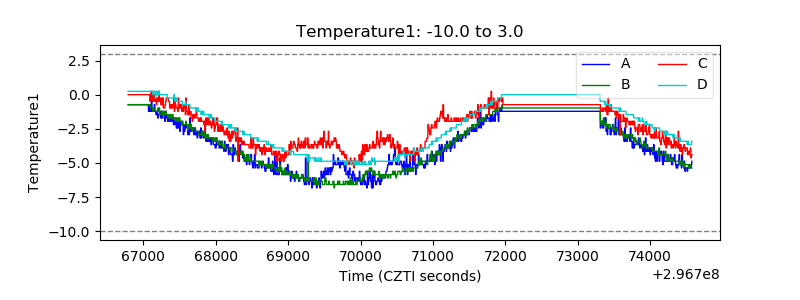 |
| Veto HV Monitor | 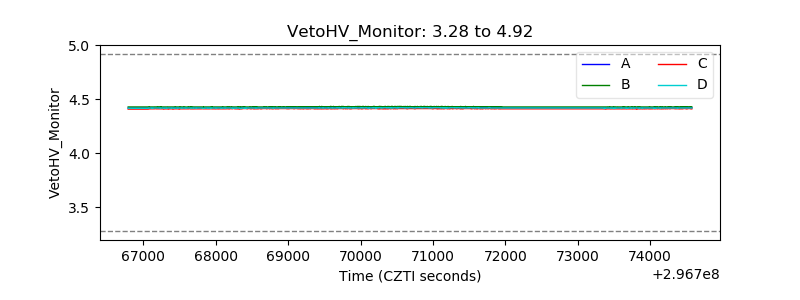 |
| Veto LLD | 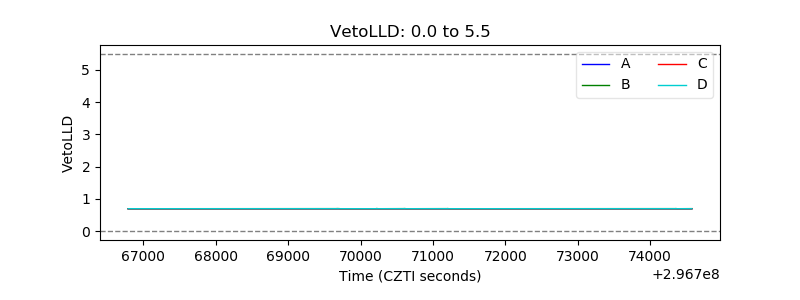 |
| Alpha Counter | 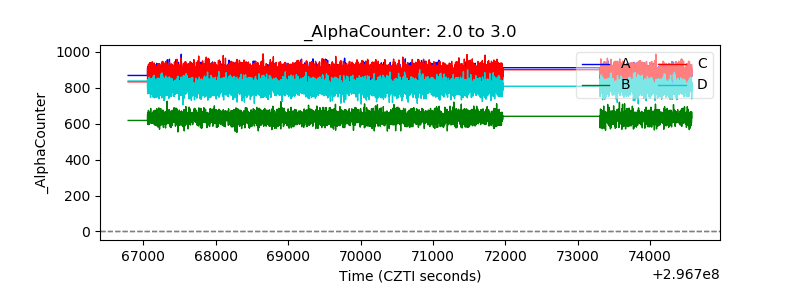 |
| _CPM_Rate | 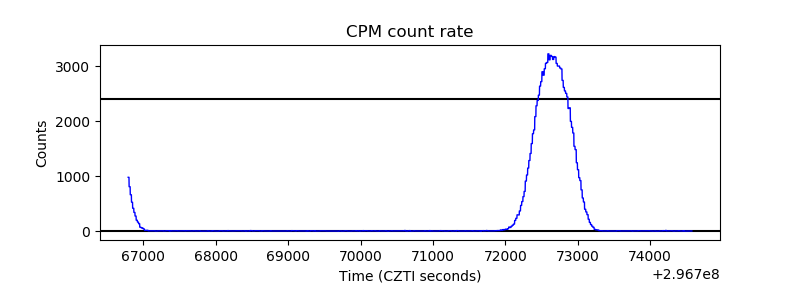 |
| CZT Counter | 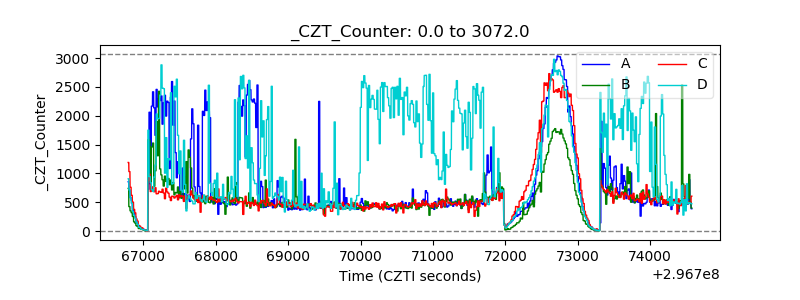 |
| +2.5 Volts monitor |  |
| +5 Volts monitor |  |
| _ROLL_ROT | 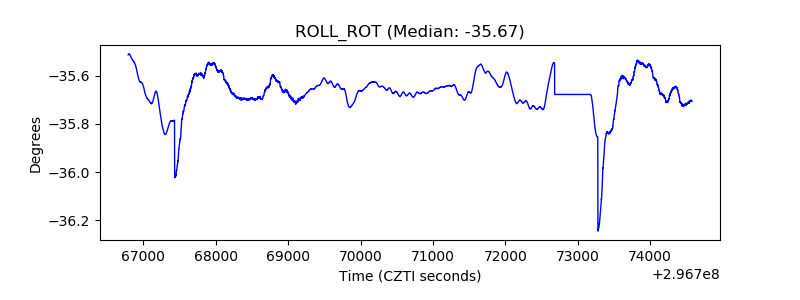 |
| _Roll_DEC | 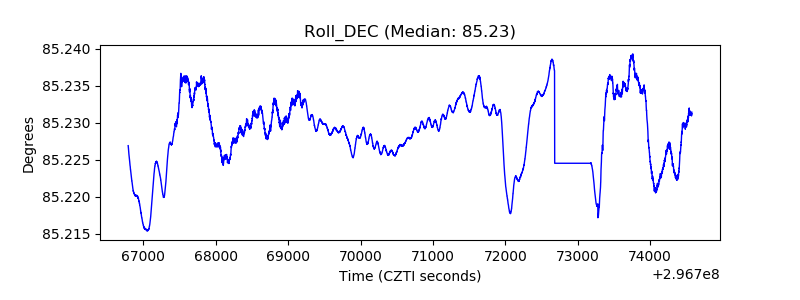 |
| _Roll_RA | 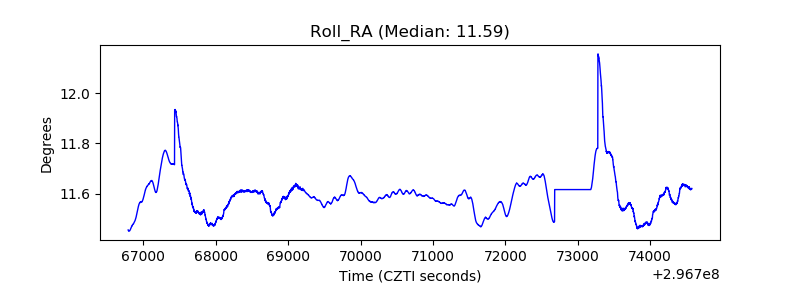 |
| Veto Counter |  |