| Param | Original file | Final file |
|---|---|---|
| Filename | modeM0/AS1C04_009T06_9000002960_19817cztM0_level2.evt | modeM0/AS1C04_009T06_9000002960_19817cztM0_level2_quad_clean.evt |
| Size (bytes) | 554,685,120 | 123,304,320 |
| Size | 529.0 MB | 117.6 MB |
| Events in quadrant A | 4,495,951 | 820,671 |
| Events in quadrant B | 3,201,255 | 874,529 |
| Events in quadrant C | 3,082,676 | 852,836 |
| Events in quadrant D | 5,590,645 | 745,736 |
| Mode SS | |||
|---|---|---|---|
| Quadrant | BADHDUFLAG | Total packets | Discarded packets |
| A | 0 | 128 | 0 |
| B | 0 | 128 | 0 |
| C | 0 | 128 | 0 |
| D | 0 | 128 | 0 |
| Mode M9 | |||
|---|---|---|---|
| Quadrant | BADHDUFLAG | Total packets | Discarded packets |
| A | 0 | 19 | 0 |
| B | 0 | 20 | 0 |
| C | 0 | 20 | 0 |
| D | 0 | 20 | 0 |
| Mode M0 | |||
|---|---|---|---|
| Quadrant | BADHDUFLAG | Total packets | Discarded packets |
| A | 0 | 17780 | 2 |
| B | 0 | 13768 | 2 |
| C | 0 | 13401 | 2 |
| D | 0 | 20970 | 3 |
| Quadrant | Total seconds | Saturated seconds | Saturation percentage |
|---|---|---|---|
| A | 6311 | 475 | 7.526541% |
| B | 6311 | 66 | 1.045793% |
| C | 6311 | 74 | 1.172556% |
| D | 6310 | 987 | 15.641838% |
Noise dominated data is calculated using 1-second bins in cleaned event files. If a bin has >2000 counts, and if more than 50% of those come from <1% of pixels, then it is considered to be noise-dominated and hence unusable.
| Quadrant | # 1 sec bins | Bins with >0 counts | Bins with >2000 counts | High rate bins dominated by noise | Noise dominated (total time) | Noise dominated (detector-on time) | Marked lightcurve |
|---|---|---|---|---|---|---|---|
| A | 7566 | 6312 | 327 | 327 | 4.32% | 5.18% | 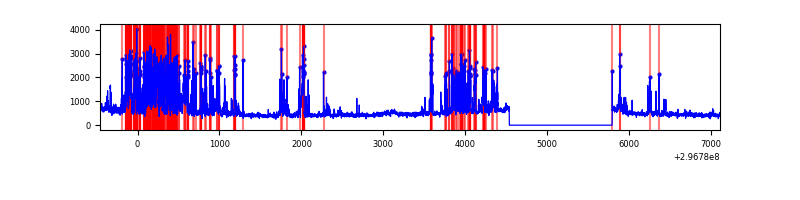 |
| B | 7566 | 6312 | 12 | 12 | 0.16% | 0.19% |  |
| C | 7566 | 6312 | 5 | 5 | 0.07% | 0.08% | 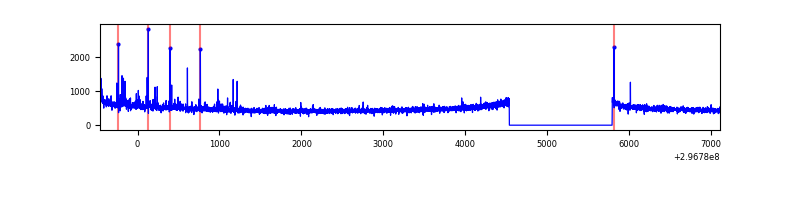 |
| D | 7565 | 6310 | 859 | 859 | 11.35% | 13.61% |  |
Top three noisy pixels from each quadrant. If the there are fewer than three noisy pixels in the level2.evt file, extra rows are filled as -1
| Pixel properties | Quadrant properties | ||||||
|---|---|---|---|---|---|---|---|
| Quadrant | DetID | PixID | Counts | Sigma | Mean | Median | Sigma |
| A | 14 | 238 | 1537717 | 10497.96 | 731 | 716 | 146.4 |
| A | 14 | 254 | 107729 | 730.92 | 731 | 716 | 146.4 |
| A | 9 | 143 | 32420 | 216.54 | 731 | 716 | 146.4 |
| B | 7 | 220 | 81223 | 569.98 | 761 | 743 | 141.2 |
| B | 5 | 172 | 36845 | 255.69 | 761 | 743 | 141.2 |
| B | 0 | 190 | 22506 | 154.13 | 761 | 743 | 141.2 |
| C | 14 | 238 | 116151 | 678.11 | 736 | 742 | 170.2 |
| C | 5 | 112 | 71607 | 416.38 | 736 | 742 | 170.2 |
| C | 3 | 233 | 15576 | 87.16 | 736 | 742 | 170.2 |
| D | 7 | 238 | 1280722 | 7826.93 | 675 | 656 | 163.5 |
| D | 7 | 38 | 996796 | 6090.87 | 675 | 656 | 163.5 |
| D | 1 | 52 | 484272 | 2957.06 | 675 | 656 | 163.5 |
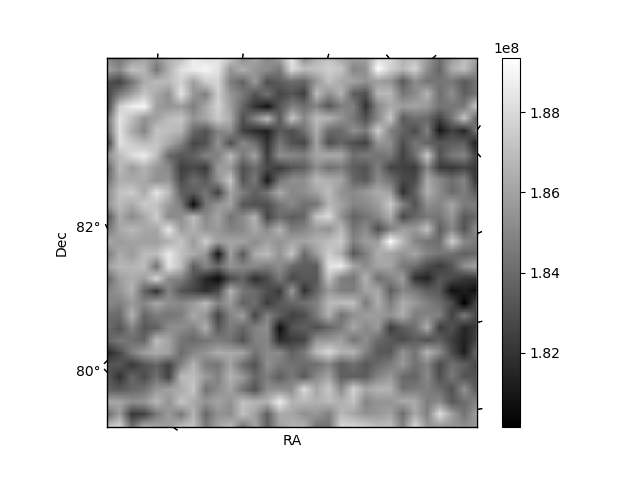
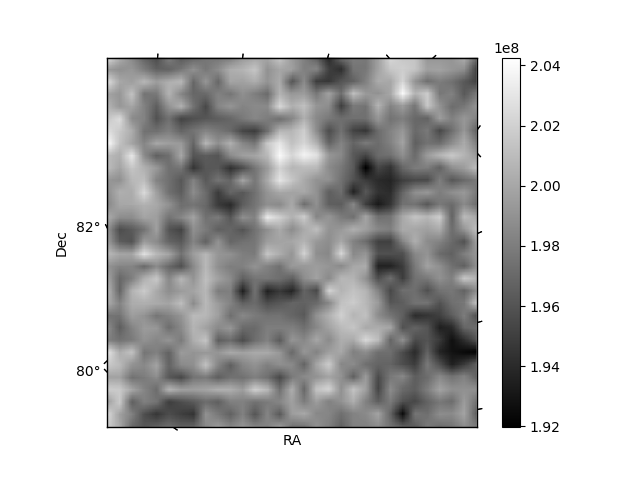
Histogram calculated using DETX and DETY for each event in the final _common_clean file
| Quadrant A | 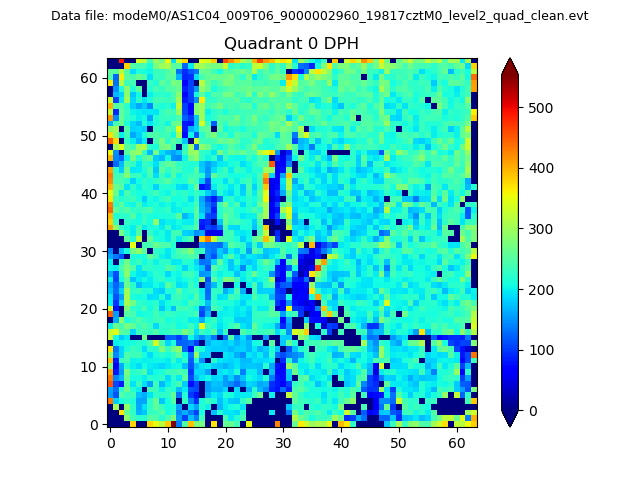 |
 |
Quadrant B |
|---|---|---|---|
| Quadrant D | 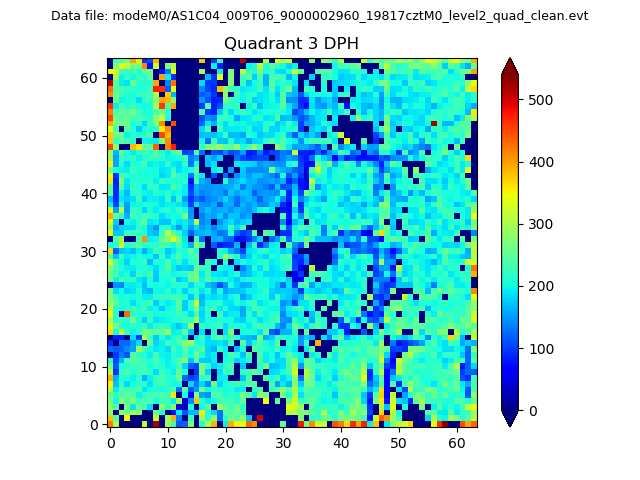 |
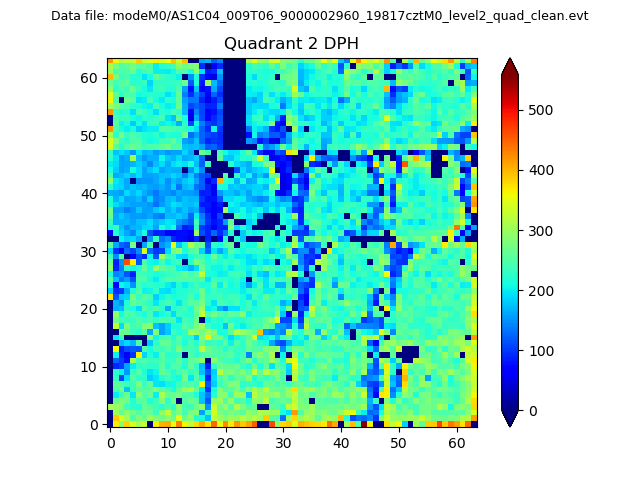 |
Quadrant C |
| Plot type | Count rate plots | Images |
|---|---|---|
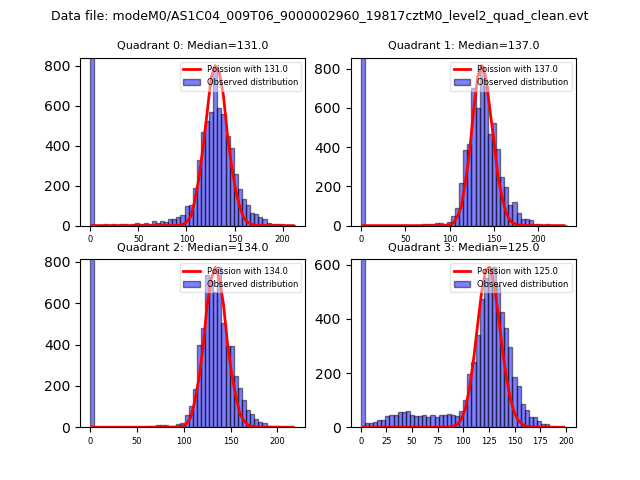
| Comparison with Poisson distribution Blue bars denote a histogram of data divided into 1 sec bins. Red curve is a Poisson curve with rate = median count rate of data. |
 |
 |
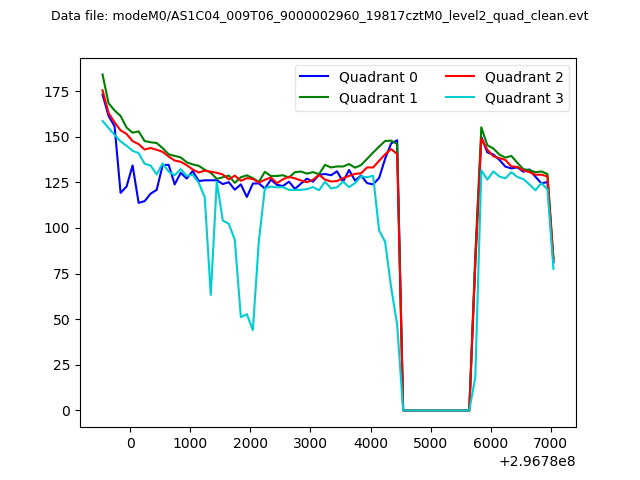
| Quadrant-wise count rates Data is divided into 100 sec bins |
 |
|
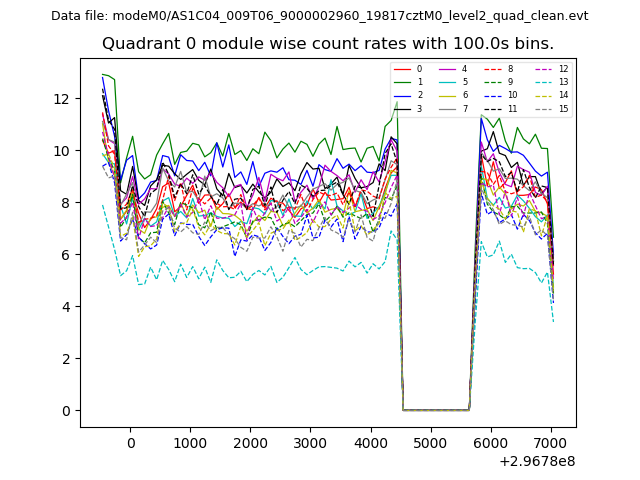
| Module-wise count rates for Quadrant A Data is divided into 100 sec bins |
 |
 |
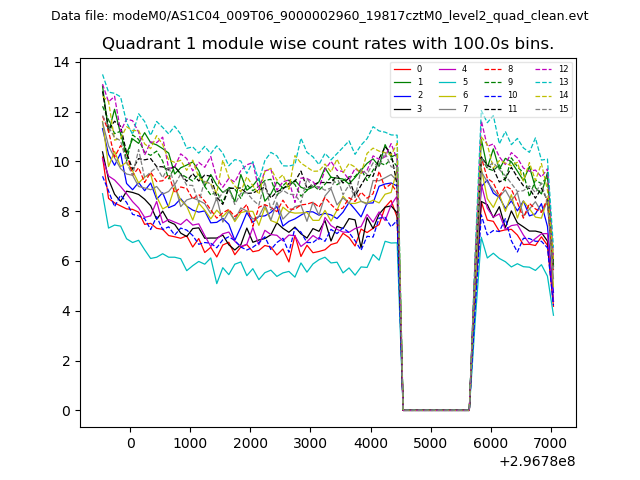
| Module-wise count rates for Quadrant B Data is divided into 100 sec bins |
 |
 |
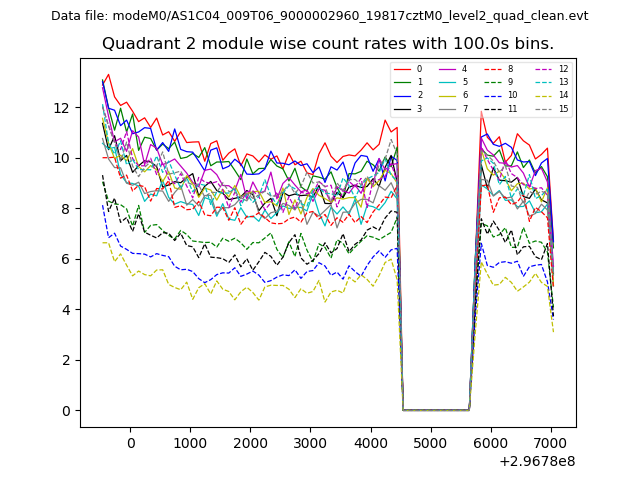
| Module-wise count rates for Quadrant C Data is divided into 100 sec bins |
 |
 |
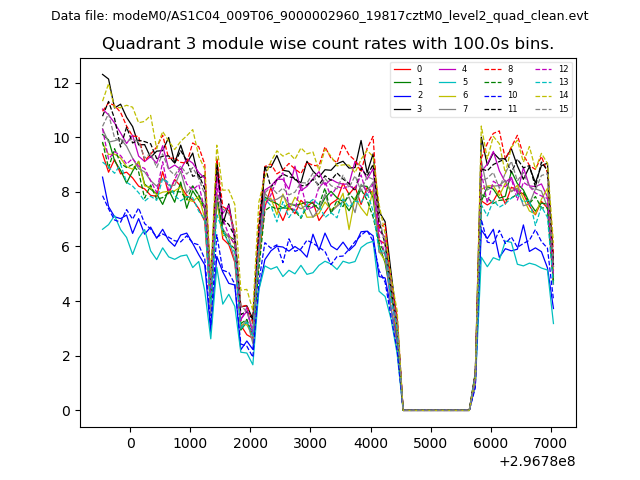
| Module-wise count rates for Quadrant D Data is divided into 100 sec bins |
 |
 |
| Parameter | Plot |
|---|---|
| CZT HV Monitor | 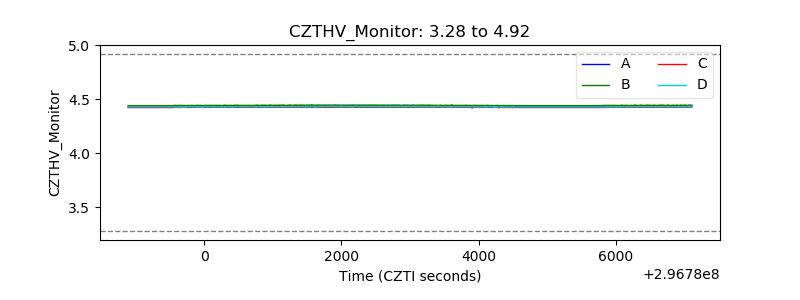 |
| D_VDD | 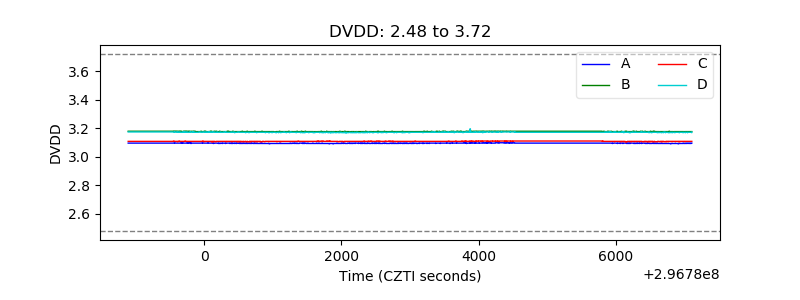 |
| Temperature 1 |  |
| Veto HV Monitor | 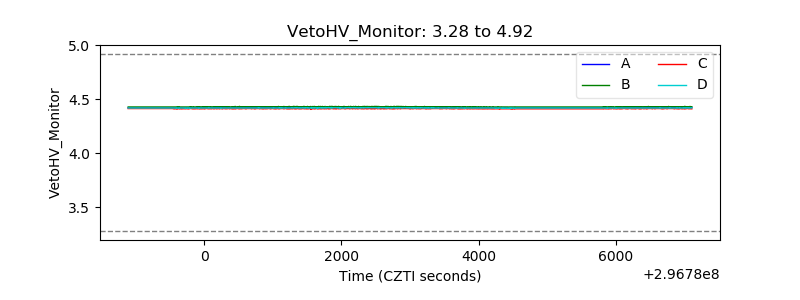 |
| Veto LLD | 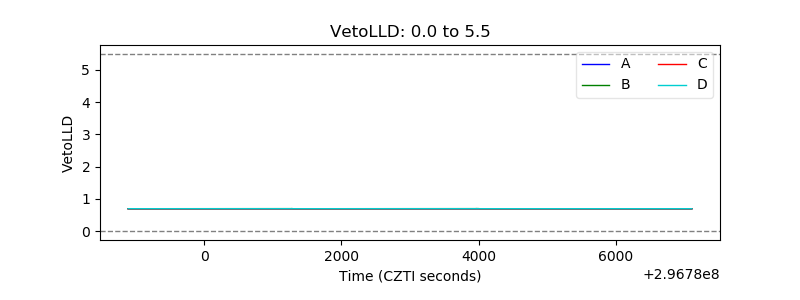 |
| Alpha Counter | 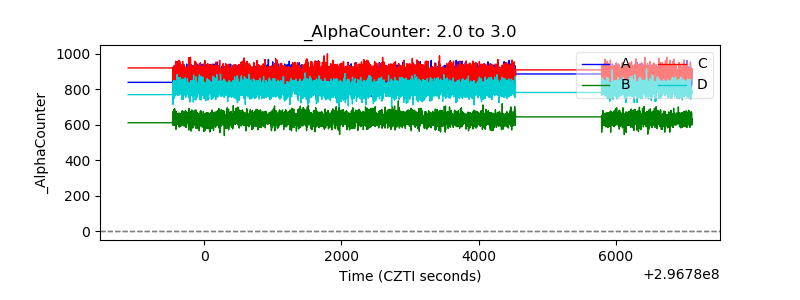 |
| _CPM_Rate | 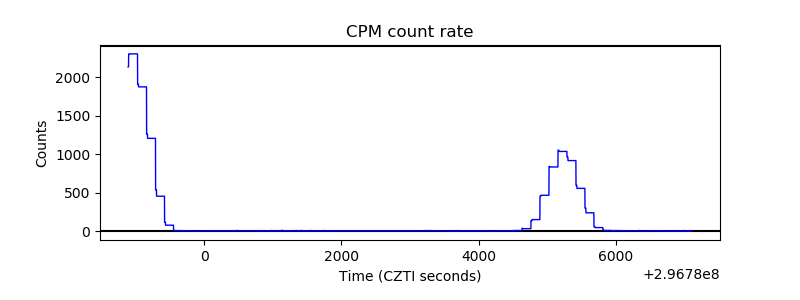 |
| CZT Counter | 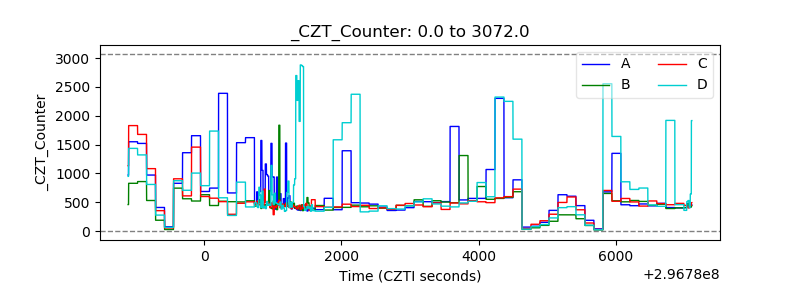 |
| +2.5 Volts monitor |  |
| +5 Volts monitor |  |
| _ROLL_ROT | 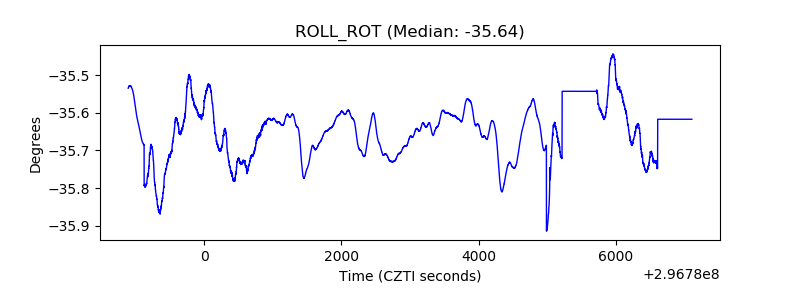 |
| _Roll_DEC | 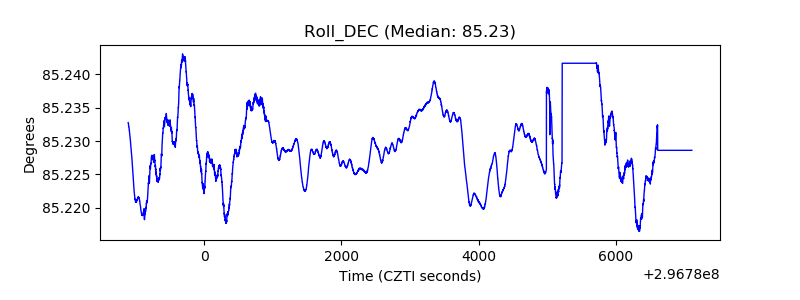 |
| _Roll_RA | 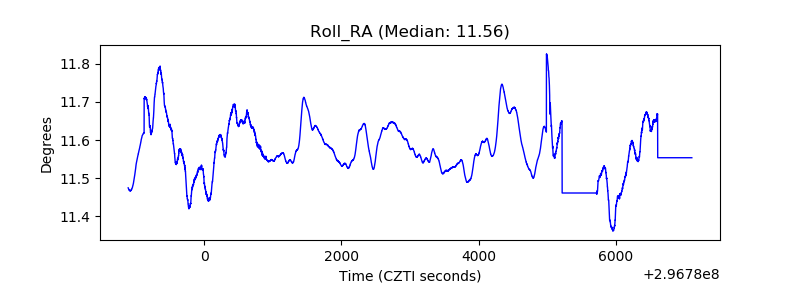 |
| Veto Counter | 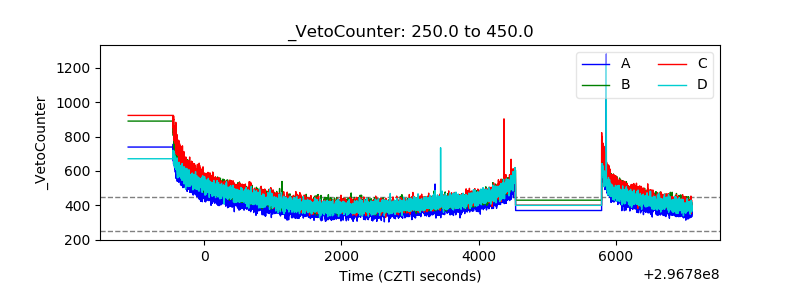 |