| Param | Original file | Final file |
|---|---|---|
| Filename | modeM0/AS1C04_009T06_9000002960_19818cztM0_level2.evt | modeM0/AS1C04_009T06_9000002960_19818cztM0_level2_quad_clean.evt |
| Size (bytes) | 116,084,160 | 29,442,240 |
| Size | 110.7 MB | 28.1 MB |
| Events in quadrant A | 748,369 | 198,457 |
| Events in quadrant B | 720,217 | 203,755 |
| Events in quadrant C | 710,486 | 198,402 |
| Events in quadrant D | 1,233,177 | 180,894 |
| Mode SS | |||
|---|---|---|---|
| Quadrant | BADHDUFLAG | Total packets | Discarded packets |
| A | 0 | 30 | 2 |
| B | 0 | 30 | 0 |
| C | 0 | 30 | 0 |
| D | 0 | 30 | 0 |
| Mode M9 | |||
|---|---|---|---|
| Quadrant | BADHDUFLAG | Total packets | Discarded packets |
| A | 0 | 1 | 0 |
| B | 0 | 1 | 0 |
| C | 0 | 1 | 0 |
| D | 0 | 1 | 0 |
| Mode M0 | |||
|---|---|---|---|
| Quadrant | BADHDUFLAG | Total packets | Discarded packets |
| A | 0 | 3307 | 48 |
| B | 0 | 3152 | 51 |
| C | 0 | 3115 | 61 |
| D | 0 | 4791 | 88 |
| Quadrant | Total seconds | Saturated seconds | Saturation percentage |
|---|---|---|---|
| A | 1486 | 10 | 0.672948% |
| B | 1482 | 9 | 0.607287% |
| C | 1477 | 17 | 1.150982% |
| D | 1473 | 119 | 8.078751% |
Noise dominated data is calculated using 1-second bins in cleaned event files. If a bin has >2000 counts, and if more than 50% of those come from <1% of pixels, then it is considered to be noise-dominated and hence unusable.
| Quadrant | # 1 sec bins | Bins with >0 counts | Bins with >2000 counts | High rate bins dominated by noise | Noise dominated (total time) | Noise dominated (detector-on time) | Marked lightcurve |
|---|---|---|---|---|---|---|---|
| A | 1507 | 1506 | 5 | 5 | 0.33% | 0.33% | 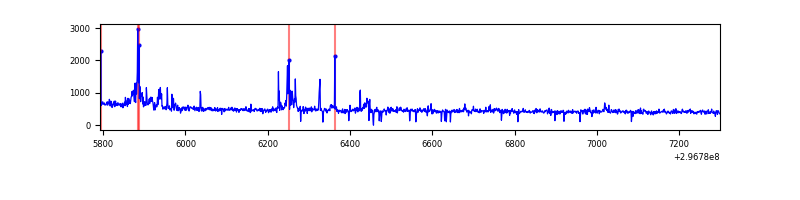 |
| B | 1507 | 1506 | 3 | 3 | 0.20% | 0.20% | 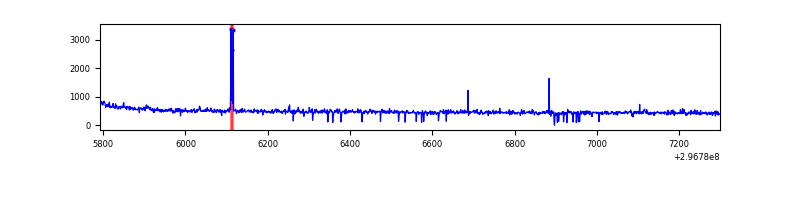 |
| C | 1507 | 1506 | 1 | 1 | 0.07% | 0.07% | 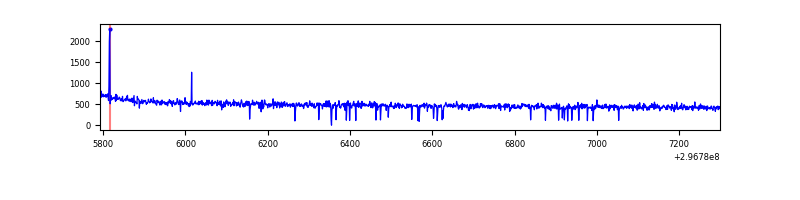 |
| D | 1507 | 1502 | 120 | 120 | 7.96% | 7.99% | 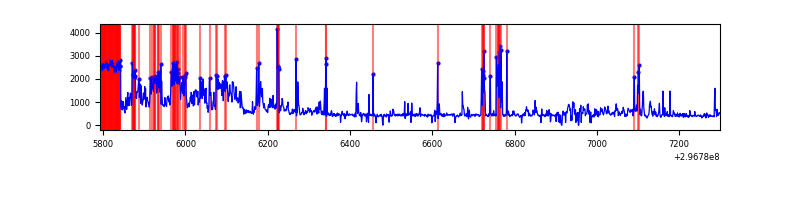 |
Top three noisy pixels from each quadrant. If the there are fewer than three noisy pixels in the level2.evt file, extra rows are filled as -1
| Pixel properties | Quadrant properties | ||||||
|---|---|---|---|---|---|---|---|
| Quadrant | DetID | PixID | Counts | Sigma | Mean | Median | Sigma |
| A | 14 | 238 | 74902 | 2028.09 | 174 | 170 | 36.8 |
| A | 14 | 254 | 1668 | 40.65 | 174 | 170 | 36.8 |
| A | 0 | 226 | 1520 | 36.64 | 174 | 170 | 36.8 |
| B | 6 | 36 | 12257 | 340.28 | 178 | 173 | 35.5 |
| B | 0 | 197 | 4684 | 127.03 | 178 | 173 | 35.5 |
| B | 12 | 111 | 3655 | 98.05 | 178 | 173 | 35.5 |
| C | 14 | 238 | 27395 | 649.45 | 173 | 174 | 41.9 |
| C | 5 | 112 | 4565 | 104.76 | 173 | 174 | 41.9 |
| C | 13 | 61 | 1215 | 24.84 | 173 | 174 | 41.9 |
| D | 7 | 38 | 362662 | 8856.12 | 163 | 158 | 40.9 |
| D | 1 | 52 | 202272 | 4937.73 | 163 | 158 | 40.9 |
| D | 10 | 230 | 17082 | 413.46 | 163 | 158 | 40.9 |
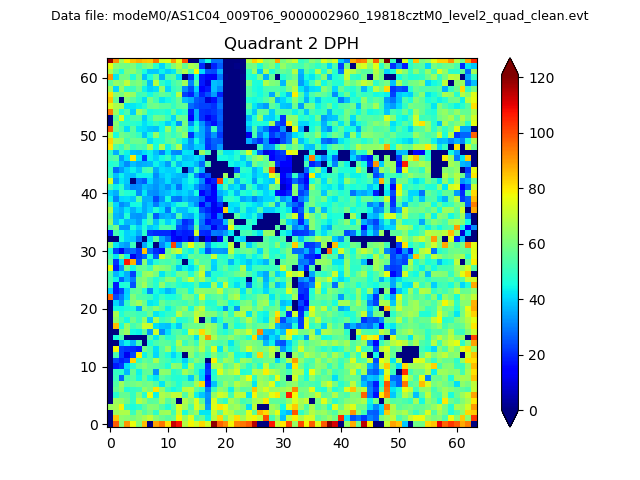
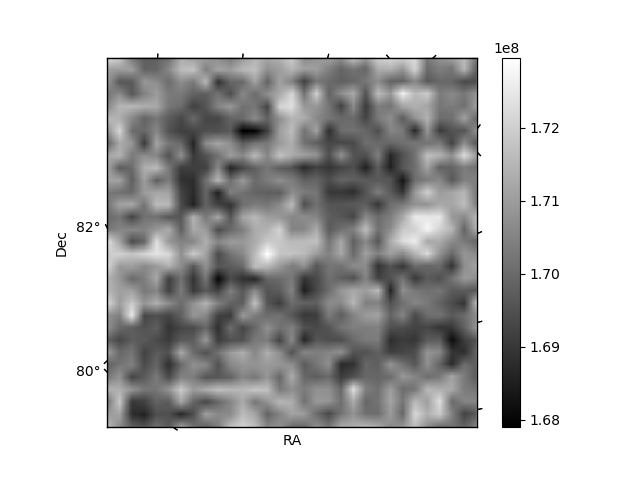
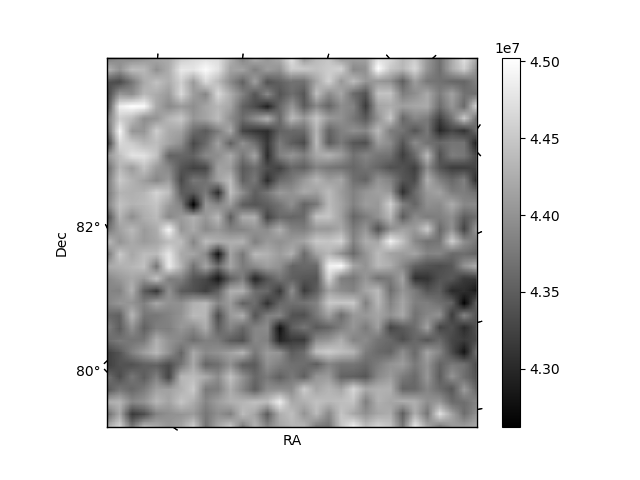
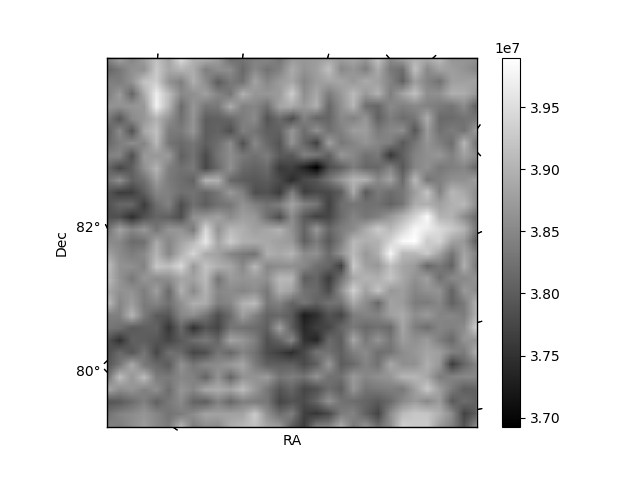
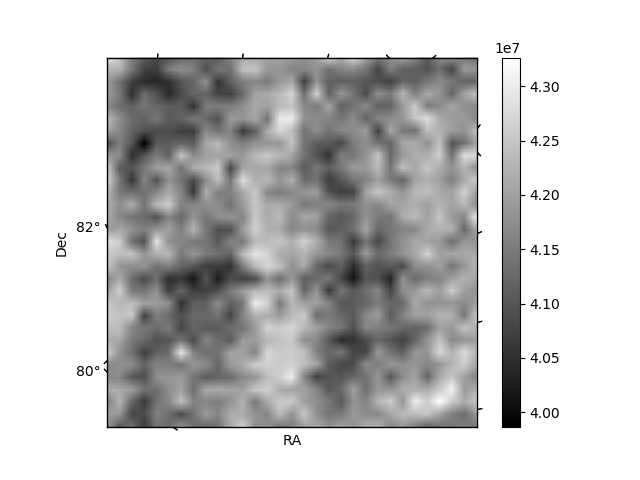
Histogram calculated using DETX and DETY for each event in the final _common_clean file
| Quadrant A | 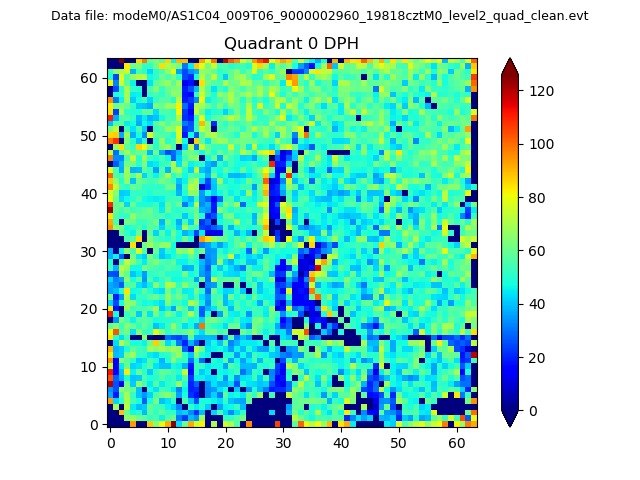 |
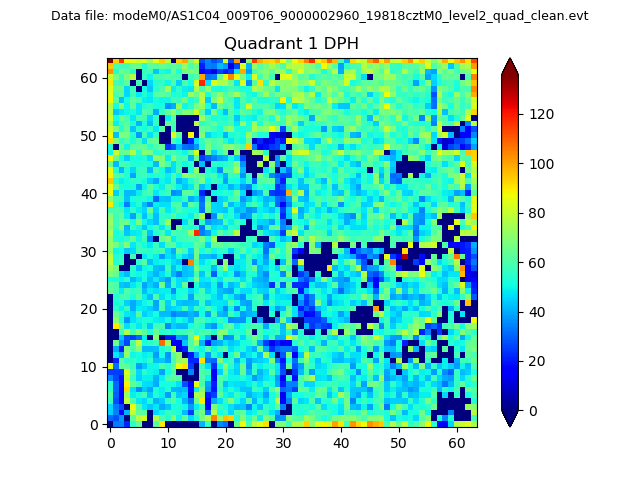 |
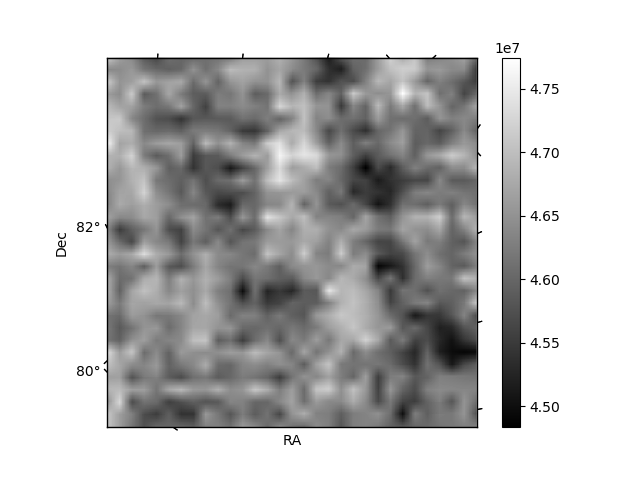
Quadrant B |
|---|---|---|---|
| Quadrant D | 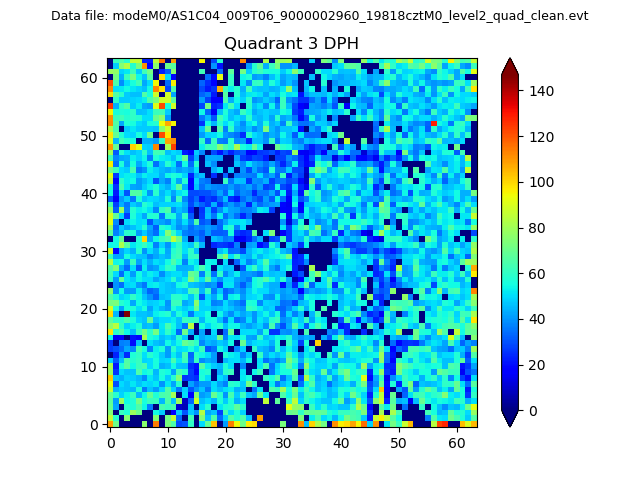 |
 |
Quadrant C |
| Plot type | Count rate plots | Images |
|---|---|---|
| Comparison with Poisson distribution Blue bars denote a histogram of data divided into 1 sec bins. Red curve is a Poisson curve with rate = median count rate of data. |
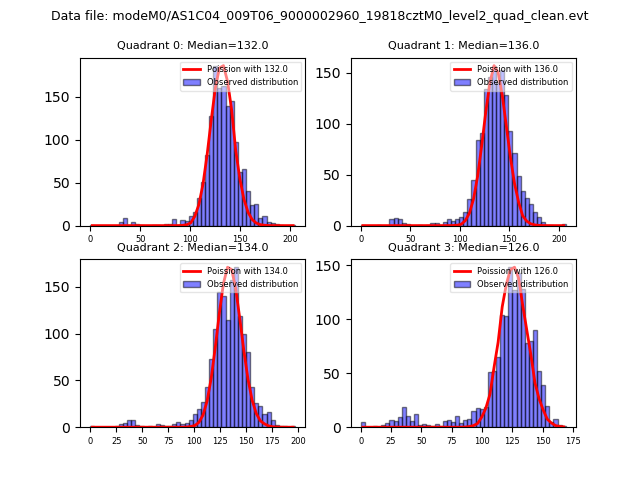 |
 |
| Quadrant-wise count rates Data is divided into 100 sec bins |
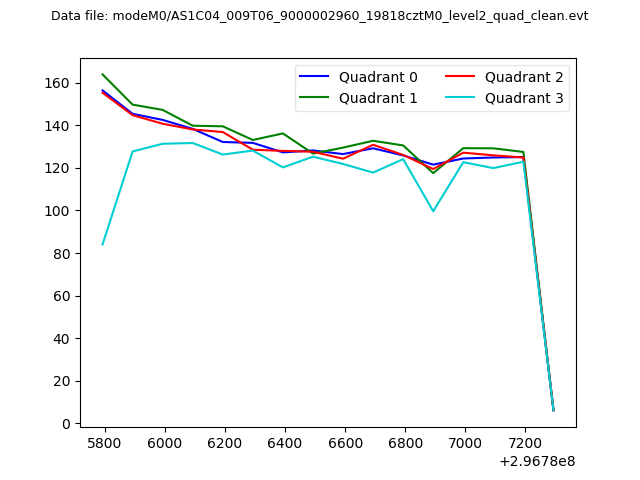 |
|
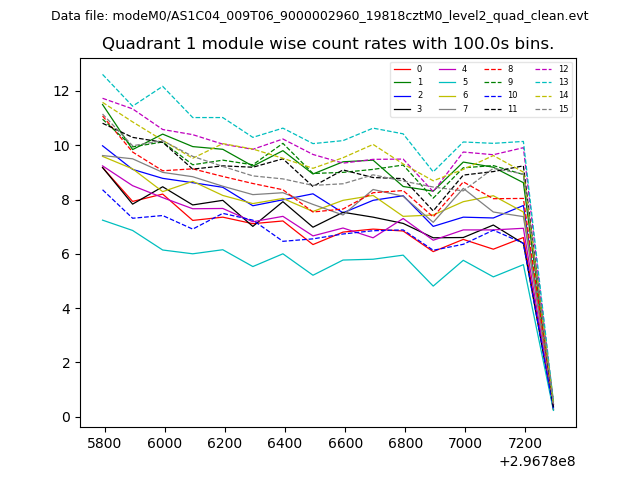
| Module-wise count rates for Quadrant A Data is divided into 100 sec bins |
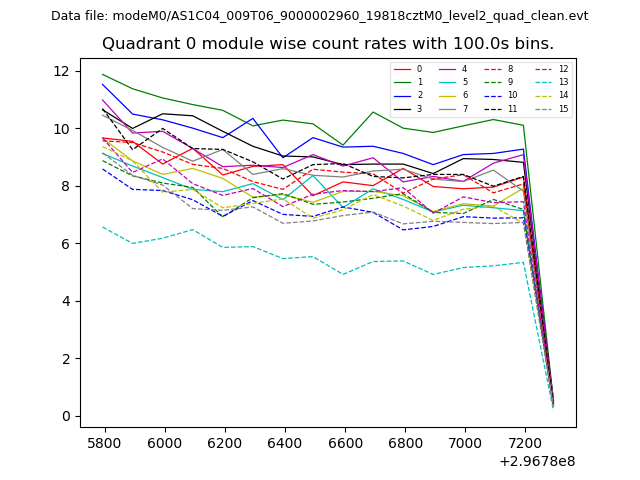 |
 |
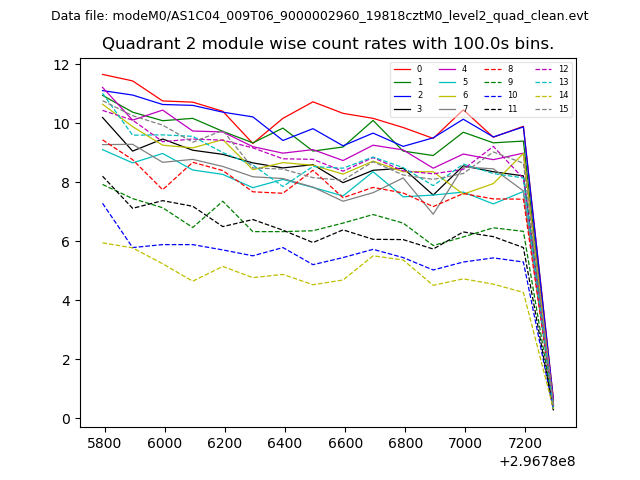
| Module-wise count rates for Quadrant B Data is divided into 100 sec bins |
 |
 |
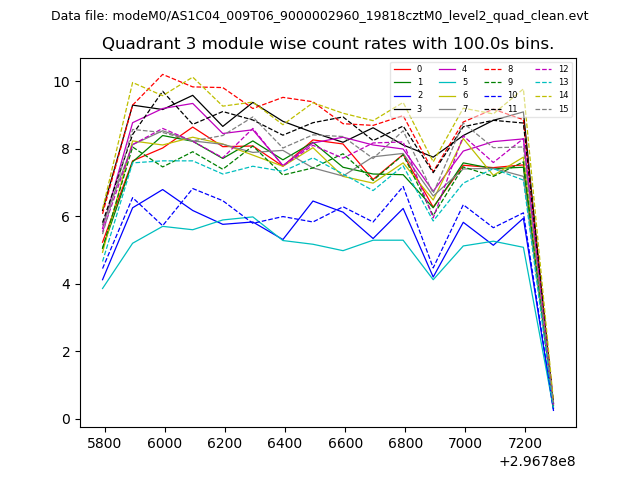
| Module-wise count rates for Quadrant C Data is divided into 100 sec bins |
 |
 |
| Module-wise count rates for Quadrant D Data is divided into 100 sec bins |
 |
 |
| Parameter | Plot |
|---|---|
| CZT HV Monitor | 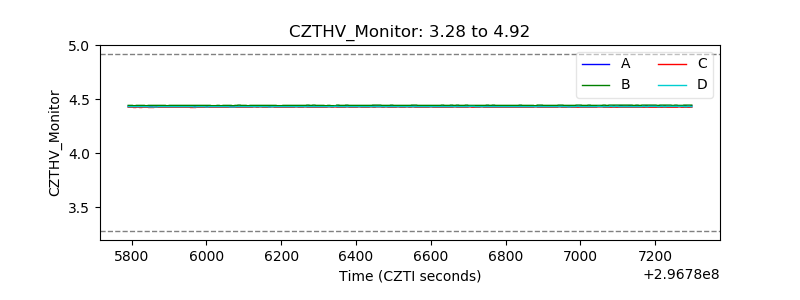 |
| D_VDD | 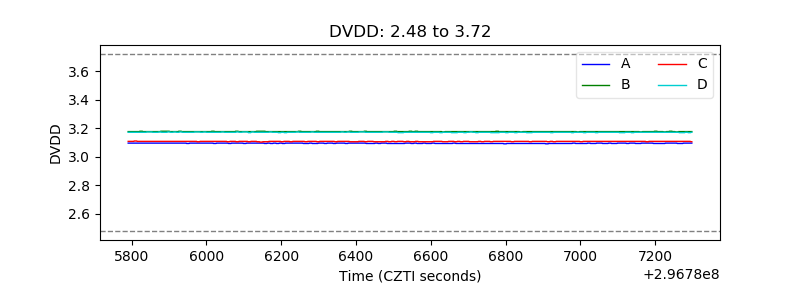 |
| Temperature 1 | 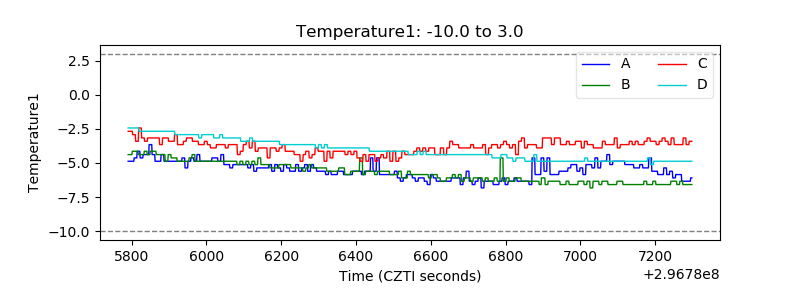 |
| Veto HV Monitor | 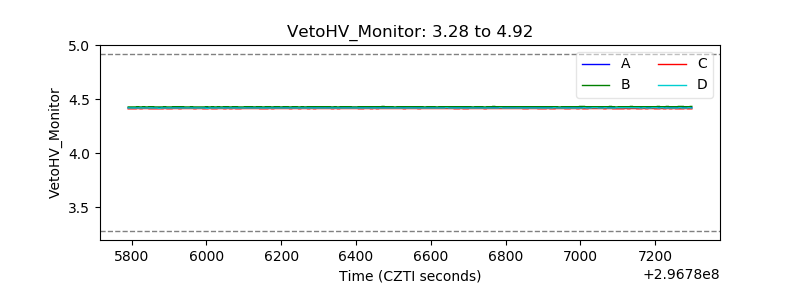 |
| Veto LLD | 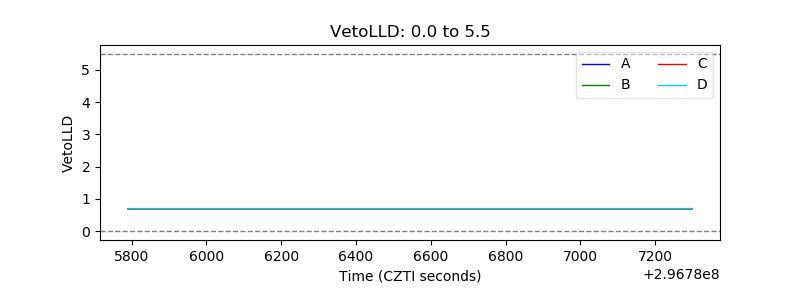 |
| Alpha Counter | 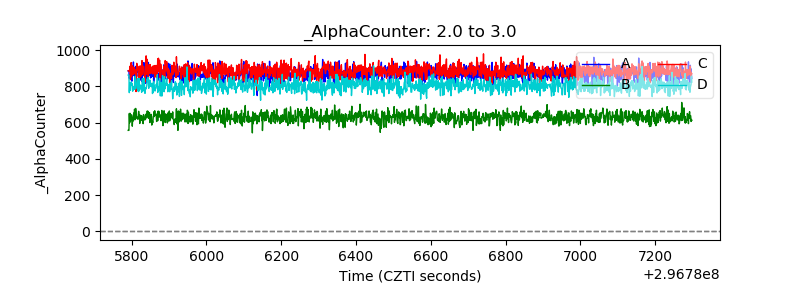 |
| _CPM_Rate | 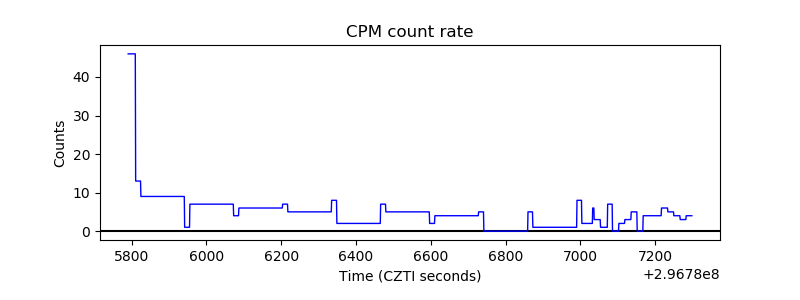 |
| CZT Counter | 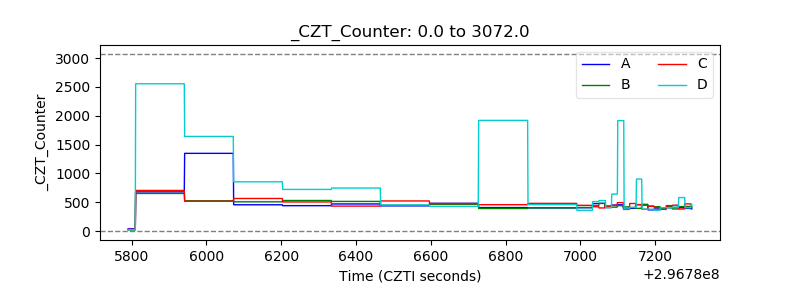 |
| +2.5 Volts monitor |  |
| +5 Volts monitor |  |
| _ROLL_ROT | 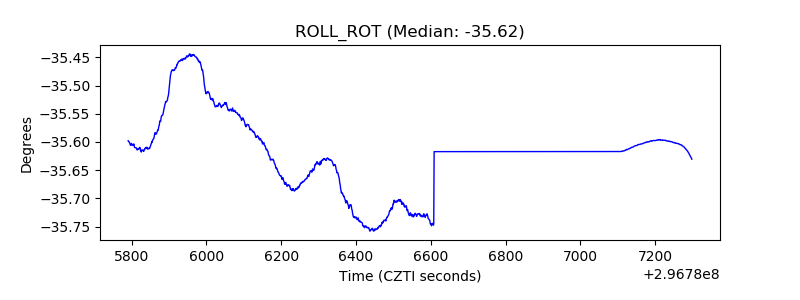 |
| _Roll_DEC | 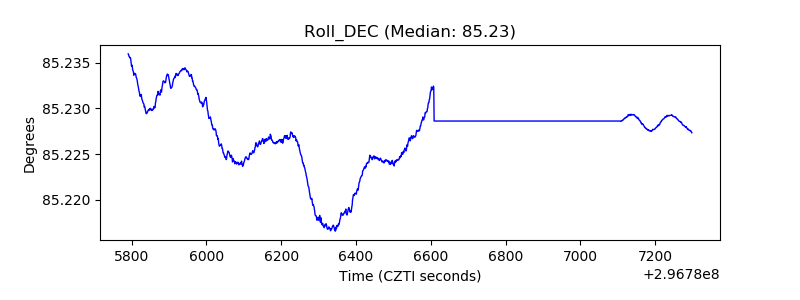 |
| _Roll_RA | 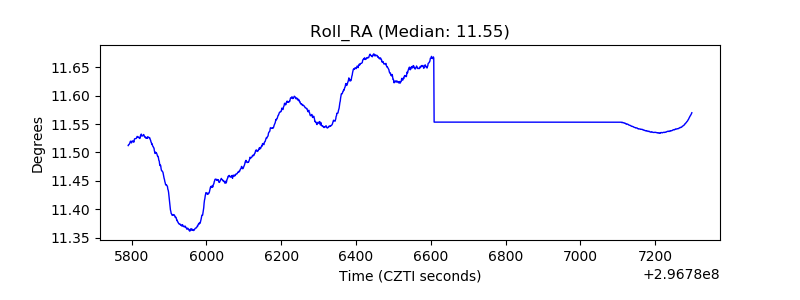 |
| Veto Counter | 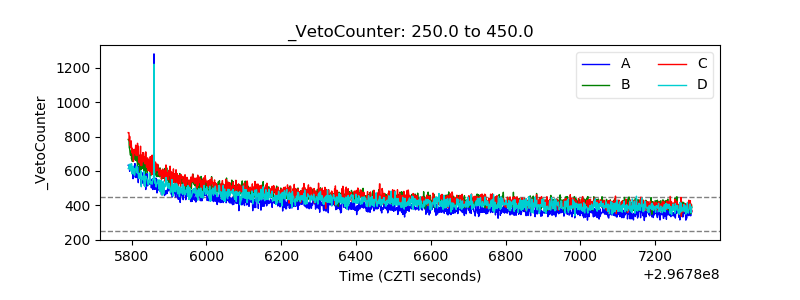 |