| Param | Original file | Final file |
|---|---|---|
| Filename | modeM0/AS1T03_118T01_9000002962cztM0_level2.fits | modeM0/AS1T03_118T01_9000002962cztM0_level2_quad_clean.evt |
| Size (bytes) | 6,205,311,360 | 4,095,504,000 |
| Size | 5.8 GB | 3.8 GB |
| Events in quadrant A | 40,696,479 | 24,564,344 |
| Events in quadrant B | 42,326,555 | 25,440,891 |
| Events in quadrant C | 40,333,929 | 24,555,720 |
| Events in quadrant D | 38,391,274 | 23,281,104 |
| Mode SS | |||
|---|---|---|---|
| Quadrant | BADHDUFLAG | Total packets | Discarded packets |
| A | 0 | 7750 | 0 |
| B | 0 | 7738 | 0 |
| C | 0 | 7742 | 0 |
| D | 0 | 7833 | 0 |
| Mode M9 | |||
|---|---|---|---|
| Quadrant | BADHDUFLAG | Total packets | Discarded packets |
| A | 1 | 140042297243688 | 140041703653422 |
| B | 1 | 140042297243688 | 140041703653422 |
| C | 1 | 140042297243688 | 140041703653422 |
| D | 1 | 140042297243688 | 140041703653422 |
| Mode M0 | |||
|---|---|---|---|
| Quadrant | BADHDUFLAG | Total packets | Discarded packets |
| A | 0 | 1049477 | 0 |
| B | 0 | 817308 | 0 |
| C | 0 | 844351 | 0 |
| D | 0 | 938609 | 0 |
| Quadrant | Total seconds | Saturated seconds | Saturation percentage |
|---|---|---|---|
| A | 382467 | 32227 | 8.426086% |
| B | 383220 | 6069 | 1.583686% |
| C | 383251 | 8386 | 2.188122% |
| D | 382176 | 13629 | 3.566158% |
Noise dominated data is calculated using 1-second bins in cleaned event files. If a bin has >2000 counts, and if more than 50% of those come from <1% of pixels, then it is considered to be noise-dominated and hence unusable.
| Quadrant | # 1 sec bins | Bins with >0 counts | Bins with >2000 counts | High rate bins dominated by noise | Noise dominated (total time) | Noise dominated (detector-on time) | Marked lightcurve |
|---|---|---|---|---|---|---|---|
| A | 483194 | 381311 | 0 | 0 | 0.00% | 0.00% |  |
| B | 483194 | 383533 | 0 | 0 | 0.00% | 0.00% |  |
| C | 483194 | 383585 | 0 | 0 | 0.00% | 0.00% |  |
| D | 483194 | 381442 | 0 | 0 | 0.00% | 0.00% |  |
Top three noisy pixels from each quadrant. If the there are fewer than three noisy pixels in the level2.evt file, extra rows are filled as -1
| Pixel properties | Quadrant properties | ||||||
|---|---|---|---|---|---|---|---|
| Quadrant | DetID | PixID | Counts | Sigma | Mean | Median | Sigma |
| A | 14 | 235 | 24090 | 5.93 | 10715 | 10219 | 2339.1 |
| A | 0 | 29 | 24007 | 5.89 | 10715 | 10219 | 2339.1 |
| A | -1 | -1 | -1 | -1.0 | 10715 | 10219 | 2339.1 |
| B | 5 | 232 | 24483 | 5.85 | 11309 | 10869 | 2325.9 |
| B | 2 | 9 | 23434 | 5.4 | 11309 | 10869 | 2325.9 |
| B | -1 | -1 | -1 | -1.0 | 11309 | 10869 | 2325.9 |
| C | 9 | 209 | 25747 | 6.07 | 10727 | 10394 | 2531.0 |
| C | 3 | 203 | 24420 | 5.54 | 10727 | 10394 | 2531.0 |
| C | 2 | 254 | 23161 | 5.04 | 10727 | 10394 | 2531.0 |
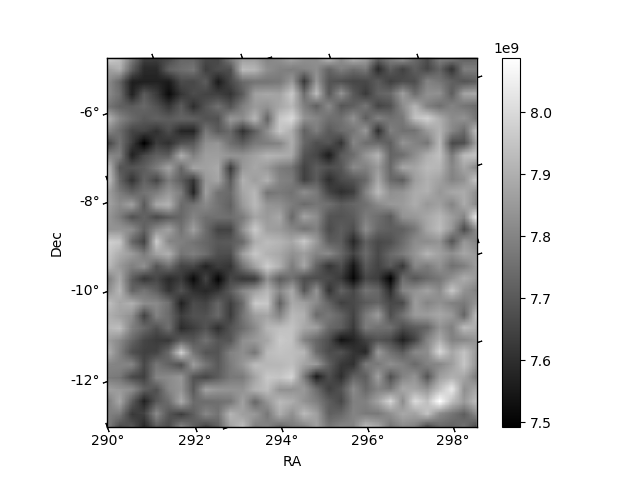
Histogram calculated using DETX and DETY for each event in the final _common_clean file
| Quadrant A | 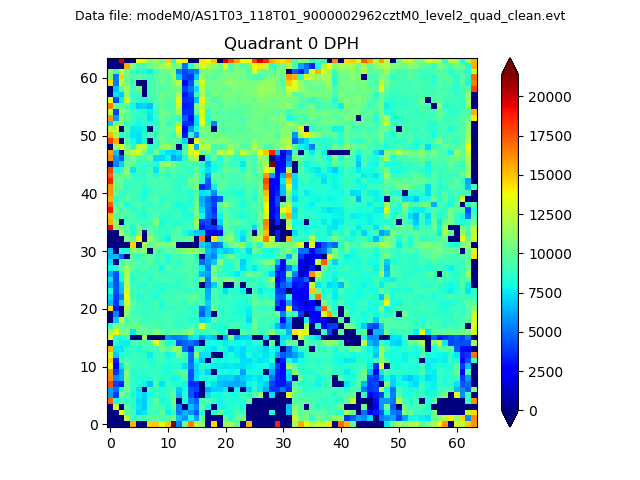 |
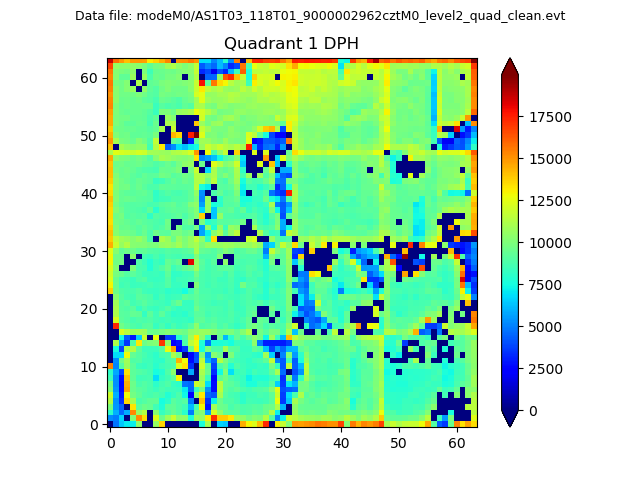 |
Quadrant B |
|---|---|---|---|
| Quadrant D |  |
 |
Quadrant C |
| Plot type | Count rate plots | Images |
|---|---|---|
| Comparison with Poisson distribution Blue bars denote a histogram of data divided into 1 sec bins. Red curve is a Poisson curve with rate = median count rate of data. |
 |
 |
| Quadrant-wise count rates Data is divided into 100 sec bins |
 |
|
| Module-wise count rates for Quadrant A Data is divided into 100 sec bins |
 |
 |
| Module-wise count rates for Quadrant B Data is divided into 100 sec bins |
 |
 |
| Module-wise count rates for Quadrant C Data is divided into 100 sec bins |
 |
 |
| Module-wise count rates for Quadrant D Data is divided into 100 sec bins |
 |
 |
| Parameter | Plot |
|---|---|
| CZT HV Monitor | 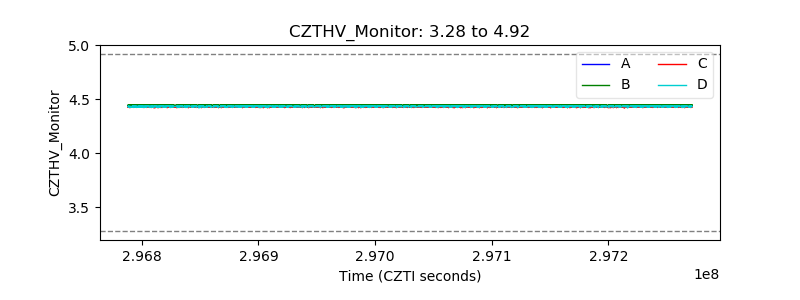 |
| D_VDD |  |
| Temperature 1 |  |
| Veto HV Monitor |  |
| Veto LLD | 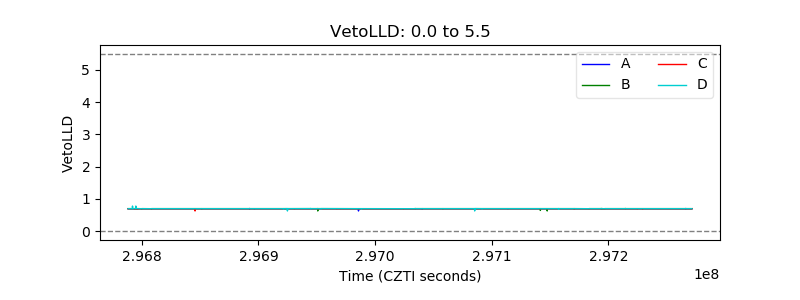 |
| Alpha Counter |  |
| _CPM_Rate |  |
| CZT Counter |  |
| +2.5 Volts monitor |  |
| +5 Volts monitor | 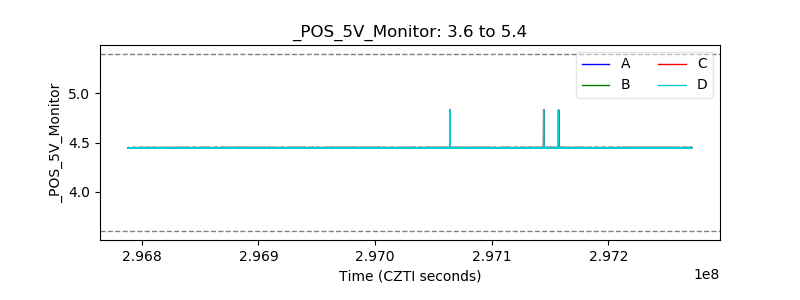 |
| _ROLL_ROT |  |
| _Roll_DEC |  |
| _Roll_RA | 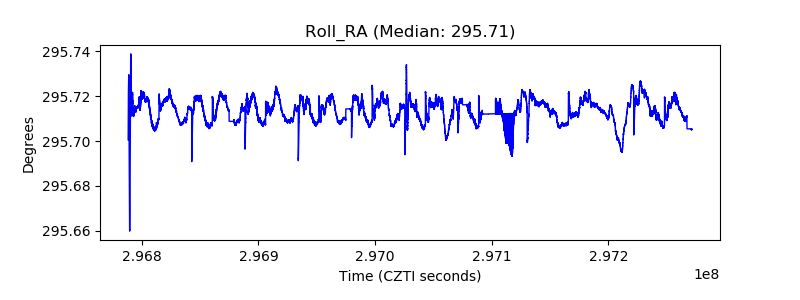 |
| Veto Counter | 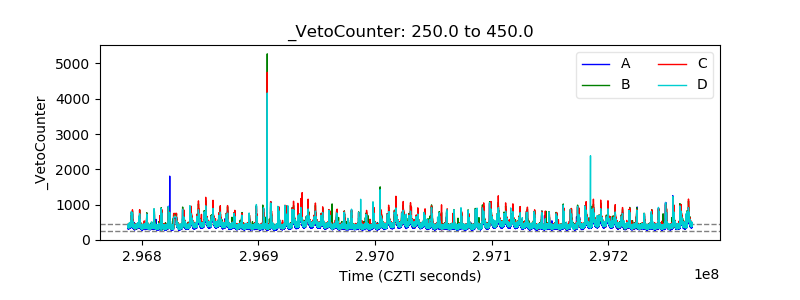 |