| Param | Original file | Final file |
|---|---|---|
| Filename | modeM0/AS1T03_118T01_9000002962_19818cztM0_level2.evt | modeM0/AS1T03_118T01_9000002962_19818cztM0_level2_quad_clean.evt |
| Size (bytes) | 144,838,080 | 13,449,600 |
| Size | 138.1 MB | 12.8 MB |
| Events in quadrant A | 1,109,913 | 63,308 |
| Events in quadrant B | 1,037,285 | 65,129 |
| Events in quadrant C | 982,850 | 61,776 |
| Events in quadrant D | 1,109,116 | 62,120 |
| Mode SS | |||
|---|---|---|---|
| Quadrant | BADHDUFLAG | Total packets | Discarded packets |
| A | 0 | 70 | 26 |
| B | 0 | 74 | 36 |
| C | 0 | 79 | 37 |
| D | 0 | 75 | 31 |
| Mode M9 | |||
|---|---|---|---|
| Quadrant | BADHDUFLAG | Total packets | Discarded packets |
| A | 0 | 7 | 7 |
| B | 0 | 5 | 5 |
| C | 0 | 6 | 6 |
| D | 0 | 4 | 4 |
| Mode M0 | |||
|---|---|---|---|
| Quadrant | BADHDUFLAG | Total packets | Discarded packets |
| A | 0 | 7758 | 3097 |
| B | 0 | 7334 | 2878 |
| C | 0 | 7193 | 2902 |
| D | 0 | 7924 | 3178 |
| Quadrant | Total seconds | Saturated seconds | Saturation percentage |
|---|---|---|---|
| A | 2130 | 34 | 1.596244% |
| B | 2145 | 14 | 0.652681% |
| C | 2139 | 5 | 0.233754% |
| D | 2104 | 27 | 1.283270% |
Noise dominated data is calculated using 1-second bins in cleaned event files. If a bin has >2000 counts, and if more than 50% of those come from <1% of pixels, then it is considered to be noise-dominated and hence unusable.
| Quadrant | # 1 sec bins | Bins with >0 counts | Bins with >2000 counts | High rate bins dominated by noise | Noise dominated (total time) | Noise dominated (detector-on time) | Marked lightcurve |
|---|---|---|---|---|---|---|---|
| A | 5463 | 2225 | 19 | 19 | 0.35% | 0.85% | 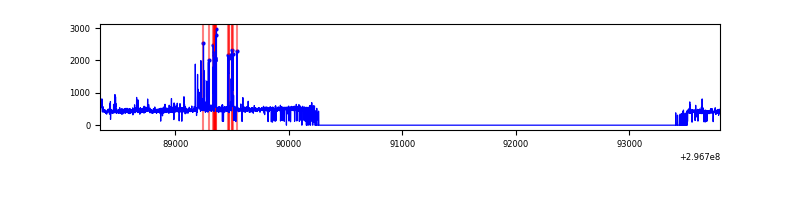 |
| B | 5462 | 2242 | 9 | 9 | 0.16% | 0.40% | 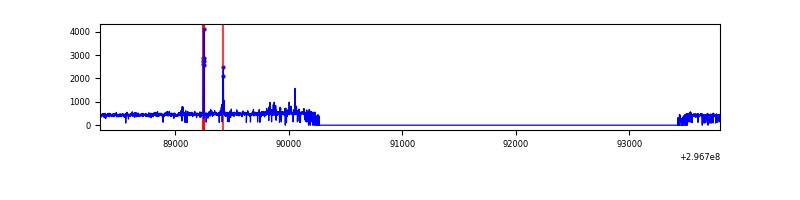 |
| C | 5462 | 2231 | 0 | 0 | 0.00% | 0.00% | 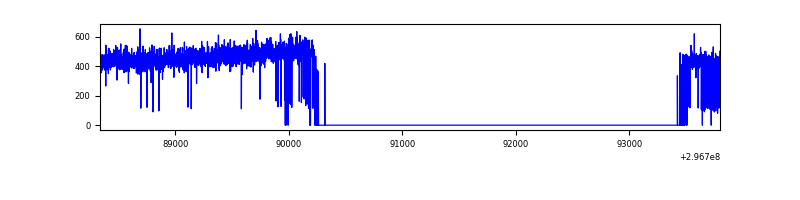 |
| D | 5462 | 2216 | 22 | 22 | 0.40% | 0.99% | 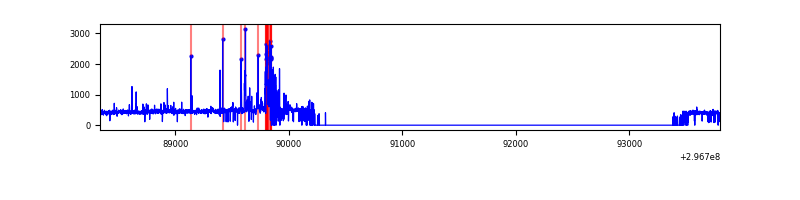 |
Top three noisy pixels from each quadrant. If the there are fewer than three noisy pixels in the level2.evt file, extra rows are filled as -1
| Pixel properties | Quadrant properties | ||||||
|---|---|---|---|---|---|---|---|
| Quadrant | DetID | PixID | Counts | Sigma | Mean | Median | Sigma |
| A | 14 | 238 | 119112 | 2271.37 | 250 | 245 | 52.3 |
| A | 14 | 254 | 13980 | 262.46 | 250 | 245 | 52.3 |
| A | 5 | 16 | 10649 | 198.8 | 250 | 245 | 52.3 |
| B | 7 | 220 | 44360 | 879.61 | 251 | 246 | 50.2 |
| B | 12 | 111 | 5704 | 108.83 | 251 | 246 | 50.2 |
| B | 11 | 111 | 5063 | 96.05 | 251 | 246 | 50.2 |
| C | 14 | 238 | 37664 | 645.44 | 242 | 242 | 58.0 |
| C | 13 | 61 | 1738 | 25.79 | 242 | 242 | 58.0 |
| C | 8 | 128 | 852 | 10.51 | 242 | 242 | 58.0 |
| D | 12 | 218 | 153264 | 2535.1 | 242 | 235 | 60.4 |
| D | 1 | 52 | 22270 | 365.03 | 242 | 235 | 60.4 |
| D | 2 | 234 | 11527 | 187.06 | 242 | 235 | 60.4 |
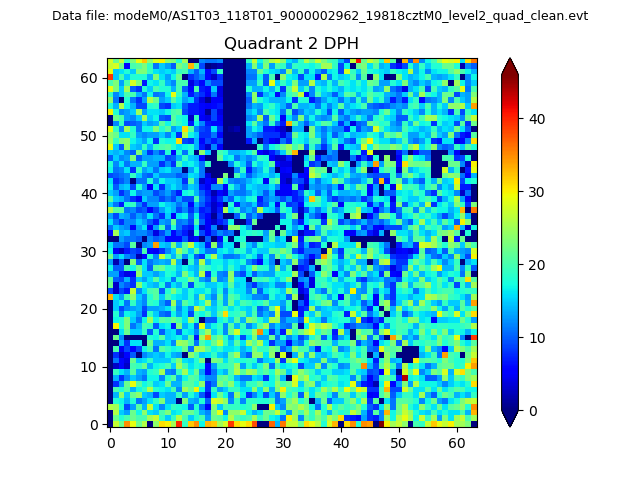
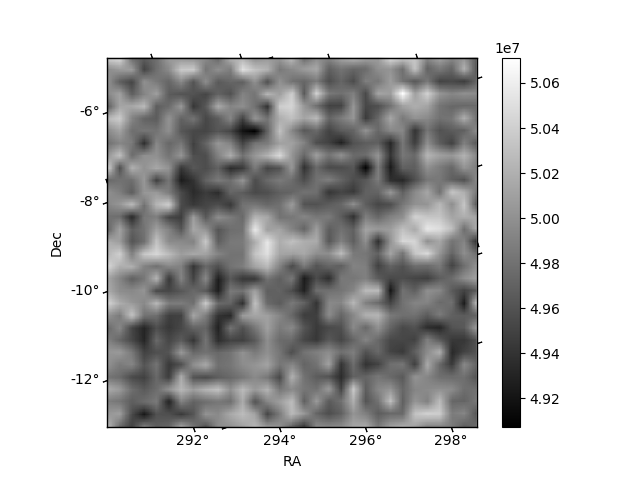
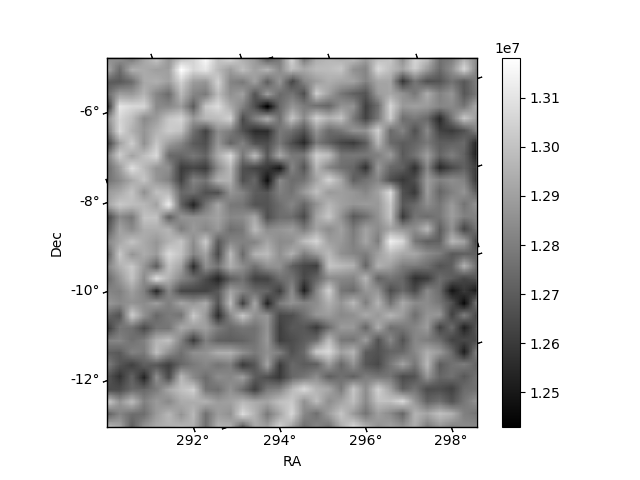
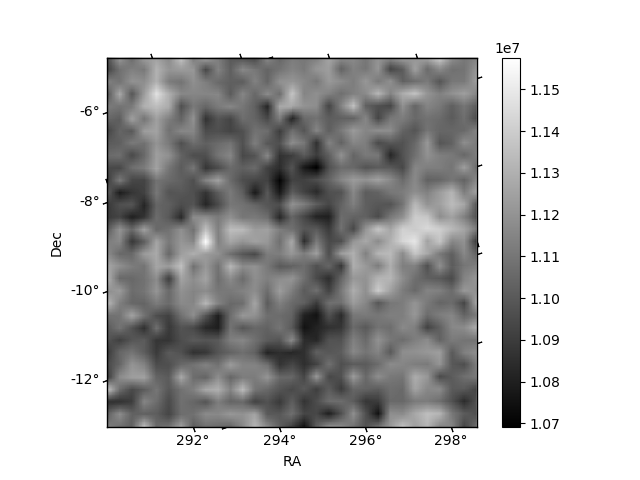
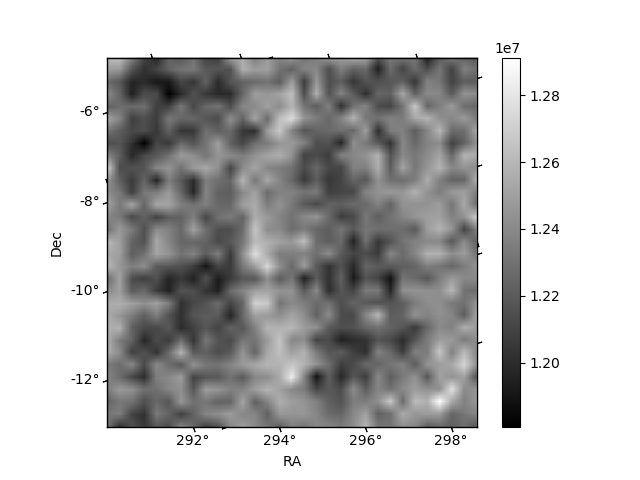
Histogram calculated using DETX and DETY for each event in the final _common_clean file
| Quadrant A | 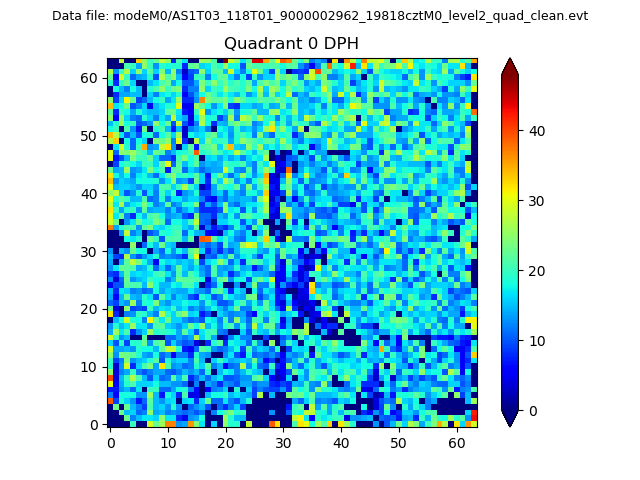 |
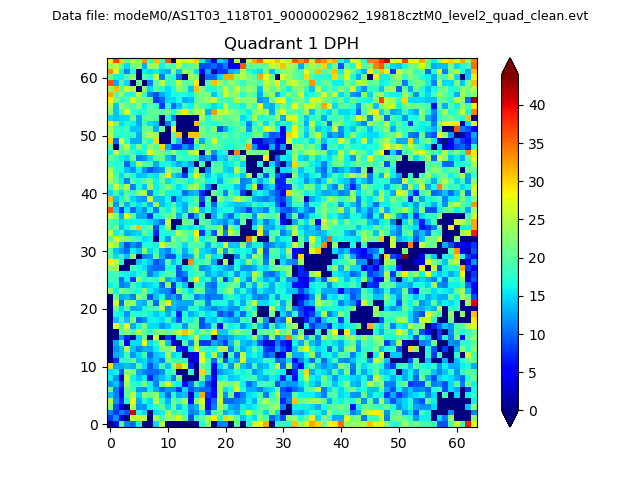 |
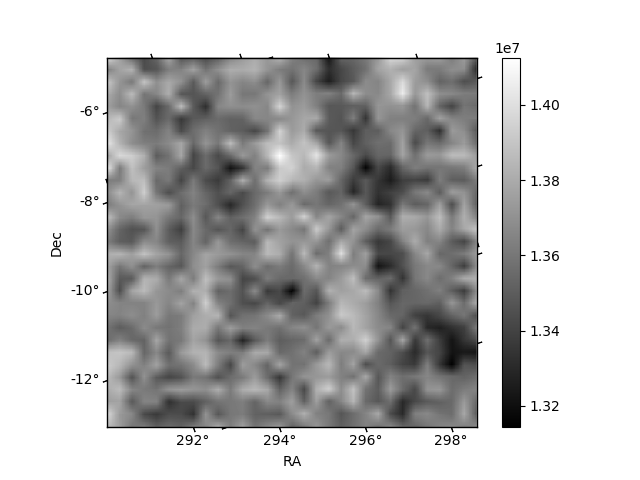
Quadrant B |
|---|---|---|---|
| Quadrant D | 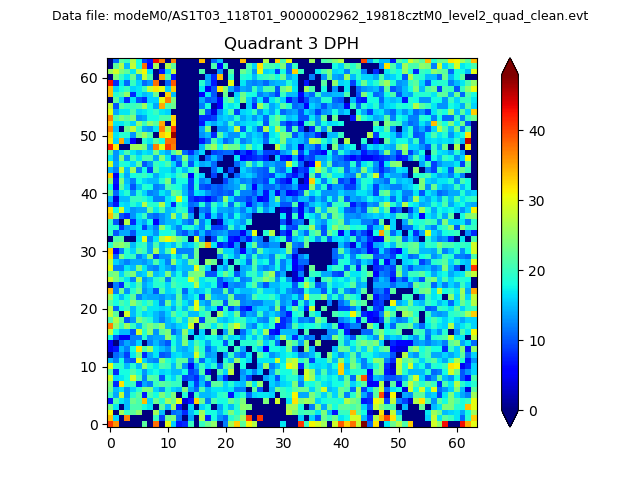 |
 |
Quadrant C |
| Plot type | Count rate plots | Images |
|---|---|---|
| Comparison with Poisson distribution Blue bars denote a histogram of data divided into 1 sec bins. Red curve is a Poisson curve with rate = median count rate of data. |
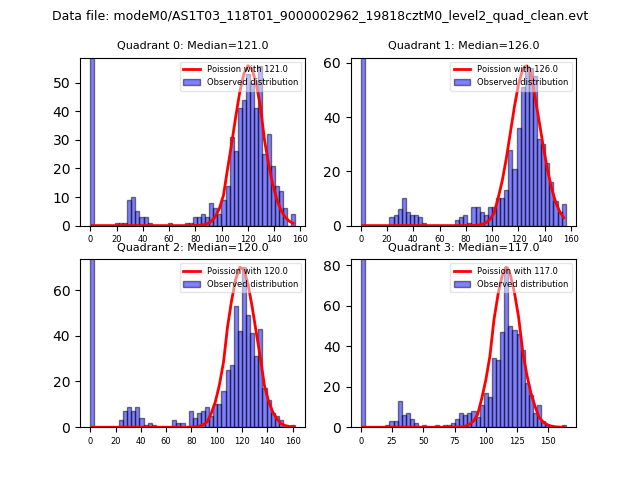 |
 |
| Quadrant-wise count rates Data is divided into 100 sec bins |
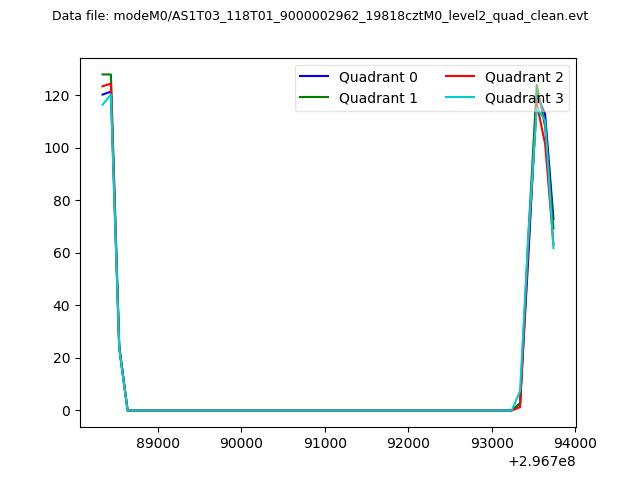 |
|
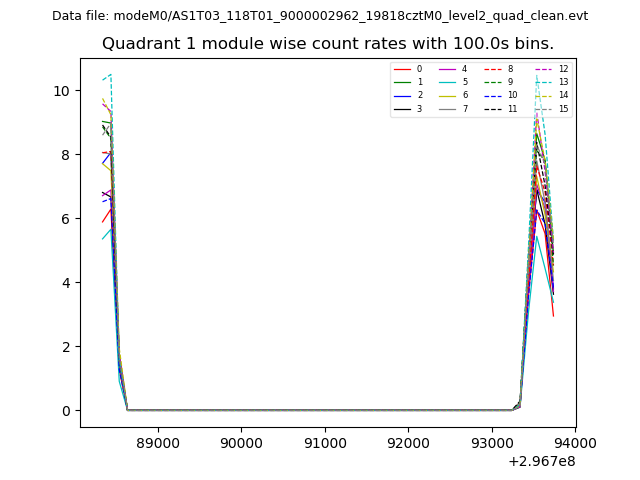
| Module-wise count rates for Quadrant A Data is divided into 100 sec bins |
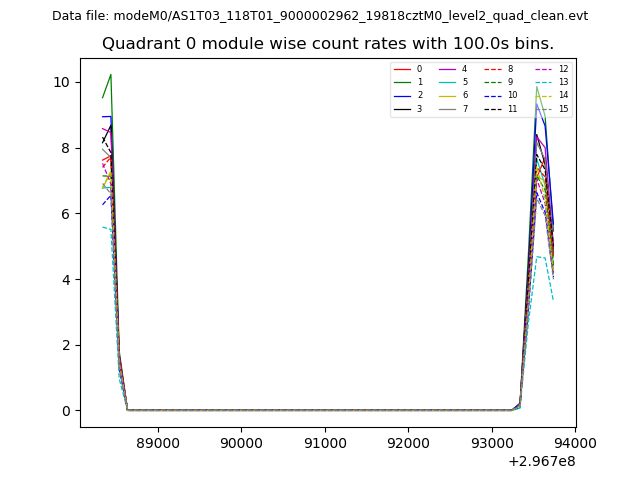 |
 |
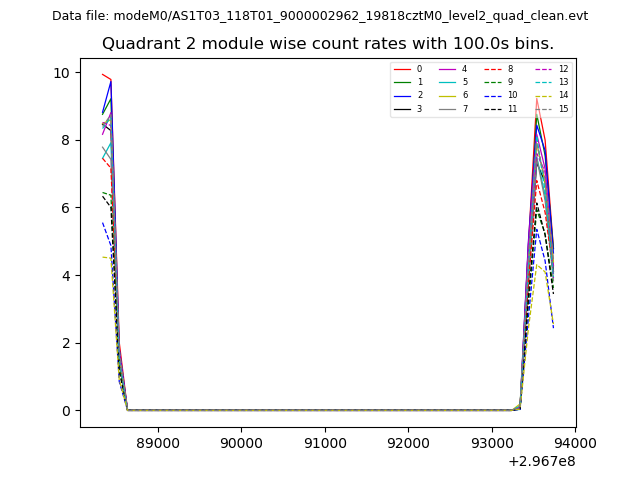
| Module-wise count rates for Quadrant B Data is divided into 100 sec bins |
 |
 |
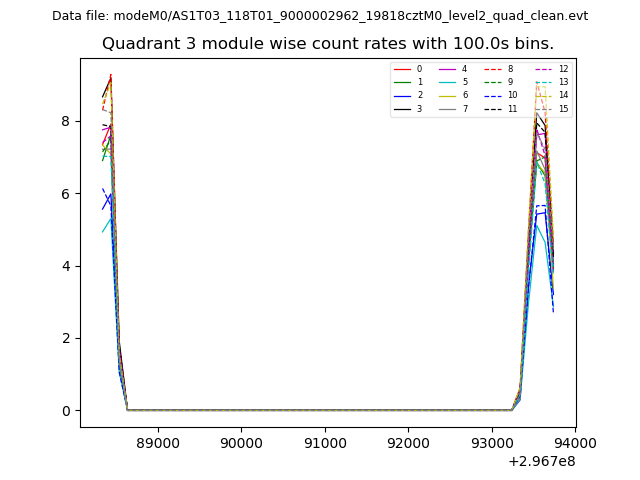
| Module-wise count rates for Quadrant C Data is divided into 100 sec bins |
 |
 |
| Module-wise count rates for Quadrant D Data is divided into 100 sec bins |
 |
 |
| Parameter | Plot |
|---|---|
| CZT HV Monitor | 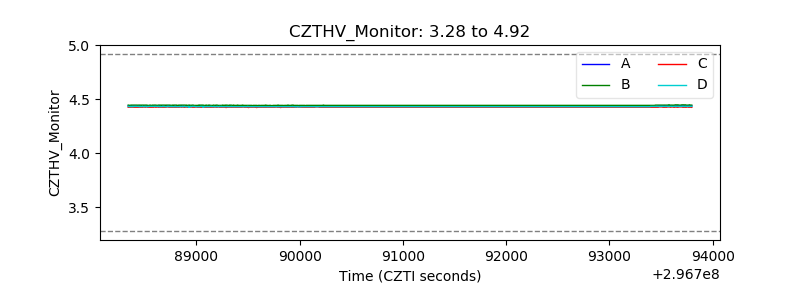 |
| D_VDD | 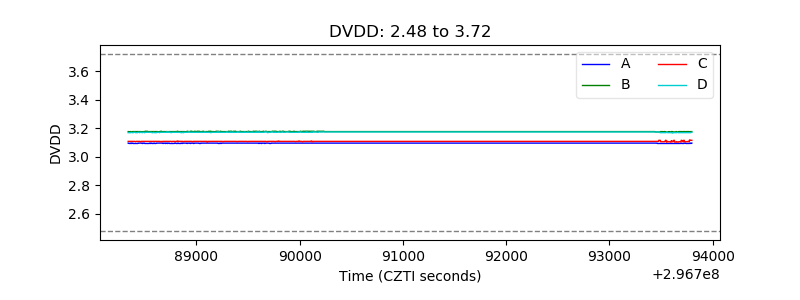 |
| Temperature 1 |  |
| Veto HV Monitor | 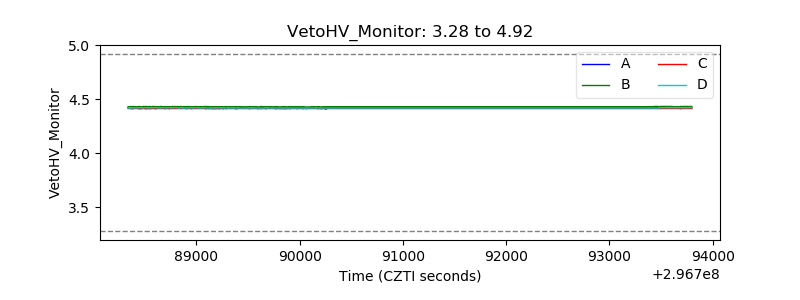 |
| Veto LLD | 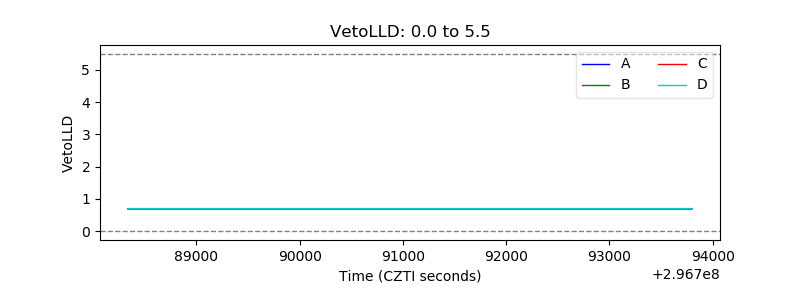 |
| Alpha Counter | 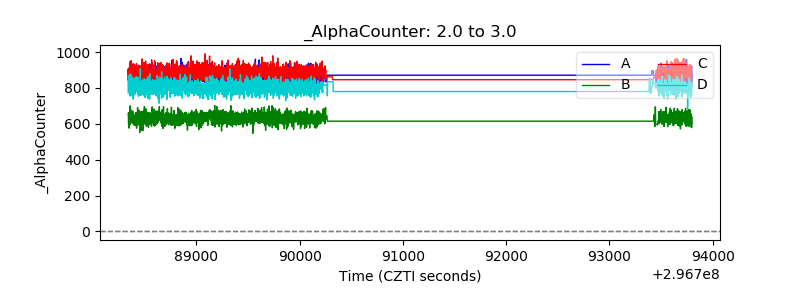 |
| _CPM_Rate | 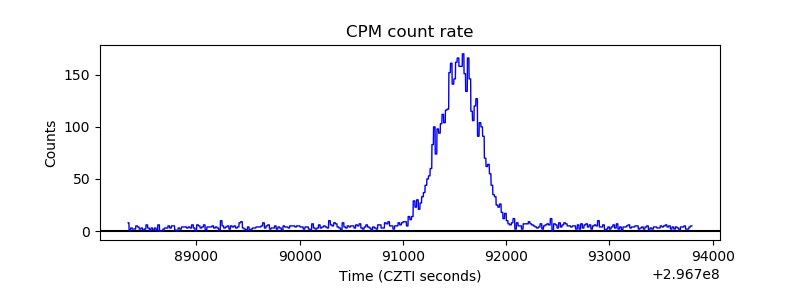 |
| CZT Counter | 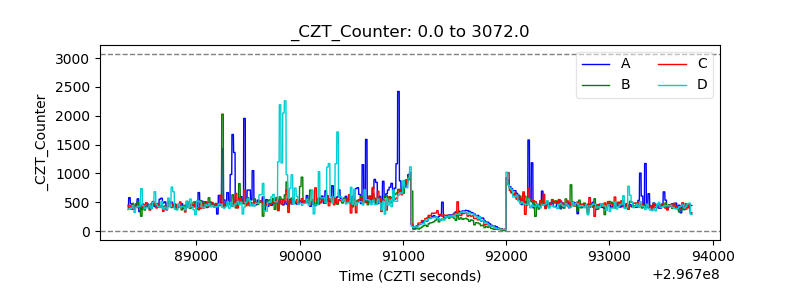 |
| +2.5 Volts monitor |  |
| +5 Volts monitor |  |
| _ROLL_ROT | 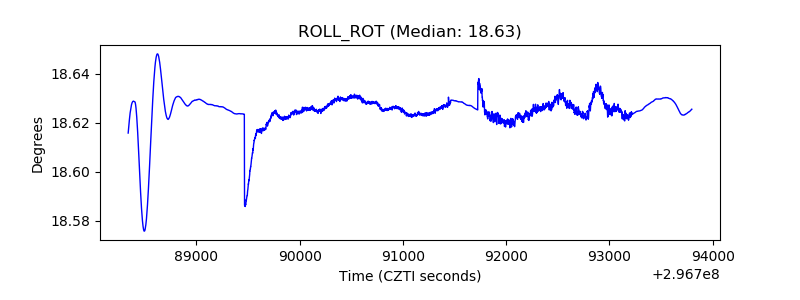 |
| _Roll_DEC | 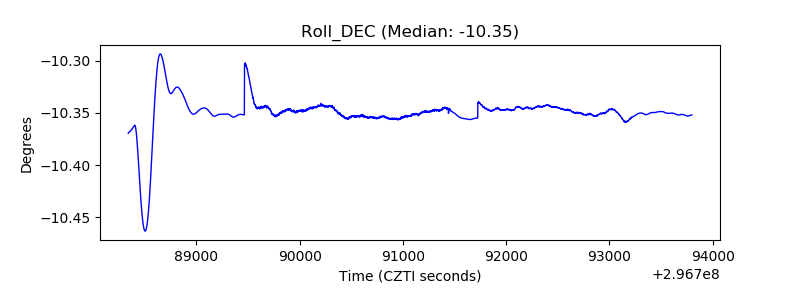 |
| _Roll_RA | 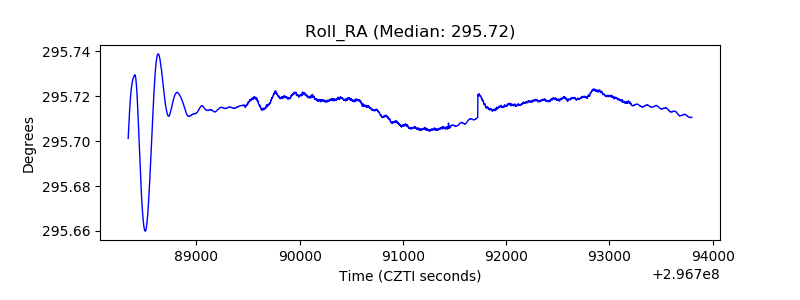 |
| Veto Counter | 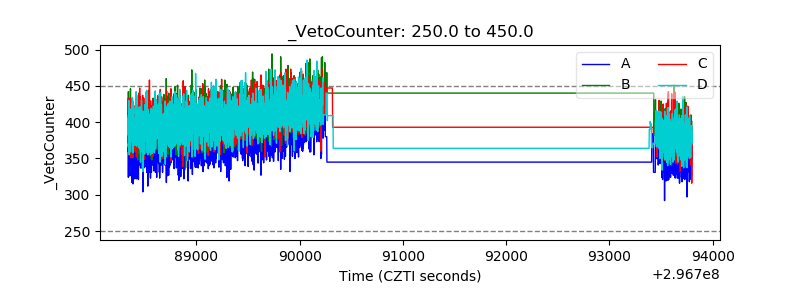 |