| Param | Original file | Final file |
|---|---|---|
| Filename | modeM0/AS1T03_118T01_9000002962_19821cztM0_level2.evt | modeM0/AS1T03_118T01_9000002962_19821cztM0_level2_quad_clean.evt |
| Size (bytes) | 541,592,640 | 86,184,000 |
| Size | 516.5 MB | 82.2 MB |
| Events in quadrant A | 3,566,686 | 543,111 |
| Events in quadrant B | 3,420,803 | 554,822 |
| Events in quadrant C | 3,344,839 | 530,268 |
| Events in quadrant D | 5,586,822 | 485,588 |
| Mode SS | |||
|---|---|---|---|
| Quadrant | BADHDUFLAG | Total packets | Discarded packets |
| A | 0 | 146 | 0 |
| B | 0 | 146 | 0 |
| C | 0 | 146 | 0 |
| D | 0 | 146 | 0 |
| Mode M9 | |||
|---|---|---|---|
| Quadrant | BADHDUFLAG | Total packets | Discarded packets |
| A | 0 | 2 | 0 |
| B | 0 | 2 | 0 |
| C | 0 | 2 | 0 |
| D | 0 | 2 | 0 |
| Mode M0 | |||
|---|---|---|---|
| Quadrant | BADHDUFLAG | Total packets | Discarded packets |
| A | 0 | 15268 | 1 |
| B | 0 | 14728 | 1 |
| C | 0 | 14552 | 1 |
| D | 0 | 21408 | 1 |
| Quadrant | Total seconds | Saturated seconds | Saturation percentage |
|---|---|---|---|
| A | 7106 | 197 | 2.772305% |
| B | 7107 | 177 | 2.490502% |
| C | 7107 | 170 | 2.392008% |
| D | 7106 | 743 | 10.455953% |
Noise dominated data is calculated using 1-second bins in cleaned event files. If a bin has >2000 counts, and if more than 50% of those come from <1% of pixels, then it is considered to be noise-dominated and hence unusable.
| Quadrant | # 1 sec bins | Bins with >0 counts | Bins with >2000 counts | High rate bins dominated by noise | Noise dominated (total time) | Noise dominated (detector-on time) | Marked lightcurve |
|---|---|---|---|---|---|---|---|
| A | 7342 | 7107 | 12 | 12 | 0.16% | 0.17% | 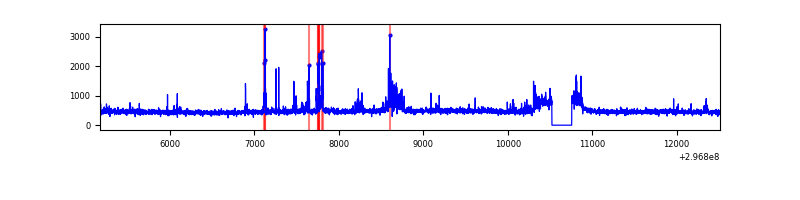 |
| B | 7343 | 7108 | 2 | 2 | 0.03% | 0.03% | 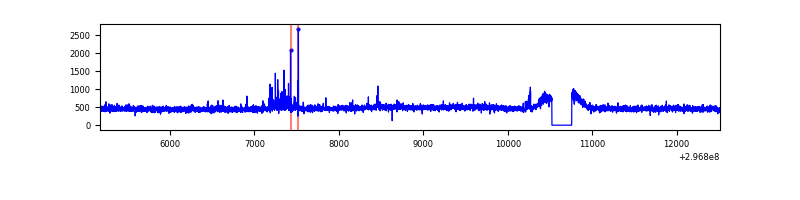 |
| C | 7343 | 7108 | 0 | 0 | 0.00% | 0.00% |  |
| D | 7342 | 7107 | 534 | 534 | 7.27% | 7.51% | 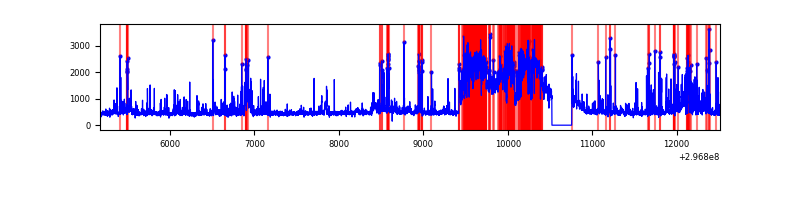 |
Top three noisy pixels from each quadrant. If the there are fewer than three noisy pixels in the level2.evt file, extra rows are filled as -1
| Pixel properties | Quadrant properties | ||||||
|---|---|---|---|---|---|---|---|
| Quadrant | DetID | PixID | Counts | Sigma | Mean | Median | Sigma |
| A | 9 | 143 | 179048 | 1015.01 | 858 | 837 | 175.6 |
| A | 14 | 238 | 62051 | 348.65 | 858 | 837 | 175.6 |
| A | 5 | 16 | 11008 | 57.93 | 858 | 837 | 175.6 |
| B | 7 | 220 | 47027 | 279.06 | 854 | 833 | 165.5 |
| B | 12 | 111 | 20489 | 118.74 | 854 | 833 | 165.5 |
| B | 11 | 111 | 18045 | 103.98 | 854 | 833 | 165.5 |
| C | 14 | 238 | 126633 | 647.97 | 825 | 829 | 194.2 |
| C | 13 | 61 | 5634 | 24.75 | 825 | 829 | 194.2 |
| C | 3 | 233 | 2207 | 7.1 | 825 | 829 | 194.2 |
| D | 12 | 33 | 1515438 | 7662.47 | 811 | 786 | 197.7 |
| D | 1 | 52 | 799447 | 4040.34 | 811 | 786 | 197.7 |
| D | 7 | 238 | 154741 | 778.84 | 811 | 786 | 197.7 |
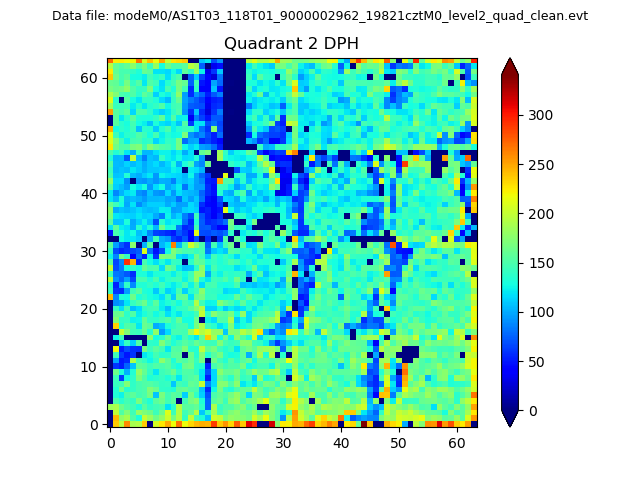
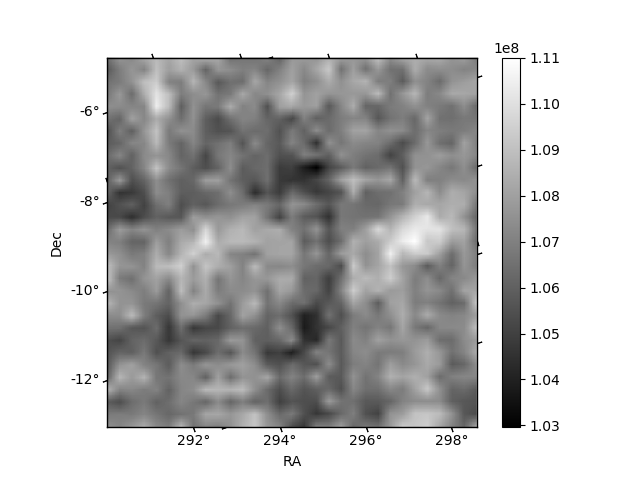
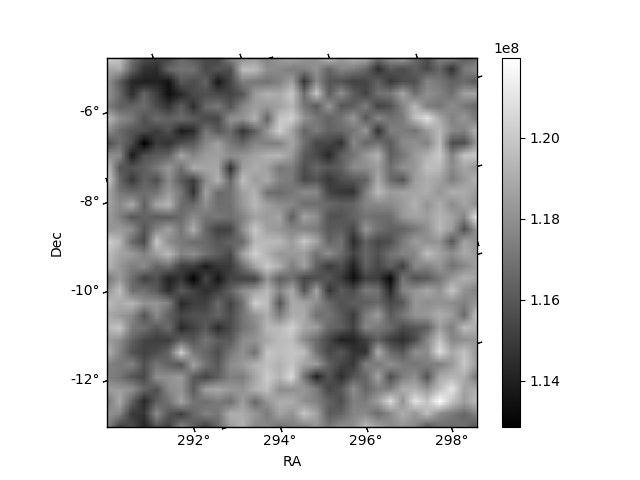
Histogram calculated using DETX and DETY for each event in the final _common_clean file
| Quadrant A | 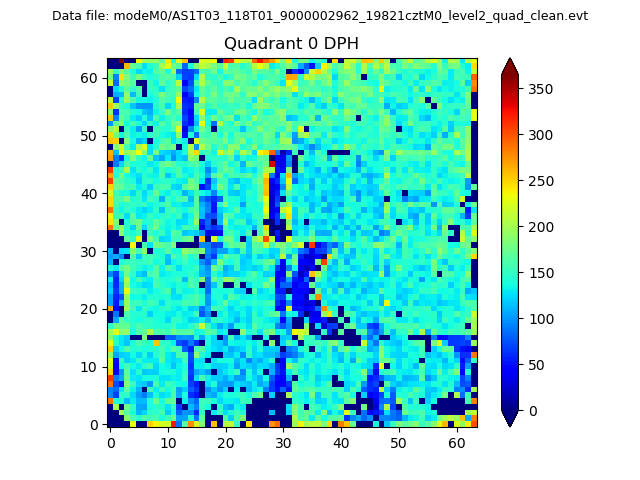 |
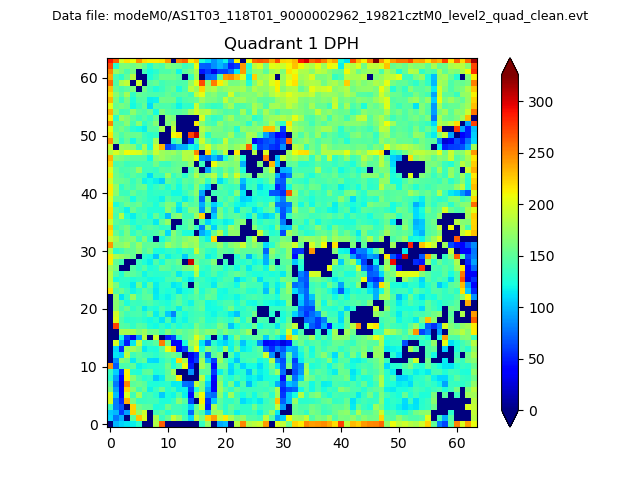 |
Quadrant B |
|---|---|---|---|
| Quadrant D | 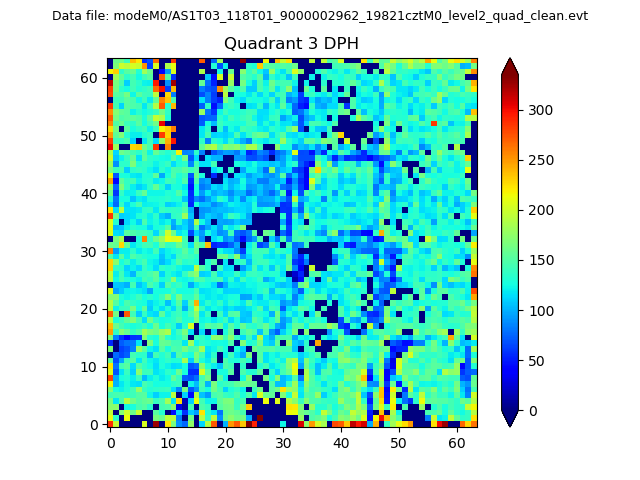 |
 |
Quadrant C |
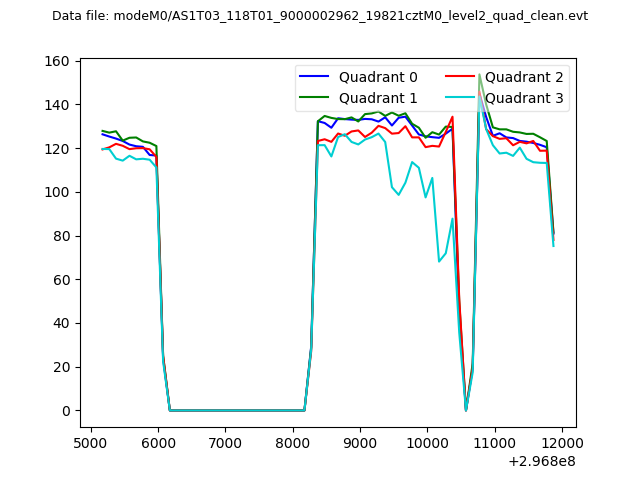
| Plot type | Count rate plots | Images |
|---|---|---|
| Comparison with Poisson distribution Blue bars denote a histogram of data divided into 1 sec bins. Red curve is a Poisson curve with rate = median count rate of data. |
 |
 |
| Quadrant-wise count rates Data is divided into 100 sec bins |
 |
|
| Module-wise count rates for Quadrant A Data is divided into 100 sec bins |
 |
 |
| Module-wise count rates for Quadrant B Data is divided into 100 sec bins |
 |
 |
| Module-wise count rates for Quadrant C Data is divided into 100 sec bins |
 |
 |
| Module-wise count rates for Quadrant D Data is divided into 100 sec bins |
 |
 |
| Parameter | Plot |
|---|---|
| CZT HV Monitor |  |
| D_VDD | 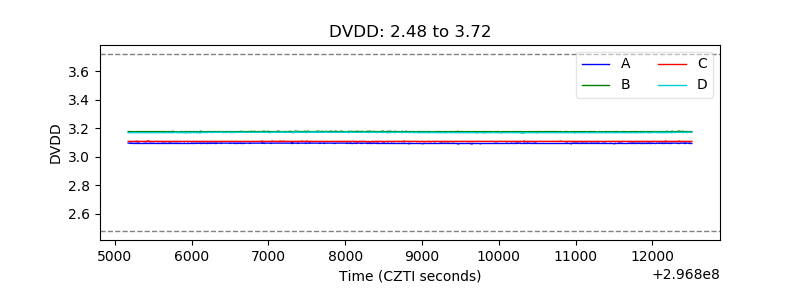 |
| Temperature 1 | 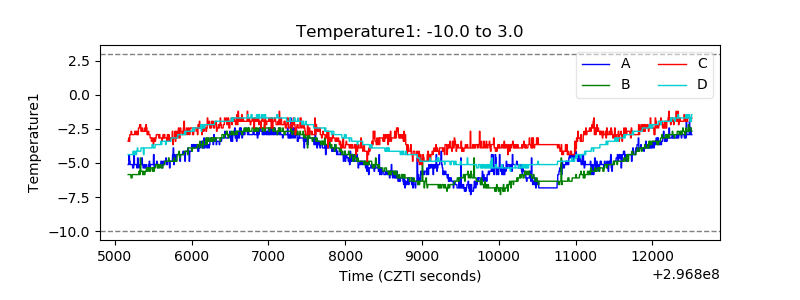 |
| Veto HV Monitor | 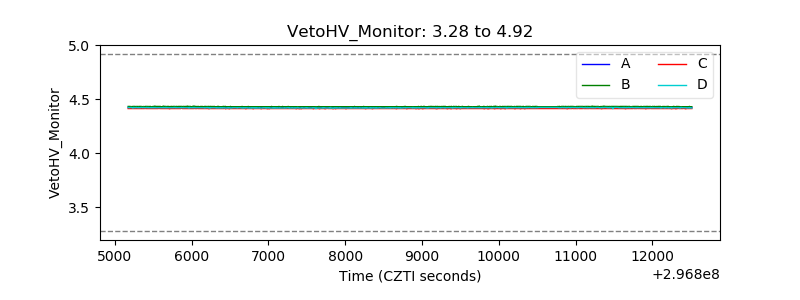 |
| Veto LLD |  |
| Alpha Counter | 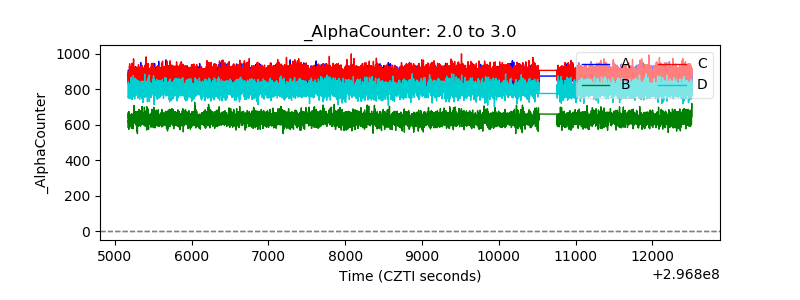 |
| _CPM_Rate | 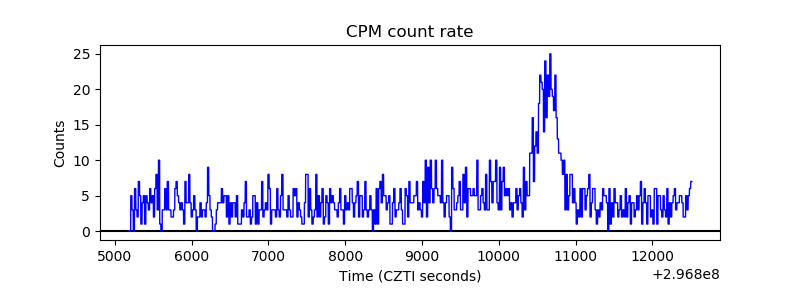 |
| CZT Counter | 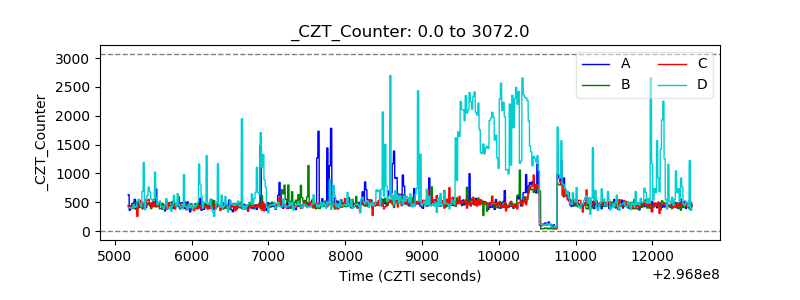 |
| +2.5 Volts monitor |  |
| +5 Volts monitor | 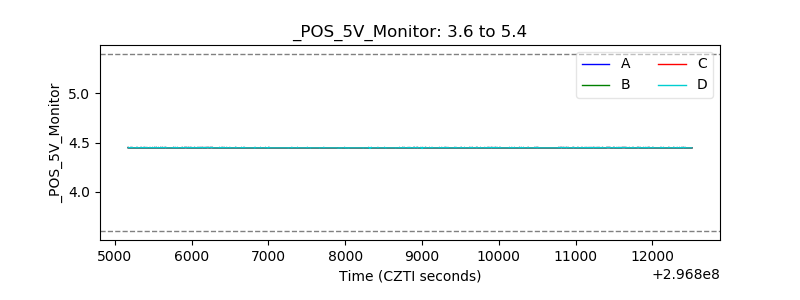 |
| _ROLL_ROT | 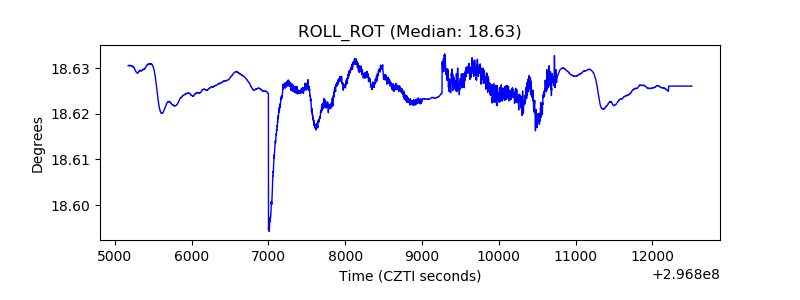 |
| _Roll_DEC | 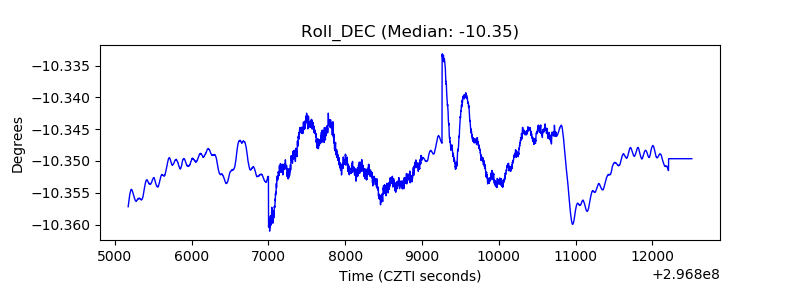 |
| _Roll_RA | 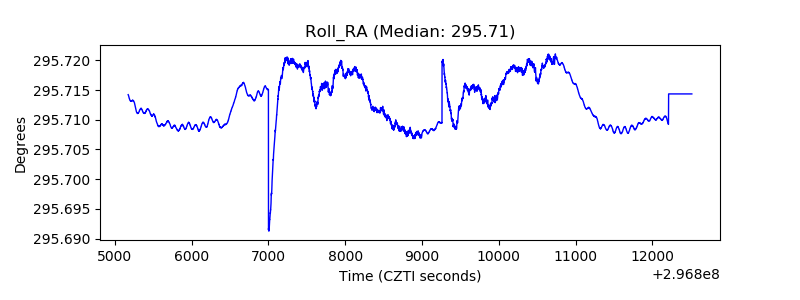 |
| Veto Counter |  |