| Param | Original file | Final file |
|---|---|---|
| Filename | modeM0/AS1T03_118T01_9000002962_19824cztM0_level2.evt | modeM0/AS1T03_118T01_9000002962_19824cztM0_level2_quad_clean.evt |
| Size (bytes) | 1,303,583,040 | 202,363,200 |
| Size | 1.2 GB | 193.0 MB |
| Events in quadrant A | 9,303,974 | 1,254,325 |
| Events in quadrant B | 9,169,453 | 1,255,878 |
| Events in quadrant C | 8,513,091 | 1,202,417 |
| Events in quadrant D | 11,273,259 | 1,172,332 |
| Mode SS | |||
|---|---|---|---|
| Quadrant | BADHDUFLAG | Total packets | Discarded packets |
| A | 0 | 366 | 0 |
| B | 0 | 366 | 0 |
| C | 0 | 366 | 0 |
| D | 0 | 366 | 0 |
| Mode M9 | |||
|---|---|---|---|
| Quadrant | BADHDUFLAG | Total packets | Discarded packets |
| A | 0 | 19 | 0 |
| B | 0 | 19 | 0 |
| C | 0 | 19 | 0 |
| D | 0 | 19 | 0 |
| Mode M0 | |||
|---|---|---|---|
| Quadrant | BADHDUFLAG | Total packets | Discarded packets |
| A | 0 | 39317 | 4 |
| B | 0 | 38679 | 3 |
| C | 0 | 36829 | 3 |
| D | 0 | 45541 | 3 |
| Quadrant | Total seconds | Saturated seconds | Saturation percentage |
|---|---|---|---|
| A | 18046 | 383 | 2.122354% |
| B | 18047 | 342 | 1.895052% |
| C | 18047 | 265 | 1.468388% |
| D | 18047 | 485 | 2.687427% |
Noise dominated data is calculated using 1-second bins in cleaned event files. If a bin has >2000 counts, and if more than 50% of those come from <1% of pixels, then it is considered to be noise-dominated and hence unusable.
| Quadrant | # 1 sec bins | Bins with >0 counts | Bins with >2000 counts | High rate bins dominated by noise | Noise dominated (total time) | Noise dominated (detector-on time) | Marked lightcurve |
|---|---|---|---|---|---|---|---|
| A | 19901 | 18046 | 80 | 80 | 0.40% | 0.44% | 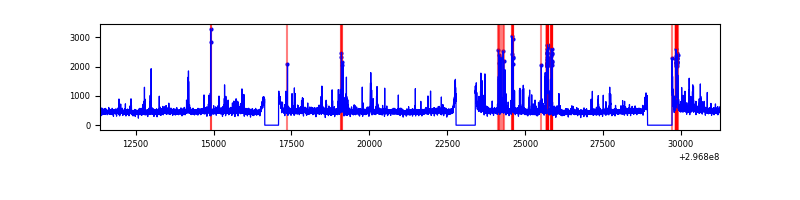 |
| B | 19902 | 18047 | 66 | 66 | 0.33% | 0.37% | 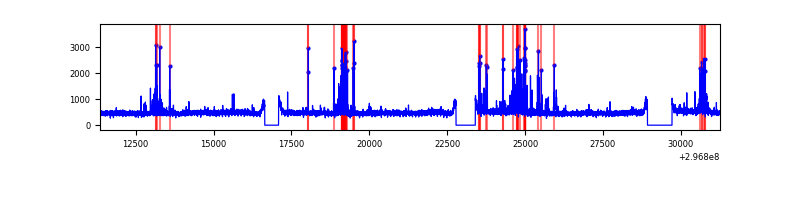 |
| C | 19902 | 18047 | 0 | 0 | 0.00% | 0.00% |  |
| D | 19902 | 18047 | 232 | 232 | 1.17% | 1.29% | 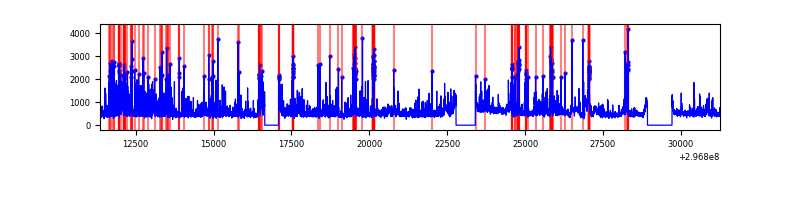 |
Top three noisy pixels from each quadrant. If the there are fewer than three noisy pixels in the level2.evt file, extra rows are filled as -1
| Pixel properties | Quadrant properties | ||||||
|---|---|---|---|---|---|---|---|
| Quadrant | DetID | PixID | Counts | Sigma | Mean | Median | Sigma |
| A | 14 | 238 | 562236 | 1266.62 | 2184 | 2137 | 442.2 |
| A | 9 | 143 | 171384 | 382.74 | 2184 | 2137 | 442.2 |
| A | 5 | 16 | 69851 | 153.13 | 2184 | 2137 | 442.2 |
| B | 7 | 220 | 350133 | 833.63 | 2175 | 2121 | 417.5 |
| B | 10 | 245 | 187483 | 444.02 | 2175 | 2121 | 417.5 |
| B | 0 | 190 | 55435 | 127.71 | 2175 | 2121 | 417.5 |
| C | 14 | 238 | 321798 | 647.96 | 2099 | 2114 | 493.4 |
| C | 13 | 61 | 14809 | 25.73 | 2099 | 2114 | 493.4 |
| C | 3 | 233 | 6887 | 9.67 | 2099 | 2114 | 493.4 |
| D | 1 | 52 | 2506311 | 4841.07 | 2123 | 2059 | 517.3 |
| D | 7 | 238 | 376096 | 723.07 | 2123 | 2059 | 517.3 |
| D | 12 | 17 | 145780 | 277.83 | 2123 | 2059 | 517.3 |
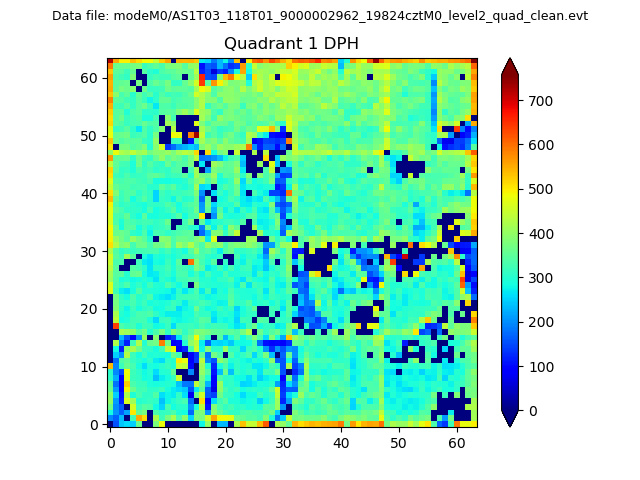
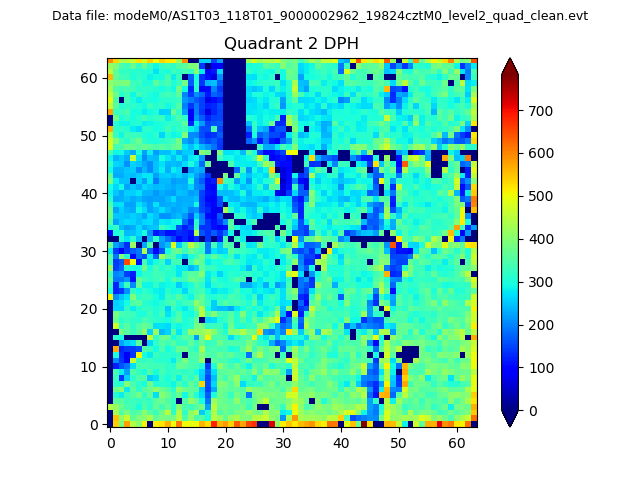
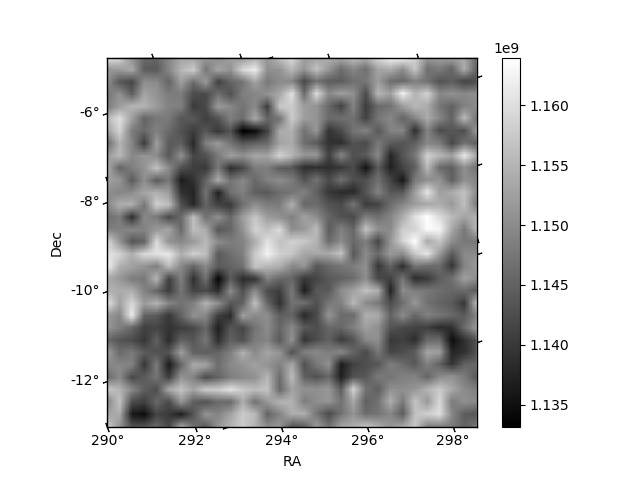
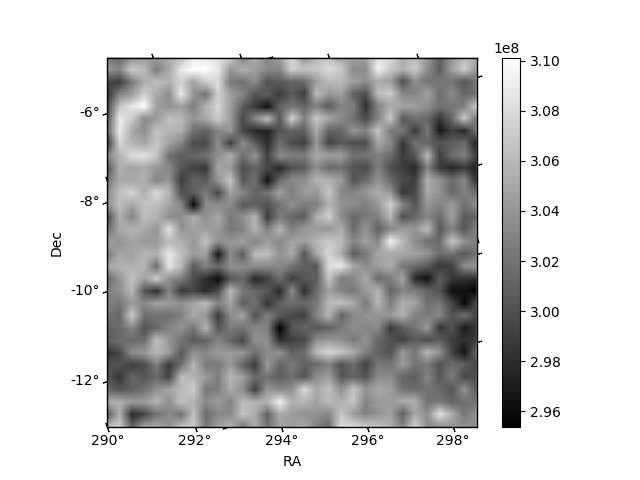
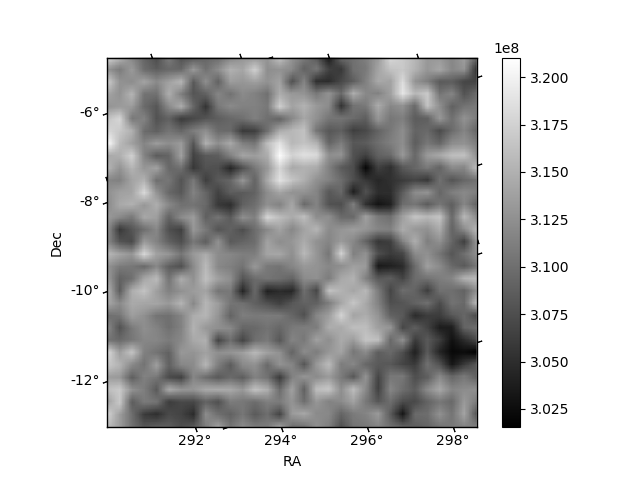
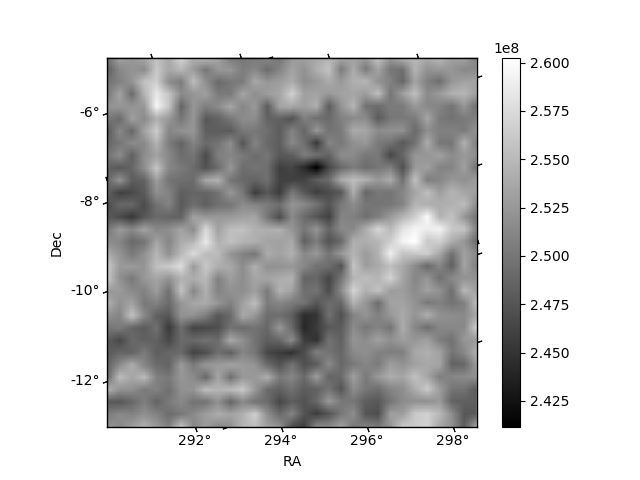
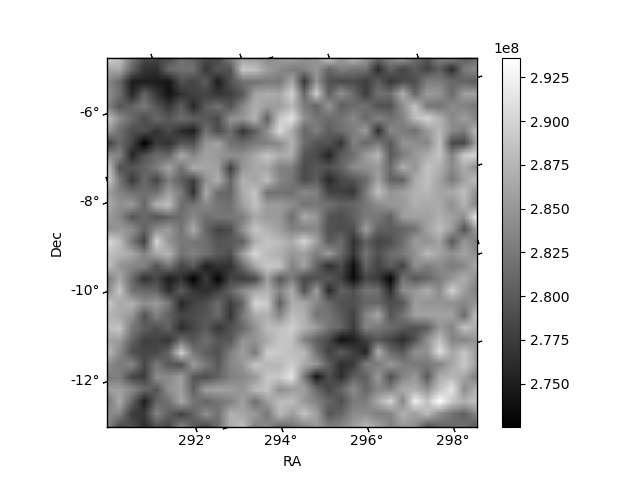
Histogram calculated using DETX and DETY for each event in the final _common_clean file
| Quadrant A | 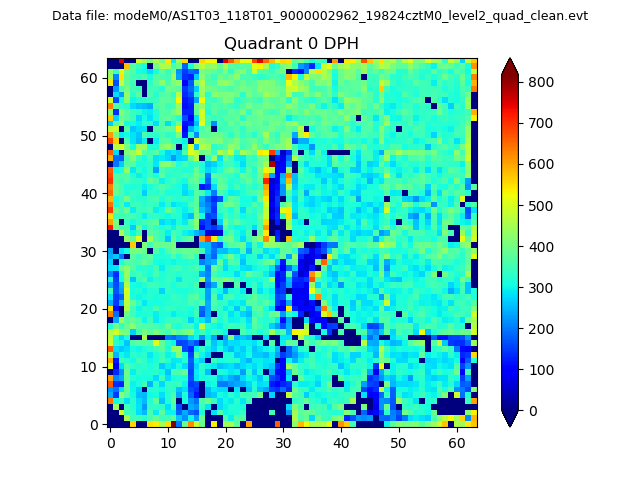 |
 |
Quadrant B |
|---|---|---|---|
| Quadrant D | 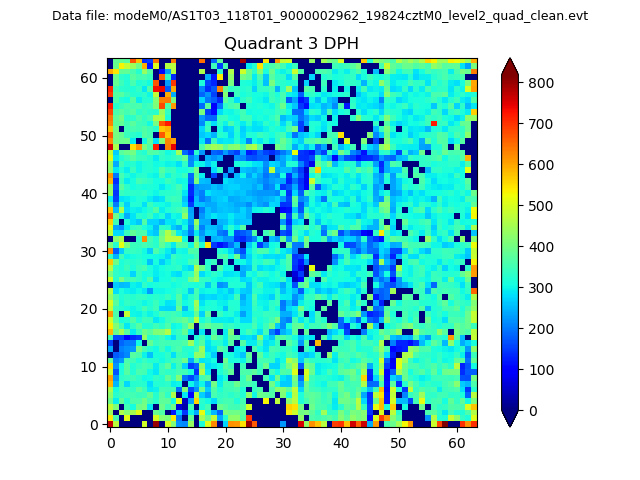 |
 |
Quadrant C |
| Plot type | Count rate plots | Images |
|---|---|---|
| Comparison with Poisson distribution Blue bars denote a histogram of data divided into 1 sec bins. Red curve is a Poisson curve with rate = median count rate of data. |
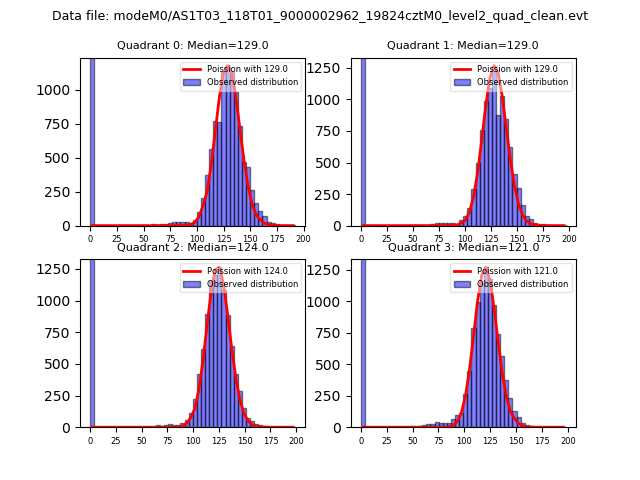 |
 |
| Quadrant-wise count rates Data is divided into 100 sec bins |
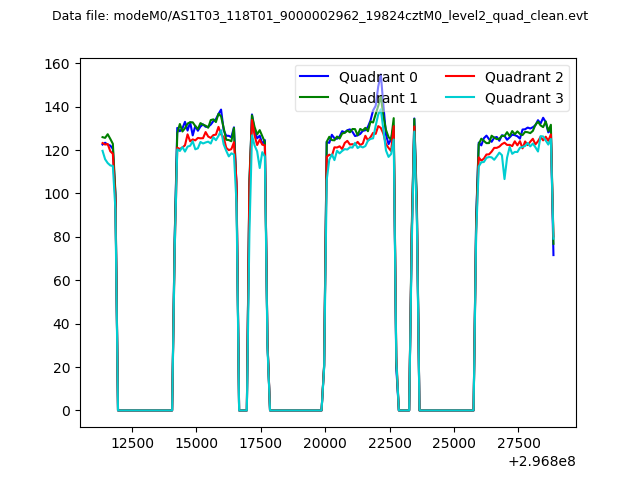 |
|
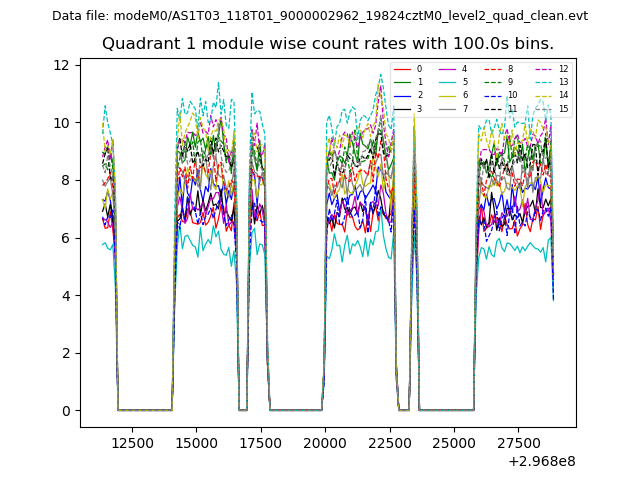
| Module-wise count rates for Quadrant A Data is divided into 100 sec bins |
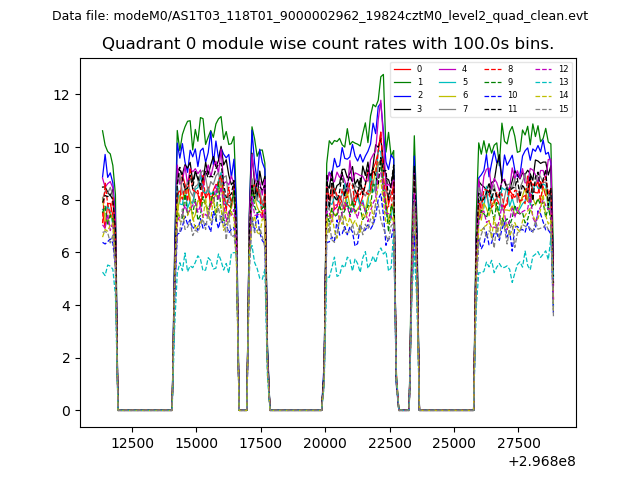 |
 |
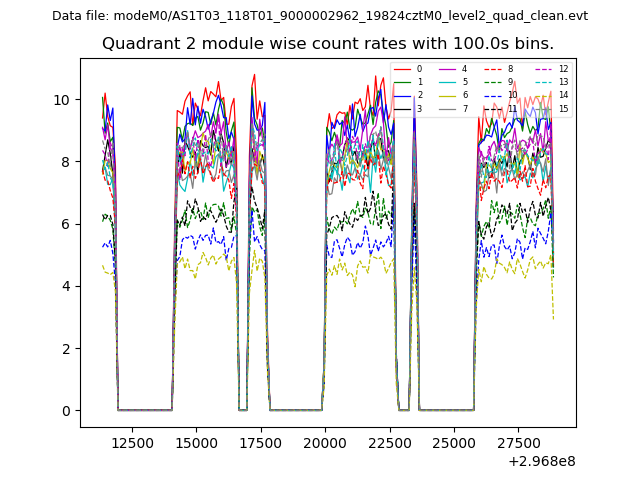
| Module-wise count rates for Quadrant B Data is divided into 100 sec bins |
 |
 |
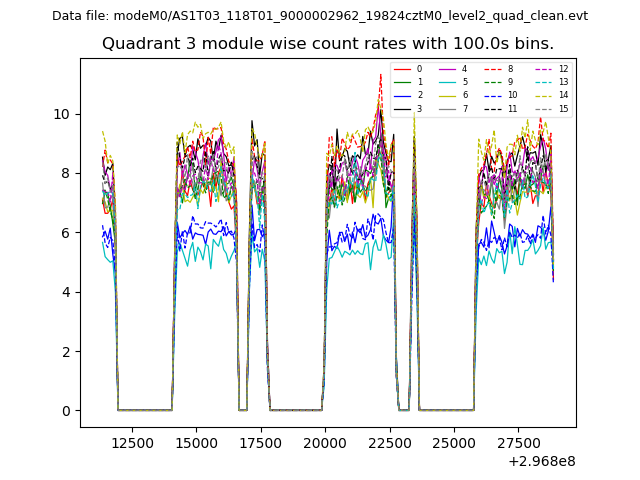
| Module-wise count rates for Quadrant C Data is divided into 100 sec bins |
 |
 |
| Module-wise count rates for Quadrant D Data is divided into 100 sec bins |
 |
 |
| Parameter | Plot |
|---|---|
| CZT HV Monitor | 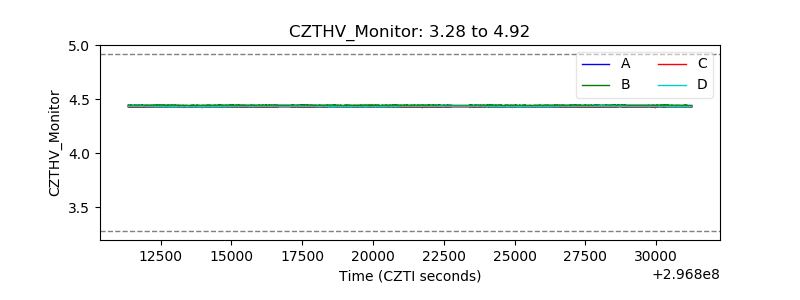 |
| D_VDD | 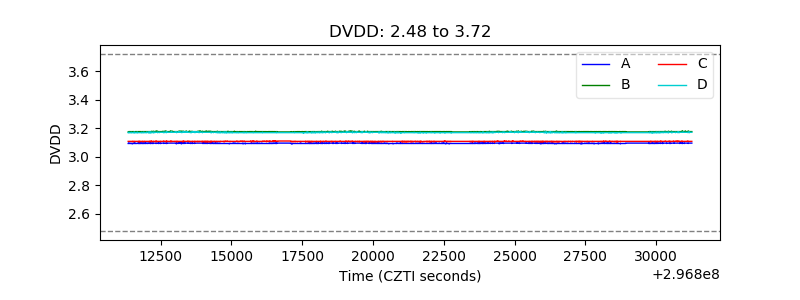 |
| Temperature 1 | 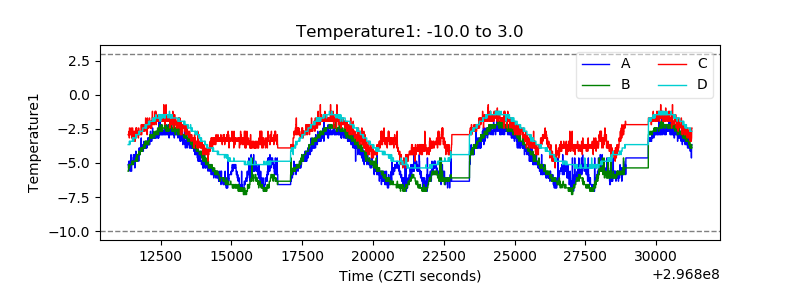 |
| Veto HV Monitor | 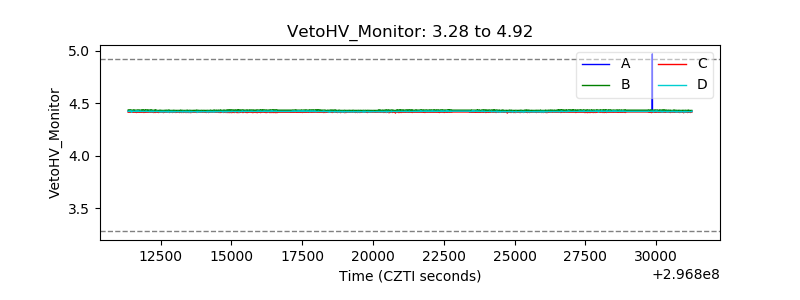 |
| Veto LLD |  |
| Alpha Counter | 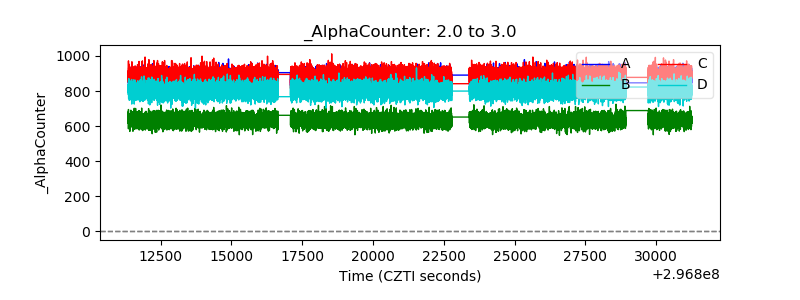 |
| _CPM_Rate | 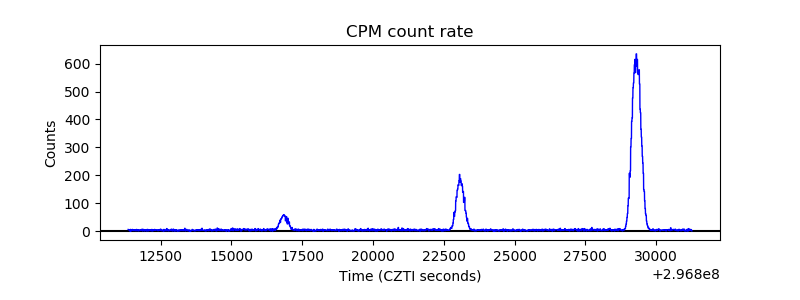 |
| CZT Counter | 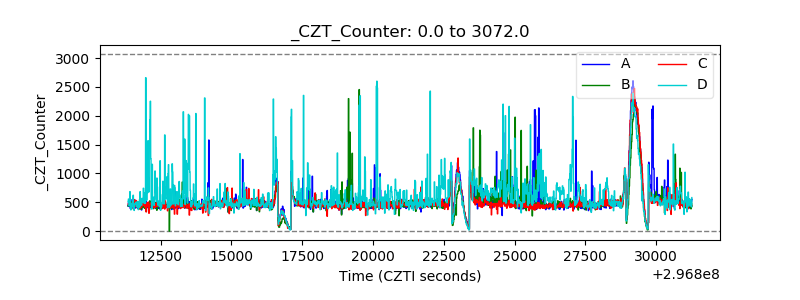 |
| +2.5 Volts monitor |  |
| +5 Volts monitor |  |
| _ROLL_ROT | 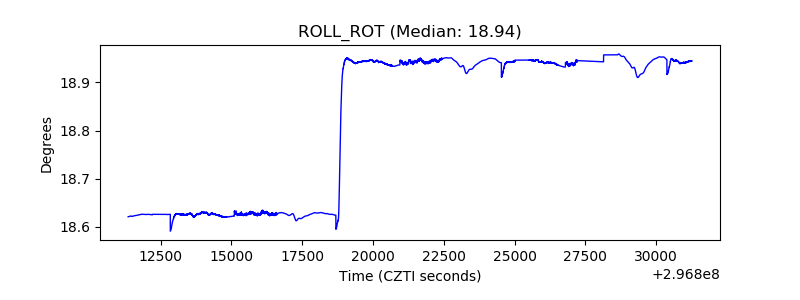 |
| _Roll_DEC | 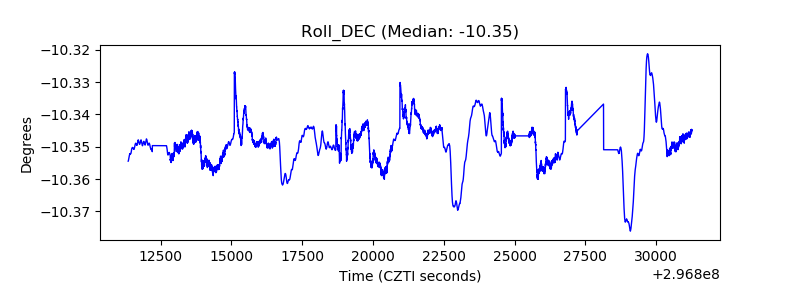 |
| _Roll_RA | 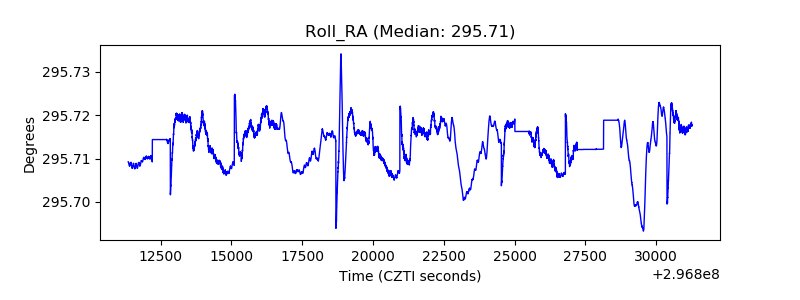 |
| Veto Counter | 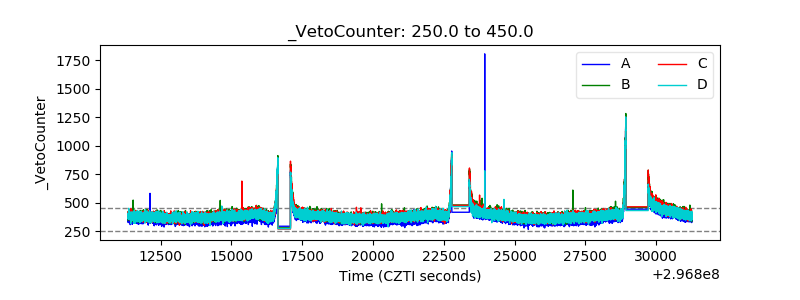 |