| Param | Original file | Final file |
|---|---|---|
| Filename | modeM0/AS1T03_118T01_9000002962_19825cztM0_level2.evt | modeM0/AS1T03_118T01_9000002962_19825cztM0_level2_quad_clean.evt |
| Size (bytes) | 3,173,918,400 | 487,316,160 |
| Size | 3.0 GB | 464.7 MB |
| Events in quadrant A | 22,392,053 | 3,044,329 |
| Events in quadrant B | 21,605,389 | 3,080,075 |
| Events in quadrant C | 20,402,316 | 2,941,154 |
| Events in quadrant D | 28,842,299 | 2,761,589 |
| Mode SS | |||
|---|---|---|---|
| Quadrant | BADHDUFLAG | Total packets | Discarded packets |
| A | 0 | 868 | 0 |
| B | 0 | 868 | 0 |
| C | 0 | 868 | 0 |
| D | 0 | 868 | 0 |
| Mode M9 | |||
|---|---|---|---|
| Quadrant | BADHDUFLAG | Total packets | Discarded packets |
| A | 0 | 39 | 0 |
| B | 0 | 39 | 0 |
| C | 0 | 39 | 0 |
| D | 0 | 39 | 0 |
| Mode M0 | |||
|---|---|---|---|
| Quadrant | BADHDUFLAG | Total packets | Discarded packets |
| A | 0 | 94164 | 8 |
| B | 0 | 91328 | 8 |
| C | 0 | 87754 | 9 |
| D | 0 | 114578 | 8 |
| Quadrant | Total seconds | Saturated seconds | Saturation percentage |
|---|---|---|---|
| A | 42705 | 1071 | 2.507903% |
| B | 42705 | 941 | 2.203489% |
| C | 42704 | 803 | 1.880386% |
| D | 42704 | 2564 | 6.004121% |
Noise dominated data is calculated using 1-second bins in cleaned event files. If a bin has >2000 counts, and if more than 50% of those come from <1% of pixels, then it is considered to be noise-dominated and hence unusable.
| Quadrant | # 1 sec bins | Bins with >0 counts | Bins with >2000 counts | High rate bins dominated by noise | Noise dominated (total time) | Noise dominated (detector-on time) | Marked lightcurve |
|---|---|---|---|---|---|---|---|
| A | 49008 | 42710 | 226 | 226 | 0.46% | 0.53% | 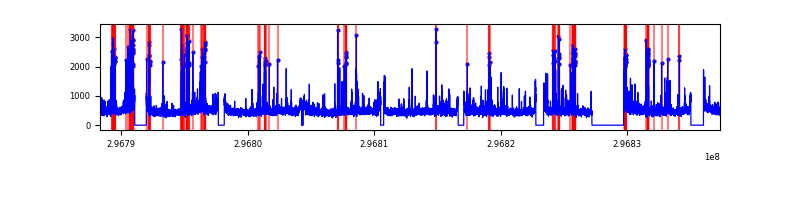 |
| B | 49008 | 42710 | 134 | 134 | 0.27% | 0.31% | 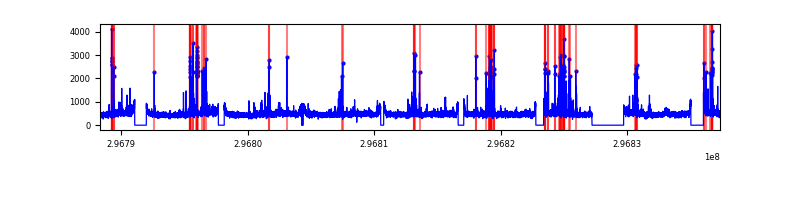 |
| C | 49007 | 42709 | 1 | 1 | 0.00% | 0.00% | 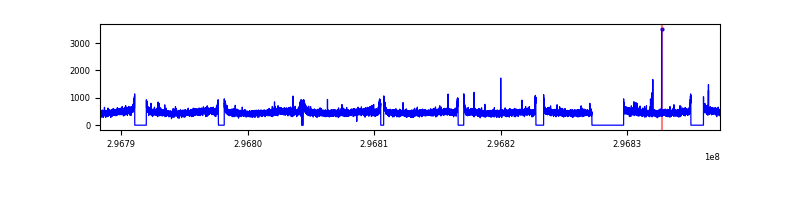 |
| D | 49007 | 42708 | 1737 | 1737 | 3.54% | 4.07% | 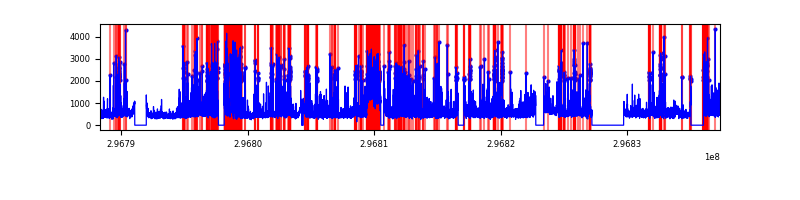 |
Top three noisy pixels from each quadrant. If the there are fewer than three noisy pixels in the level2.evt file, extra rows are filled as -1
| Pixel properties | Quadrant properties | ||||||
|---|---|---|---|---|---|---|---|
| Quadrant | DetID | PixID | Counts | Sigma | Mean | Median | Sigma |
| A | 14 | 238 | 1557911 | 1478.15 | 5217 | 5100 | 1050.5 |
| A | 9 | 143 | 428869 | 403.39 | 5217 | 5100 | 1050.5 |
| A | 14 | 254 | 140506 | 128.9 | 5217 | 5100 | 1050.5 |
| B | 7 | 220 | 761881 | 770.57 | 5195 | 5067 | 982.2 |
| B | 10 | 245 | 198409 | 196.86 | 5195 | 5067 | 982.2 |
| B | 12 | 111 | 122135 | 119.2 | 5195 | 5067 | 982.2 |
| C | 14 | 238 | 771930 | 650.19 | 5022 | 5051 | 1179.5 |
| C | 3 | 233 | 39057 | 28.83 | 5022 | 5051 | 1179.5 |
| C | 13 | 61 | 35055 | 25.44 | 5022 | 5051 | 1179.5 |
| D | 1 | 52 | 6357389 | 5238.35 | 4987 | 4837 | 1212.7 |
| D | 12 | 33 | 1522851 | 1251.76 | 4987 | 4837 | 1212.7 |
| D | 7 | 238 | 841774 | 690.14 | 4987 | 4837 | 1212.7 |
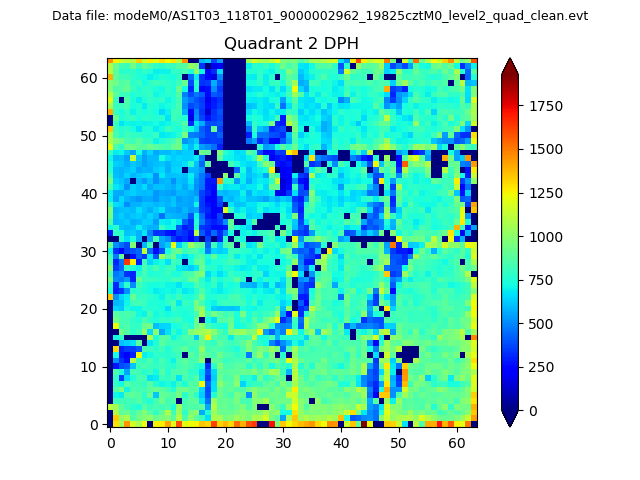
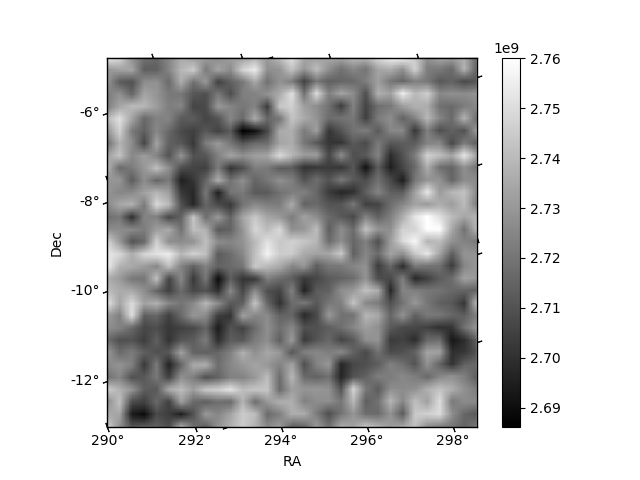
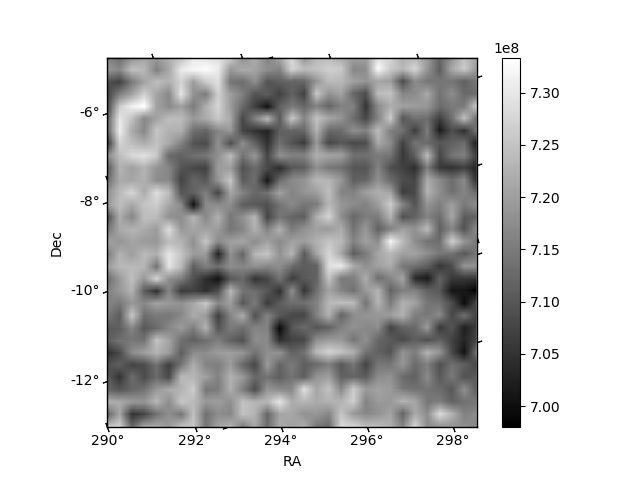
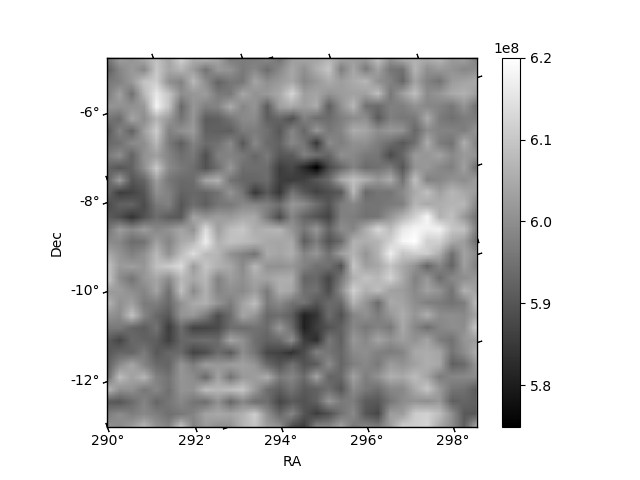
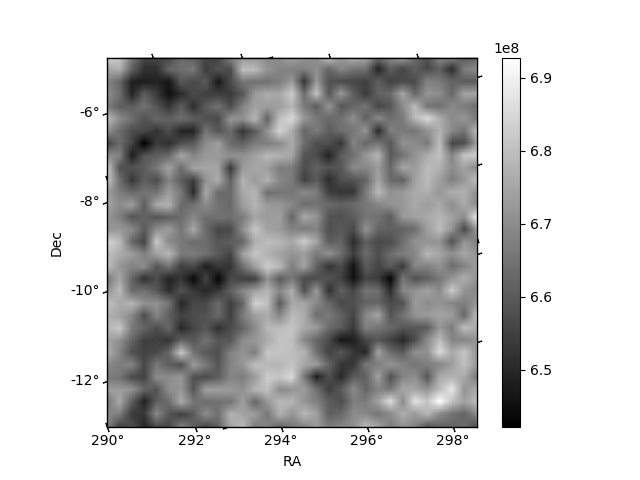
Histogram calculated using DETX and DETY for each event in the final _common_clean file
| Quadrant A | 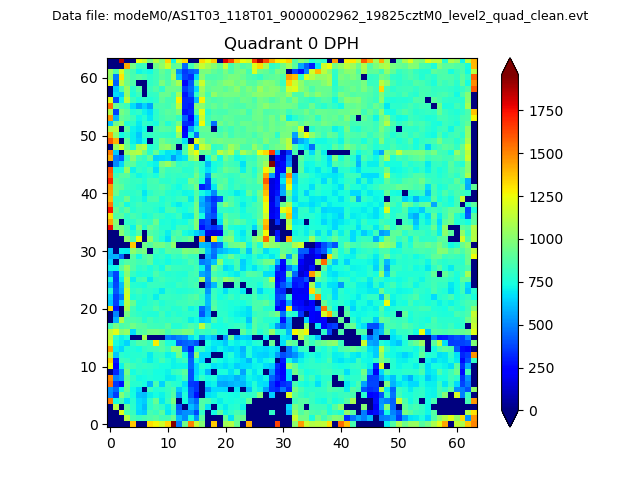 |
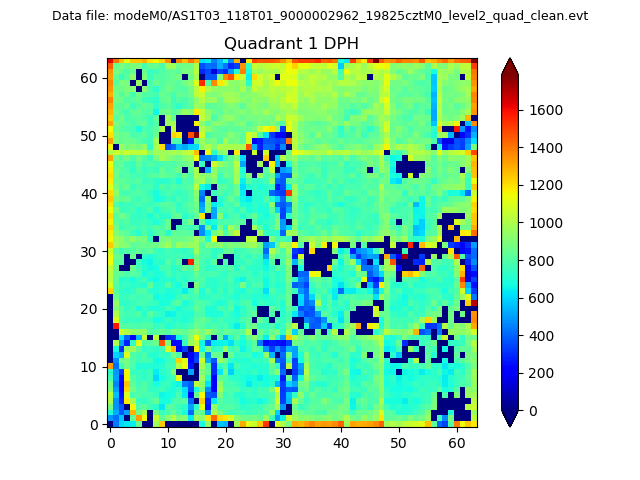 |
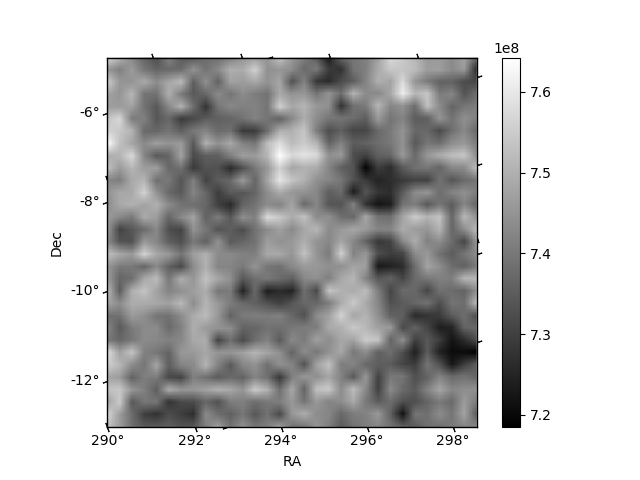
Quadrant B |
|---|---|---|---|
| Quadrant D | 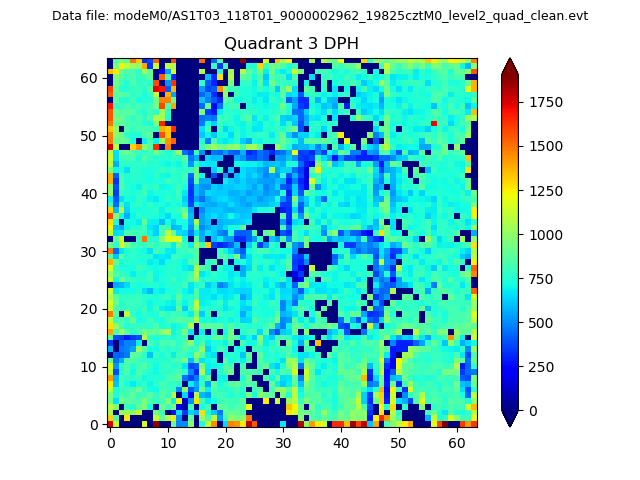 |
 |
Quadrant C |
| Plot type | Count rate plots | Images |
|---|---|---|
| Comparison with Poisson distribution Blue bars denote a histogram of data divided into 1 sec bins. Red curve is a Poisson curve with rate = median count rate of data. |
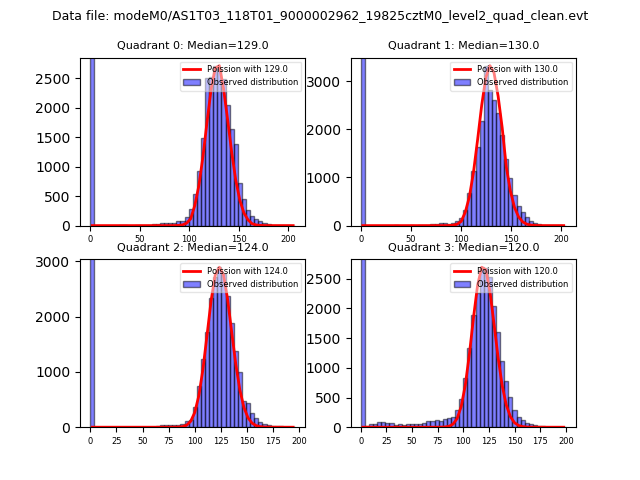 |
 |
| Quadrant-wise count rates Data is divided into 100 sec bins |
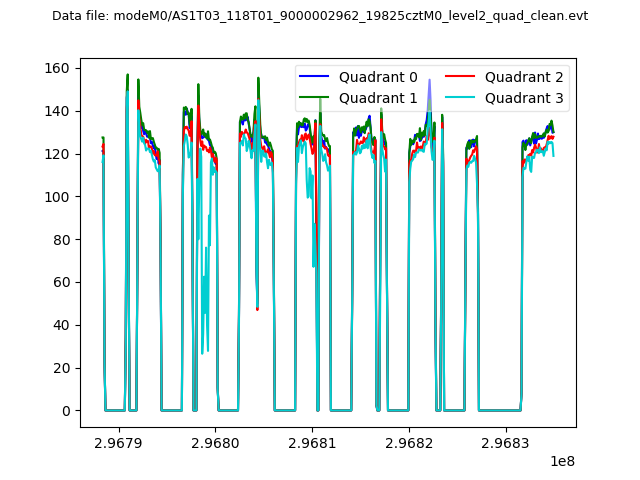 |
|
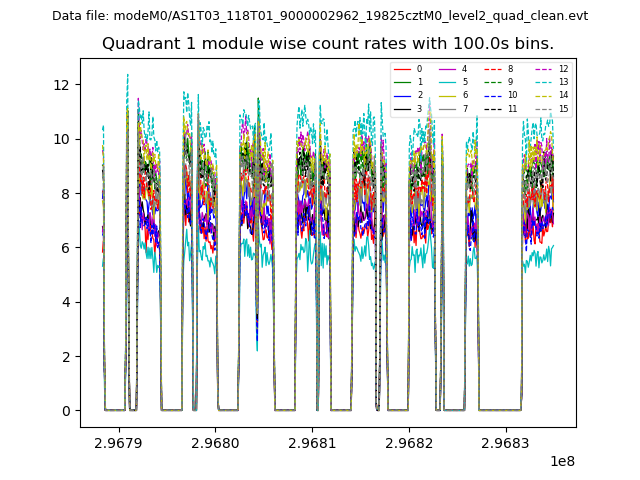
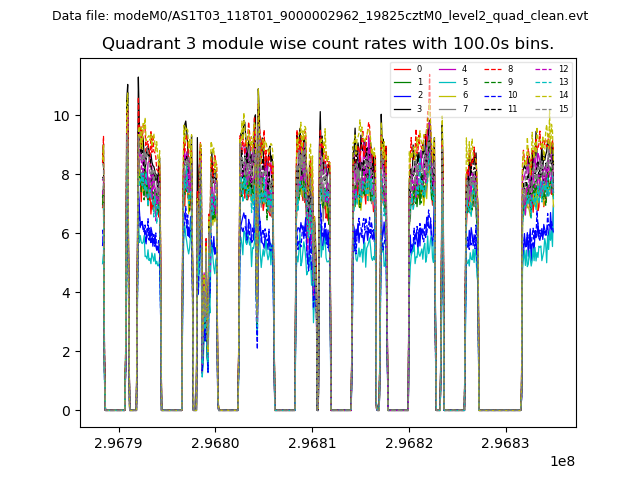
| Module-wise count rates for Quadrant A Data is divided into 100 sec bins |
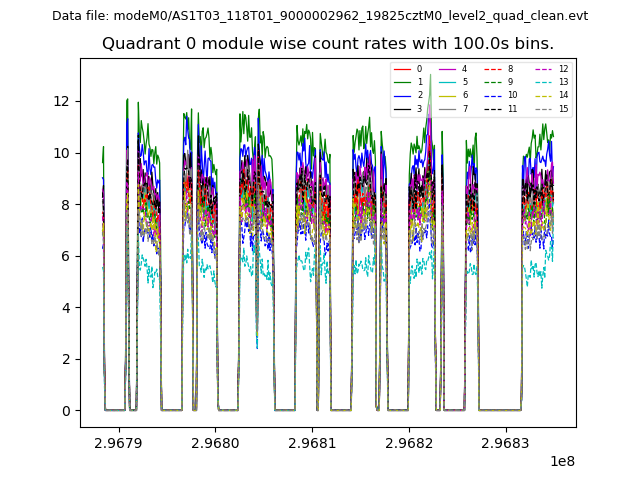 |
 |
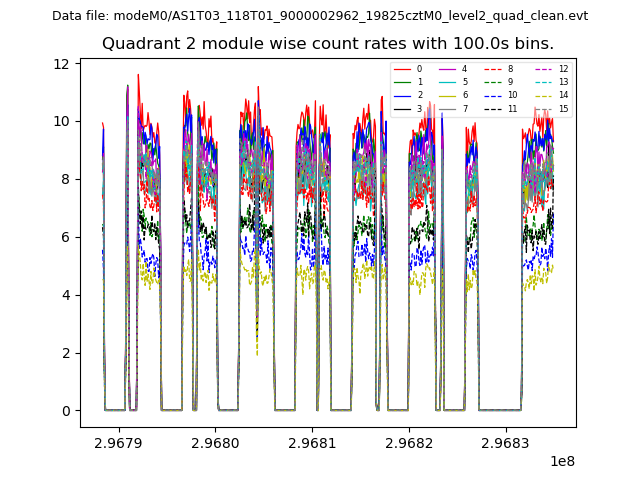
| Module-wise count rates for Quadrant B Data is divided into 100 sec bins |
 |
 |
| Module-wise count rates for Quadrant C Data is divided into 100 sec bins |
 |
 |
| Module-wise count rates for Quadrant D Data is divided into 100 sec bins |
 |
 |
| Parameter | Plot |
|---|---|
| CZT HV Monitor |  |
| D_VDD | 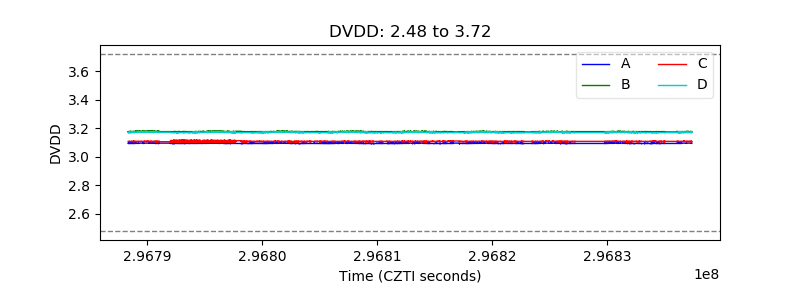 |
| Temperature 1 | 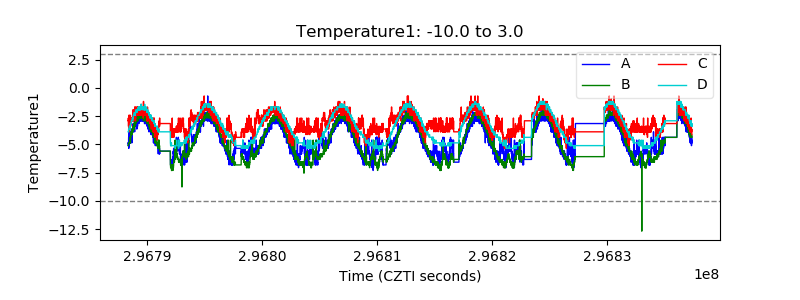 |
| Veto HV Monitor | 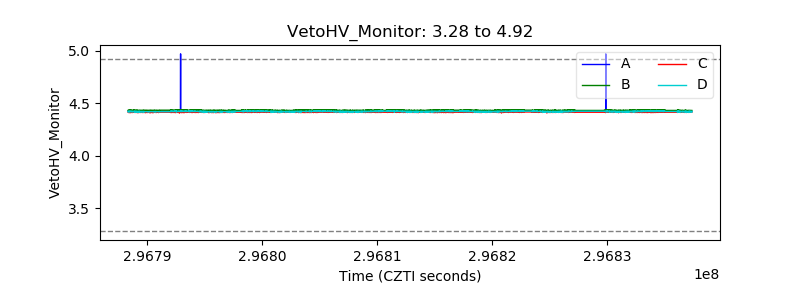 |
| Veto LLD | 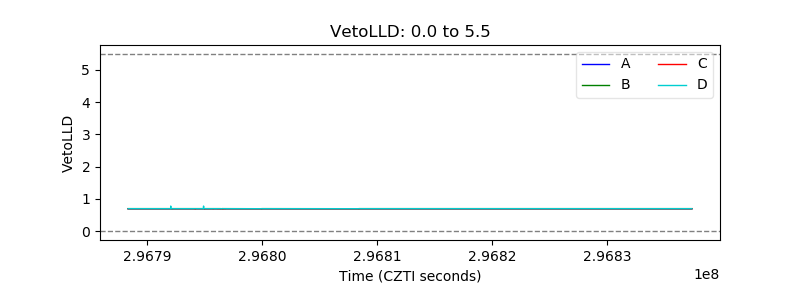 |
| Alpha Counter | 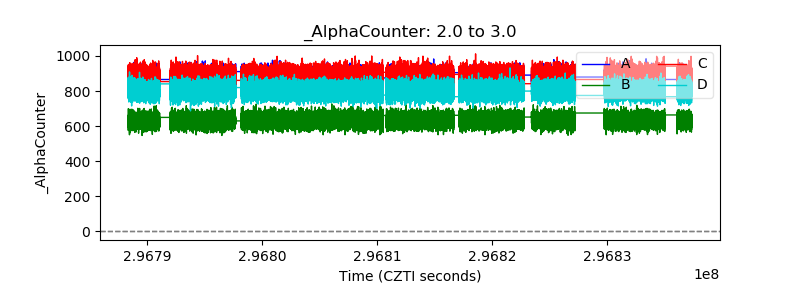 |
| _CPM_Rate | 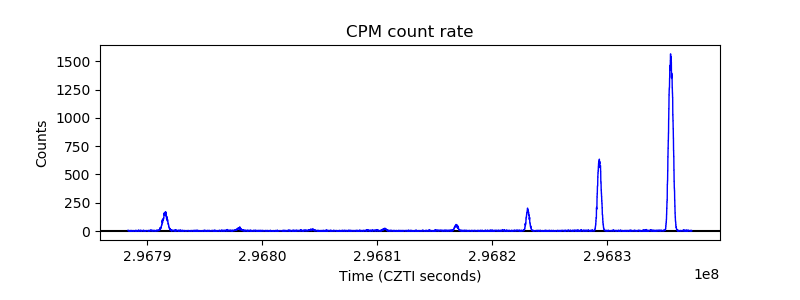 |
| CZT Counter | 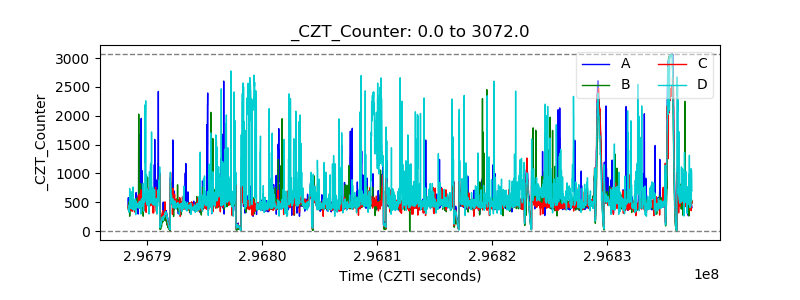 |
| +2.5 Volts monitor |  |
| +5 Volts monitor |  |
| _ROLL_ROT | 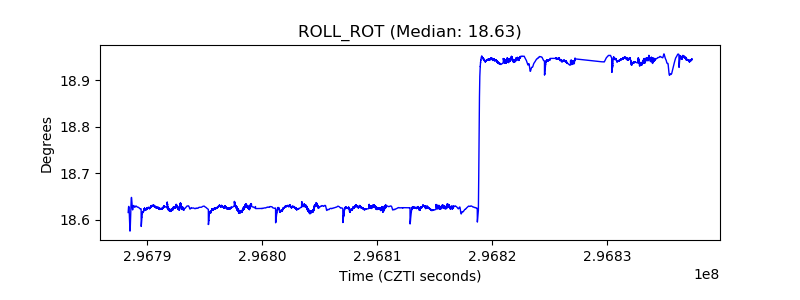 |
| _Roll_DEC | 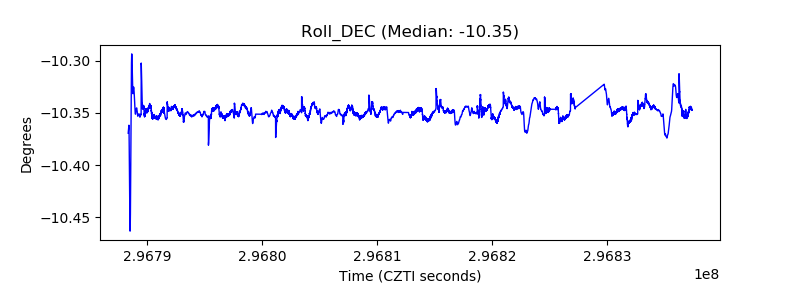 |
| _Roll_RA | 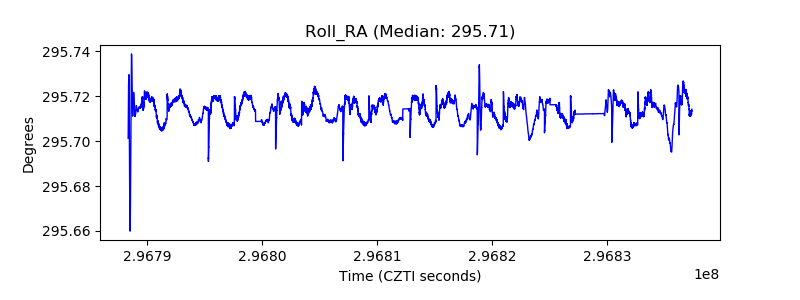 |
| Veto Counter | 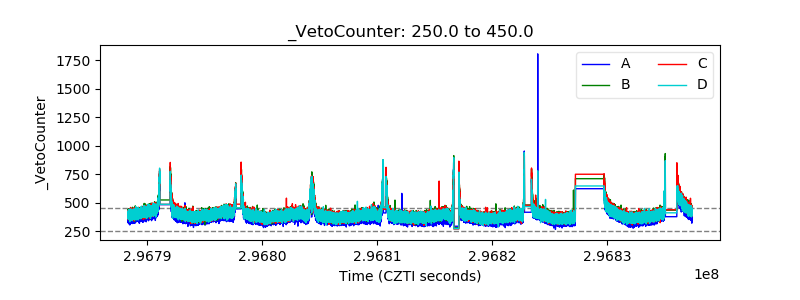 |