| Param | Original file | Final file |
|---|---|---|
| Filename | modeM0/AS1T03_118T01_9000002962_19827cztM0_level2.evt | modeM0/AS1T03_118T01_9000002962_19827cztM0_level2_quad_clean.evt |
| Size (bytes) | 923,546,880 | 151,182,720 |
| Size | 880.8 MB | 144.2 MB |
| Events in quadrant A | 6,813,993 | 955,650 |
| Events in quadrant B | 6,349,972 | 968,332 |
| Events in quadrant C | 5,981,040 | 922,466 |
| Events in quadrant D | 8,007,246 | 896,209 |
| Mode SS | |||
|---|---|---|---|
| Quadrant | BADHDUFLAG | Total packets | Discarded packets |
| A | 0 | 248 | 0 |
| B | 0 | 248 | 0 |
| C | 0 | 248 | 0 |
| D | 0 | 248 | 0 |
| Mode M9 | |||
|---|---|---|---|
| Quadrant | BADHDUFLAG | Total packets | Discarded packets |
| A | 0 | 29 | 0 |
| B | 0 | 29 | 0 |
| C | 0 | 29 | 0 |
| D | 0 | 29 | 0 |
| Mode M0 | |||
|---|---|---|---|
| Quadrant | BADHDUFLAG | Total packets | Discarded packets |
| A | 0 | 28106 | 3 |
| B | 0 | 26506 | 3 |
| C | 0 | 25352 | 3 |
| D | 0 | 31956 | 3 |
| Quadrant | Total seconds | Saturated seconds | Saturation percentage |
|---|---|---|---|
| A | 12085 | 411 | 3.400910% |
| B | 12086 | 284 | 2.349826% |
| C | 12086 | 191 | 1.580341% |
| D | 12086 | 462 | 3.822605% |
Noise dominated data is calculated using 1-second bins in cleaned event files. If a bin has >2000 counts, and if more than 50% of those come from <1% of pixels, then it is considered to be noise-dominated and hence unusable.
| Quadrant | # 1 sec bins | Bins with >0 counts | Bins with >2000 counts | High rate bins dominated by noise | Noise dominated (total time) | Noise dominated (detector-on time) | Marked lightcurve |
|---|---|---|---|---|---|---|---|
| A | 15009 | 12084 | 113 | 113 | 0.75% | 0.94% | 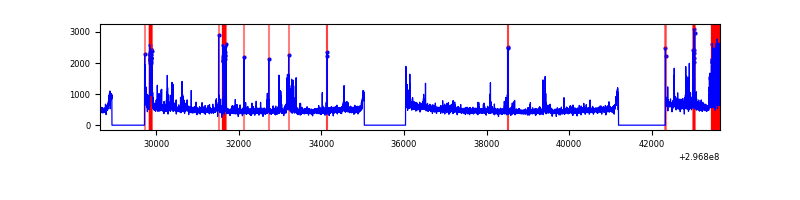 |
| B | 15011 | 12086 | 55 | 55 | 0.37% | 0.46% | 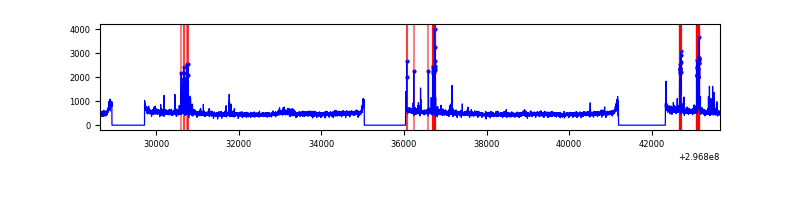 |
| C | 15011 | 12086 | 1 | 1 | 0.01% | 0.01% | 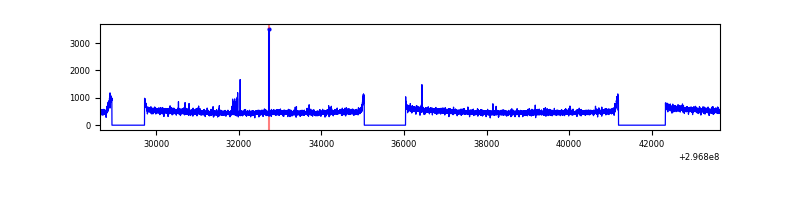 |
| D | 15011 | 12086 | 291 | 291 | 1.94% | 2.41% | 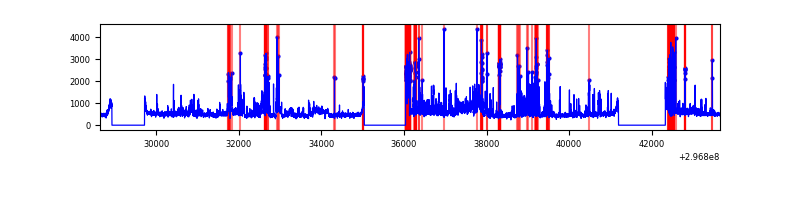 |
Top three noisy pixels from each quadrant. If the there are fewer than three noisy pixels in the level2.evt file, extra rows are filled as -1
| Pixel properties | Quadrant properties | ||||||
|---|---|---|---|---|---|---|---|
| Quadrant | DetID | PixID | Counts | Sigma | Mean | Median | Sigma |
| A | 14 | 238 | 872448 | 2854.67 | 1516 | 1485 | 305.1 |
| A | 14 | 254 | 83439 | 268.61 | 1516 | 1485 | 305.1 |
| A | 0 | 226 | 13265 | 38.61 | 1516 | 1485 | 305.1 |
| B | 7 | 220 | 206695 | 706.48 | 1518 | 1481 | 290.5 |
| B | 0 | 198 | 77686 | 262.35 | 1518 | 1481 | 290.5 |
| B | 0 | 244 | 43679 | 145.27 | 1518 | 1481 | 290.5 |
| C | 14 | 238 | 228680 | 661.39 | 1468 | 1480 | 343.5 |
| C | 3 | 233 | 28080 | 77.43 | 1468 | 1480 | 343.5 |
| C | 13 | 61 | 10245 | 25.52 | 1468 | 1480 | 343.5 |
| D | 1 | 52 | 1590023 | 4477.72 | 1464 | 1420 | 354.8 |
| D | 7 | 96 | 316815 | 888.99 | 1464 | 1420 | 354.8 |
| D | 7 | 238 | 269049 | 754.35 | 1464 | 1420 | 354.8 |
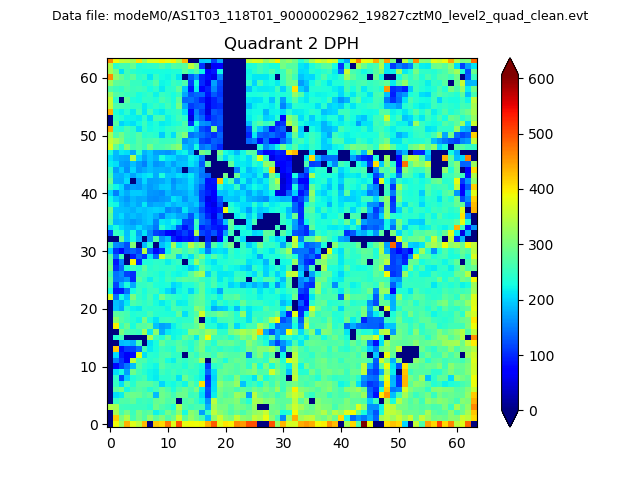
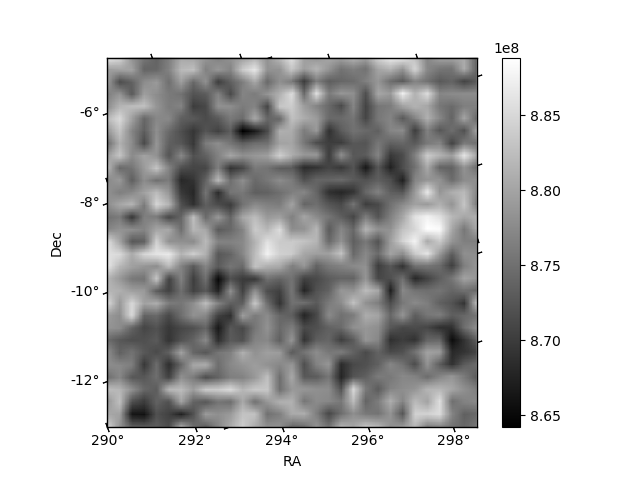
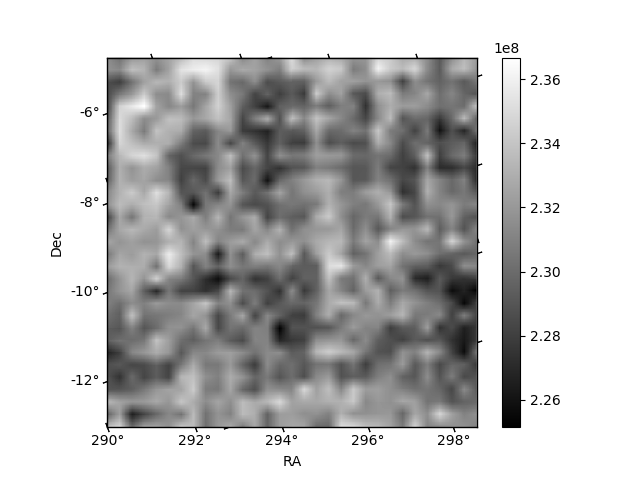
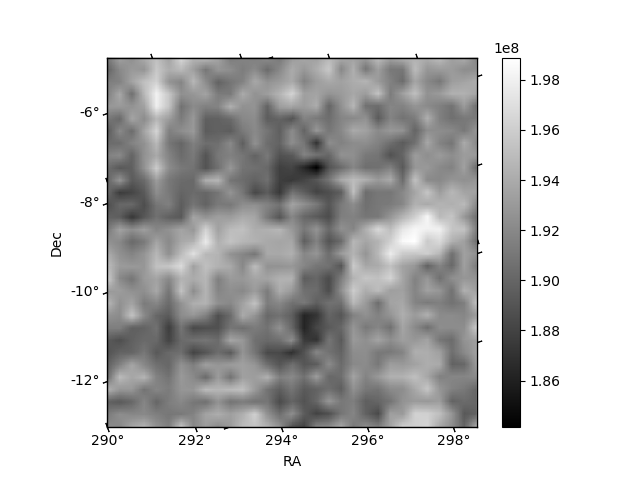
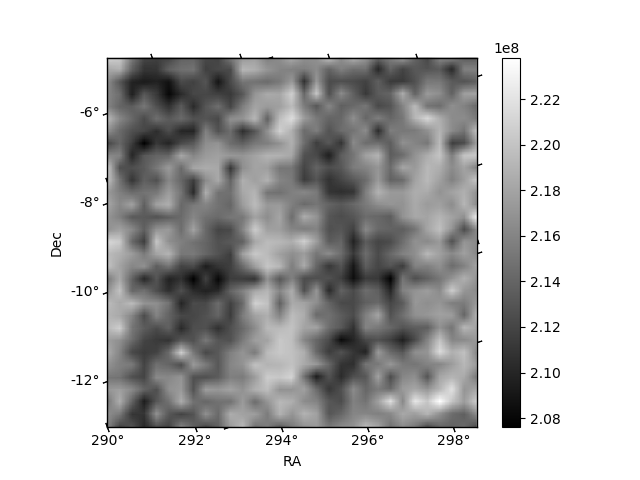
Histogram calculated using DETX and DETY for each event in the final _common_clean file
| Quadrant A | 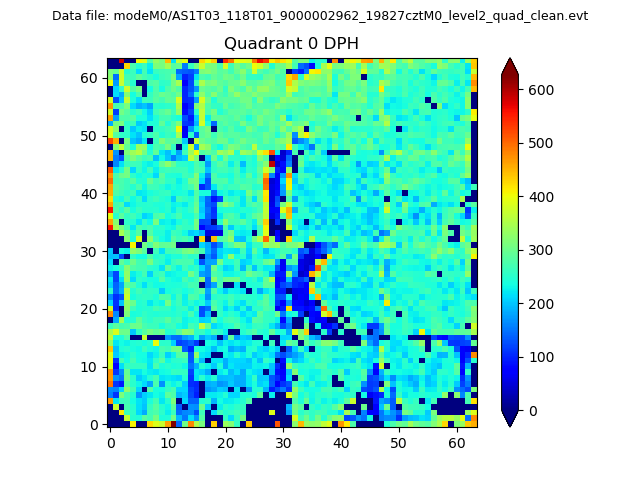 |
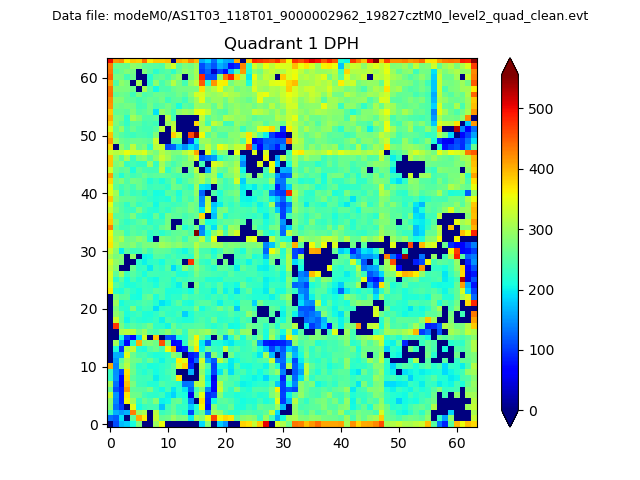 |
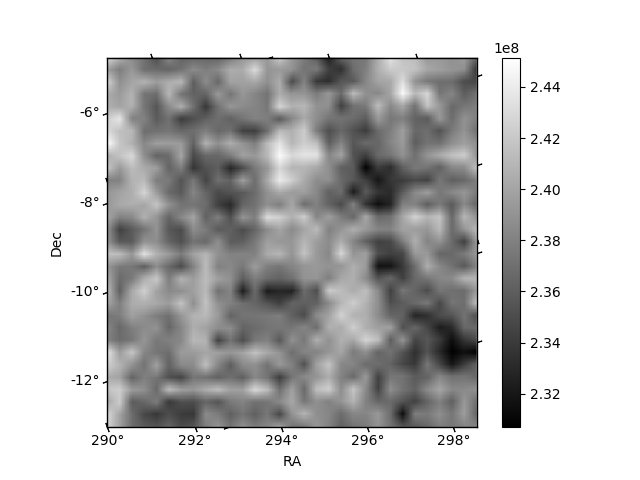
Quadrant B |
|---|---|---|---|
| Quadrant D | 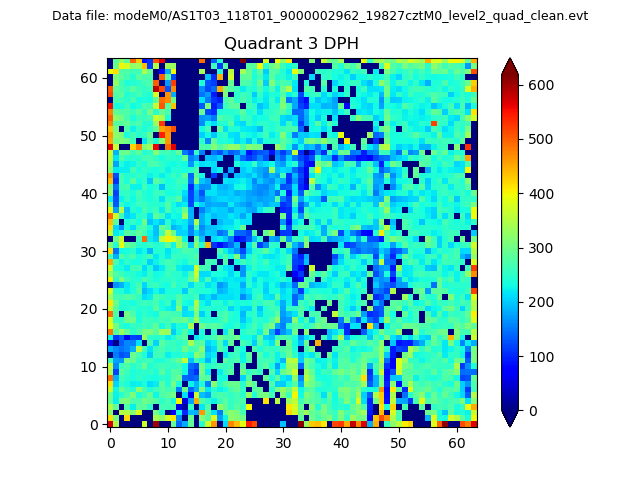 |
 |
Quadrant C |
| Plot type | Count rate plots | Images |
|---|---|---|
| Comparison with Poisson distribution Blue bars denote a histogram of data divided into 1 sec bins. Red curve is a Poisson curve with rate = median count rate of data. |
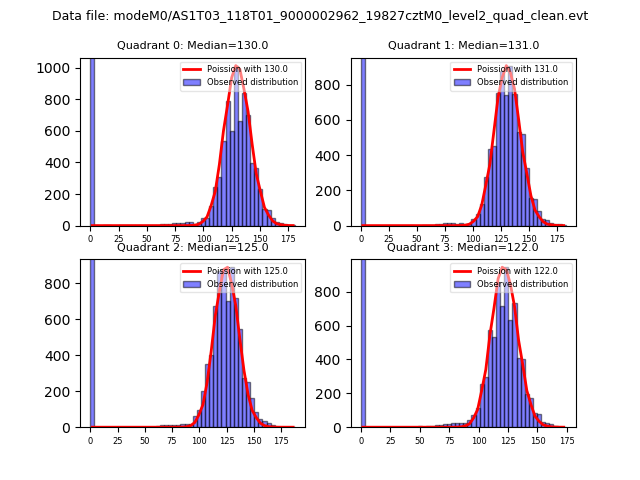 |
 |
| Quadrant-wise count rates Data is divided into 100 sec bins |
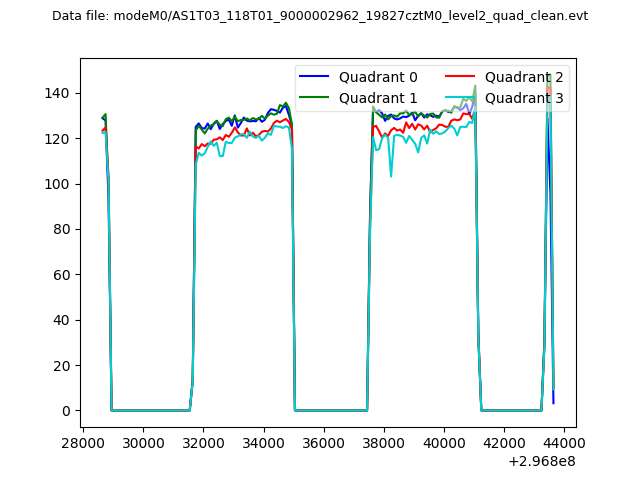 |
|
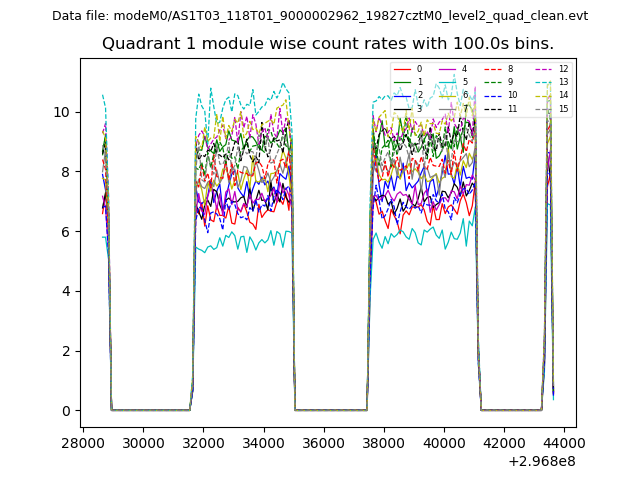
| Module-wise count rates for Quadrant A Data is divided into 100 sec bins |
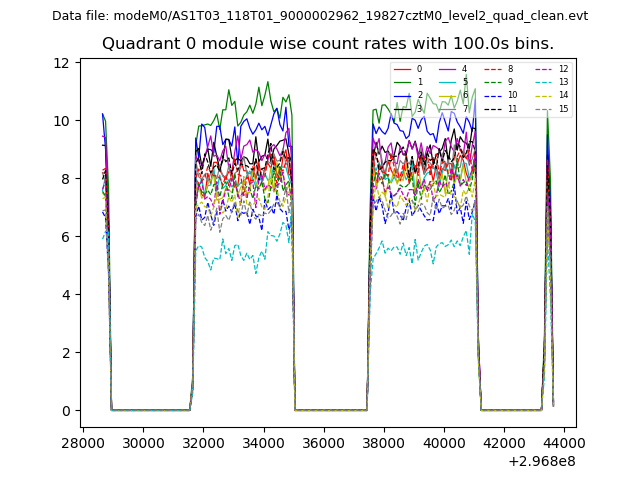 |
 |
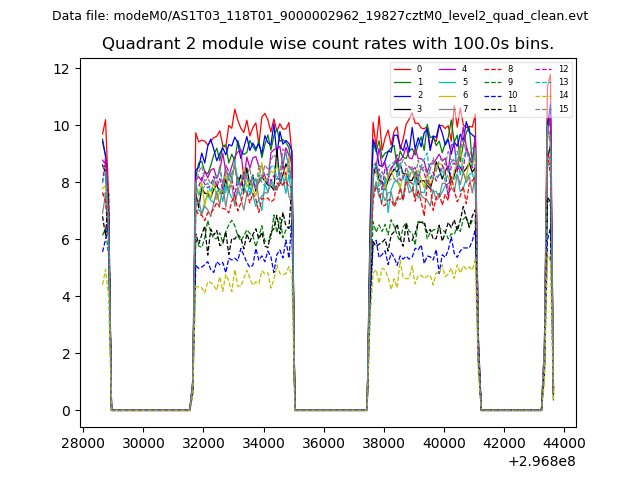
| Module-wise count rates for Quadrant B Data is divided into 100 sec bins |
 |
 |
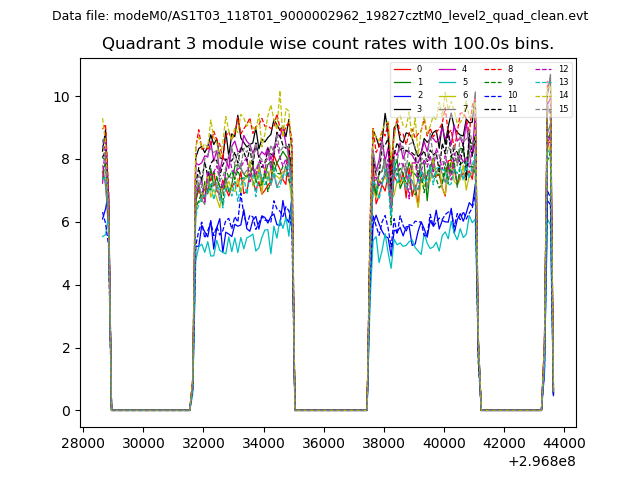
| Module-wise count rates for Quadrant C Data is divided into 100 sec bins |
 |
 |
| Module-wise count rates for Quadrant D Data is divided into 100 sec bins |
 |
 |
| Parameter | Plot |
|---|---|
| CZT HV Monitor | 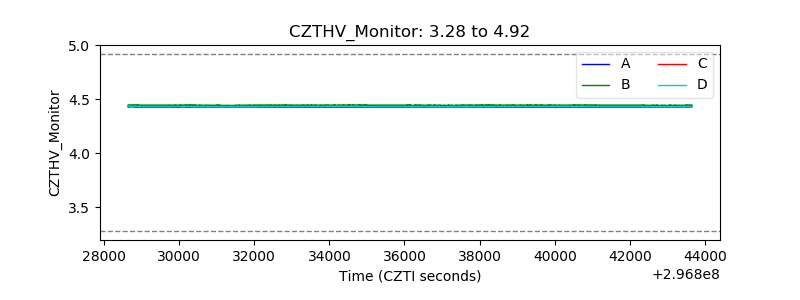 |
| D_VDD |  |
| Temperature 1 | 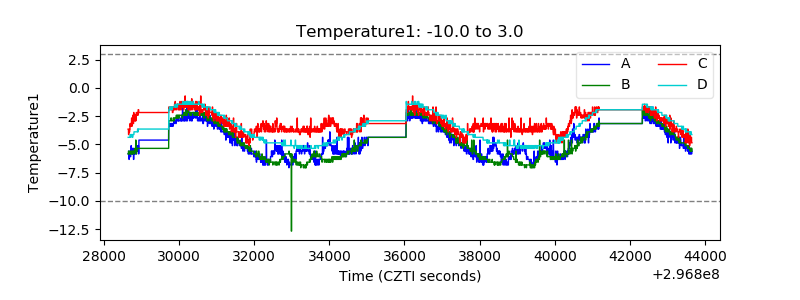 |
| Veto HV Monitor | 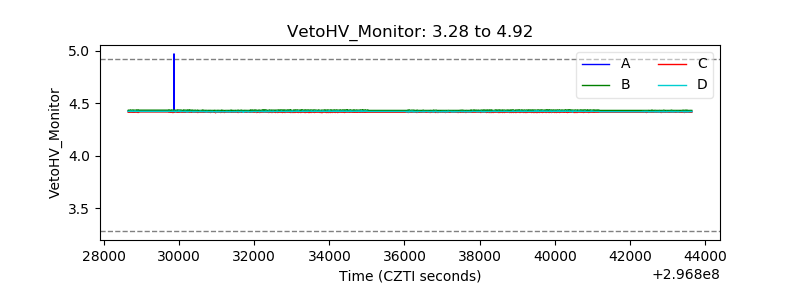 |
| Veto LLD | 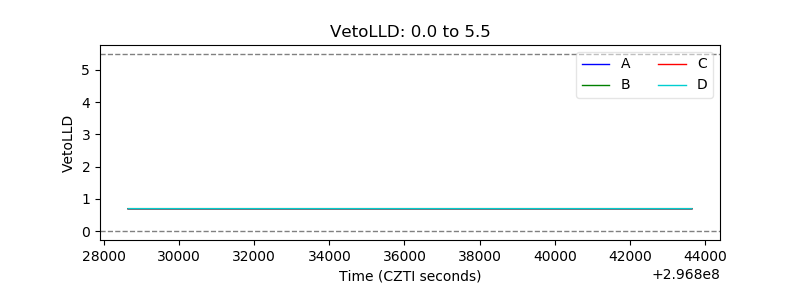 |
| Alpha Counter | 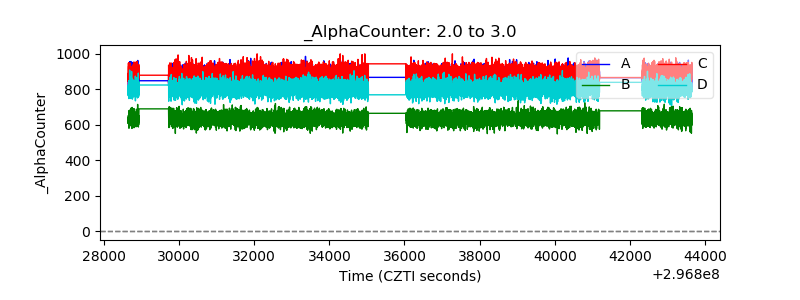 |
| _CPM_Rate | 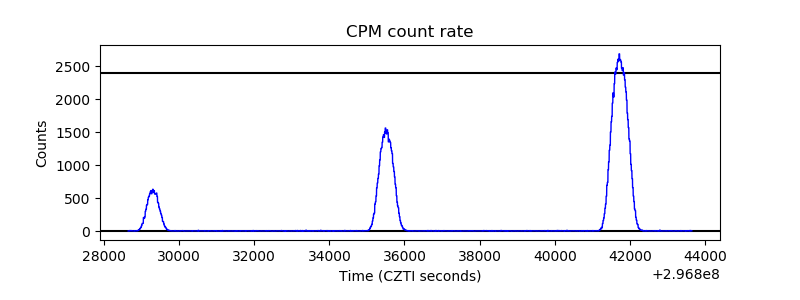 |
| CZT Counter | 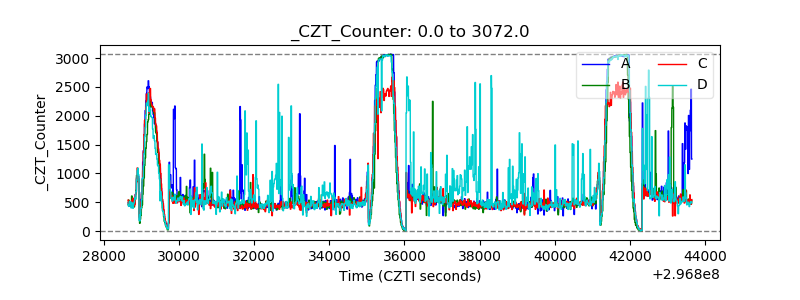 |
| +2.5 Volts monitor |  |
| +5 Volts monitor |  |
| _ROLL_ROT | 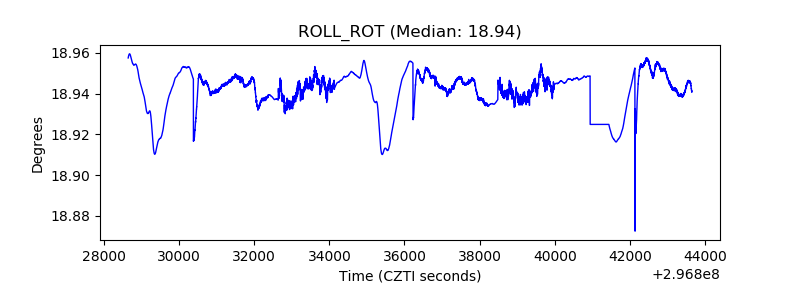 |
| _Roll_DEC | 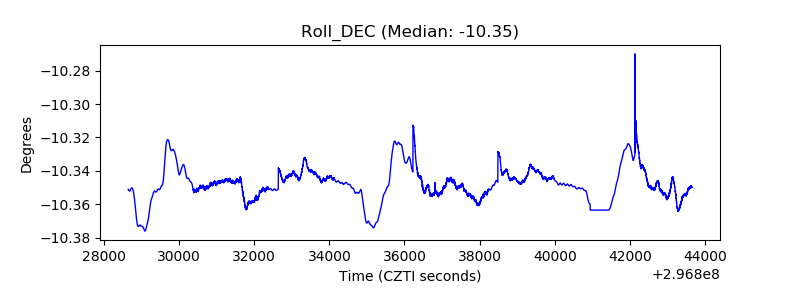 |
| _Roll_RA | 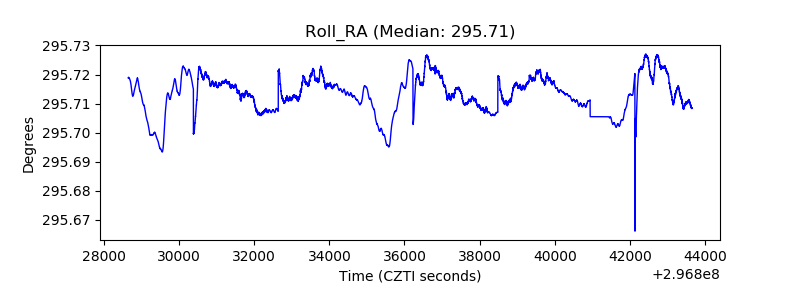 |
| Veto Counter | 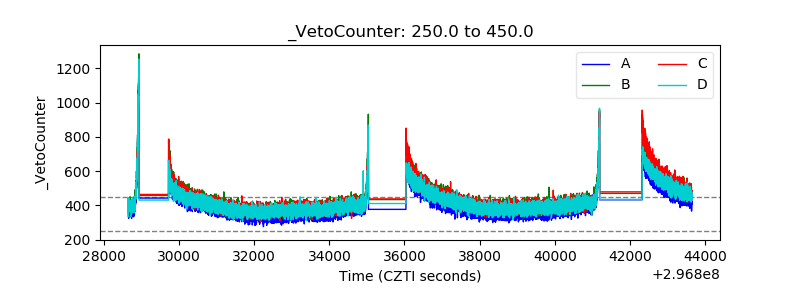 |