| Param | Original file | Final file |
|---|---|---|
| Filename | modeM0/AS1T03_118T01_9000002962_19829cztM0_level2.evt | modeM0/AS1T03_118T01_9000002962_19829cztM0_level2_quad_clean.evt |
| Size (bytes) | 491,169,600 | 103,780,800 |
| Size | 468.4 MB | 99.0 MB |
| Events in quadrant A | 3,708,765 | 680,877 |
| Events in quadrant B | 3,721,977 | 695,627 |
| Events in quadrant C | 3,501,085 | 666,517 |
| Events in quadrant D | 3,503,850 | 648,457 |
| Mode SS | |||
|---|---|---|---|
| Quadrant | BADHDUFLAG | Total packets | Discarded packets |
| A | 0 | 134 | 0 |
| B | 0 | 134 | 0 |
| C | 0 | 134 | 0 |
| D | 0 | 134 | 0 |
| Mode M9 | |||
|---|---|---|---|
| Quadrant | BADHDUFLAG | Total packets | Discarded packets |
| A | 0 | 25 | 0 |
| B | 0 | 25 | 0 |
| C | 0 | 25 | 0 |
| D | 0 | 25 | 0 |
| Mode M0 | |||
|---|---|---|---|
| Quadrant | BADHDUFLAG | Total packets | Discarded packets |
| A | 0 | 15097 | 2 |
| B | 0 | 15248 | 2 |
| C | 0 | 14448 | 2 |
| D | 0 | 14615 | 2 |
| Quadrant | Total seconds | Saturated seconds | Saturation percentage |
|---|---|---|---|
| A | 6472 | 94 | 1.452410% |
| B | 6472 | 136 | 2.101360% |
| C | 6473 | 124 | 1.915650% |
| D | 6473 | 99 | 1.529430% |
Noise dominated data is calculated using 1-second bins in cleaned event files. If a bin has >2000 counts, and if more than 50% of those come from <1% of pixels, then it is considered to be noise-dominated and hence unusable.
| Quadrant | # 1 sec bins | Bins with >0 counts | Bins with >2000 counts | High rate bins dominated by noise | Noise dominated (total time) | Noise dominated (detector-on time) | Marked lightcurve |
|---|---|---|---|---|---|---|---|
| A | 9007 | 6473 | 6 | 6 | 0.07% | 0.09% | 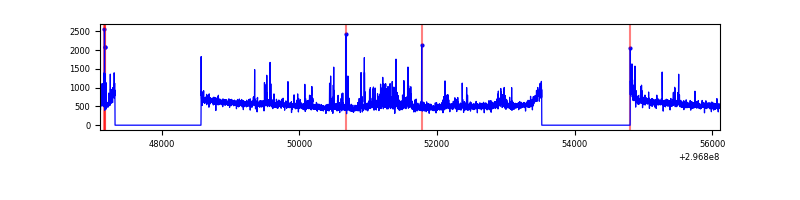 |
| B | 9007 | 6472 | 12 | 12 | 0.13% | 0.19% | 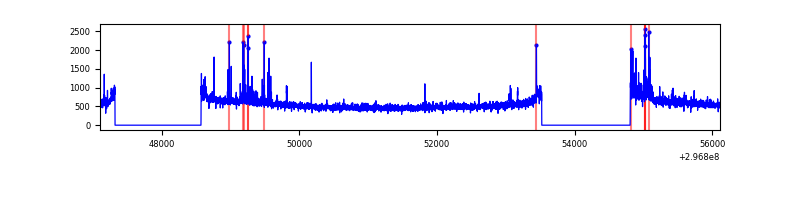 |
| C | 9008 | 6474 | 0 | 0 | 0.00% | 0.00% | 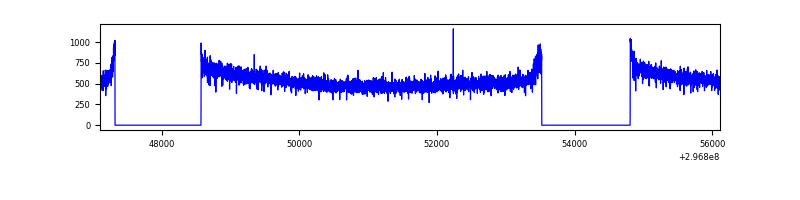 |
| D | 9008 | 6474 | 25 | 25 | 0.28% | 0.39% | 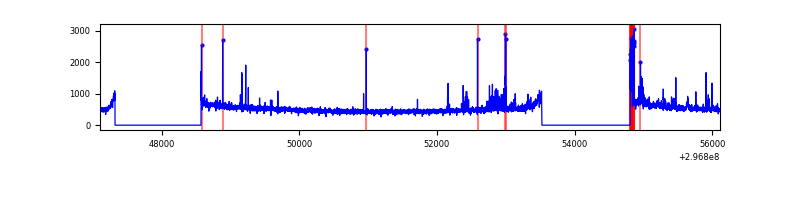 |
Top three noisy pixels from each quadrant. If the there are fewer than three noisy pixels in the level2.evt file, extra rows are filled as -1
| Pixel properties | Quadrant properties | ||||||
|---|---|---|---|---|---|---|---|
| Quadrant | DetID | PixID | Counts | Sigma | Mean | Median | Sigma |
| A | 14 | 238 | 302915 | 1726.21 | 879 | 863 | 175.0 |
| A | 14 | 254 | 21401 | 117.37 | 879 | 863 | 175.0 |
| A | 0 | 226 | 7508 | 37.98 | 879 | 863 | 175.0 |
| B | 10 | 245 | 109557 | 651.73 | 885 | 862 | 166.8 |
| B | 0 | 197 | 57797 | 341.38 | 885 | 862 | 166.8 |
| B | 7 | 220 | 28723 | 167.05 | 885 | 862 | 166.8 |
| C | 14 | 238 | 135416 | 675.24 | 861 | 872 | 199.3 |
| C | 3 | 233 | 8327 | 37.41 | 861 | 872 | 199.3 |
| C | 13 | 61 | 5887 | 25.17 | 861 | 872 | 199.3 |
| D | 1 | 52 | 199585 | 949.61 | 865 | 842 | 209.3 |
| D | 2 | 234 | 29138 | 135.2 | 865 | 842 | 209.3 |
| D | 7 | 96 | 15106 | 68.15 | 865 | 842 | 209.3 |
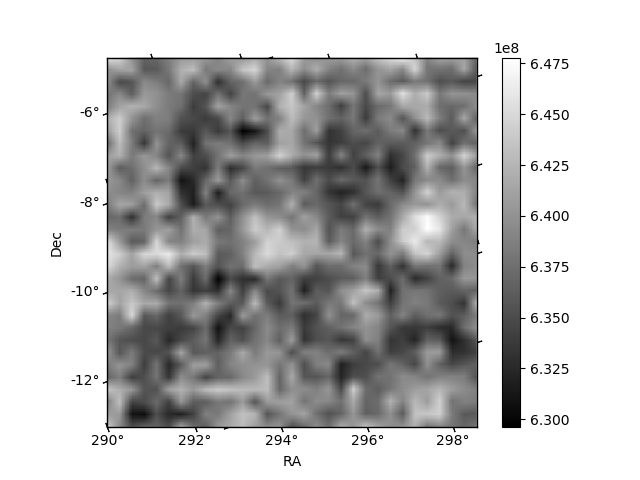
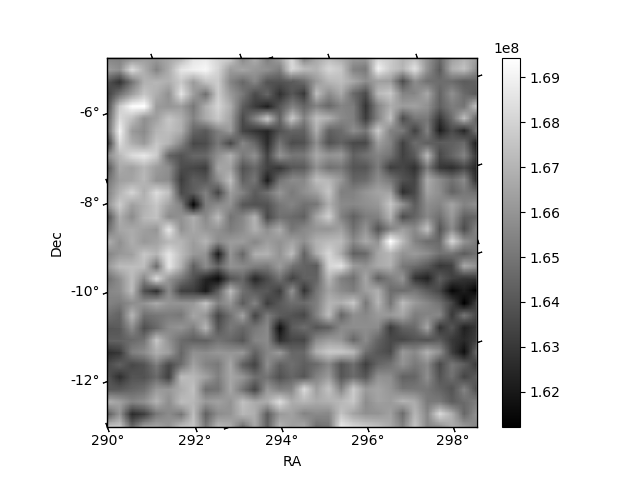
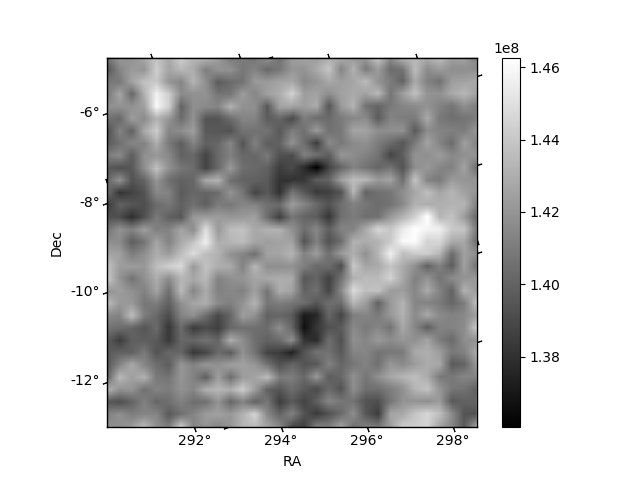
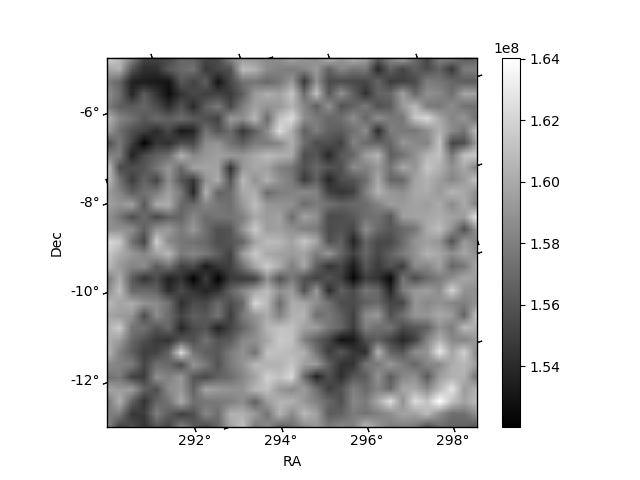
Histogram calculated using DETX and DETY for each event in the final _common_clean file
| Quadrant A | 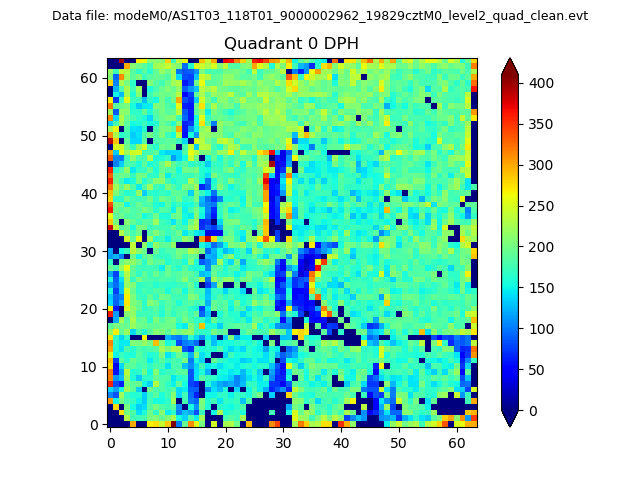 |
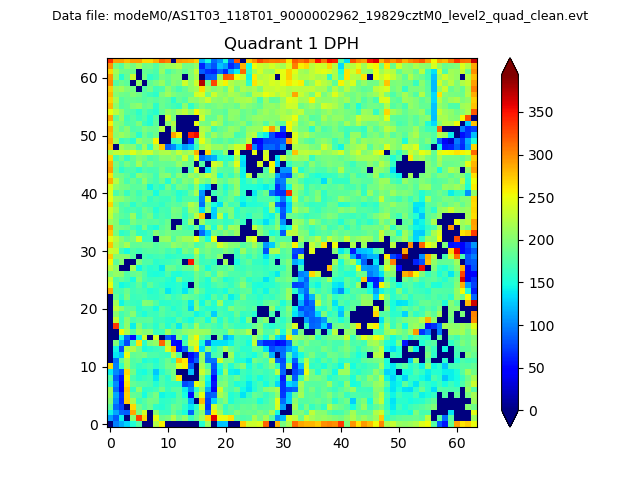 |
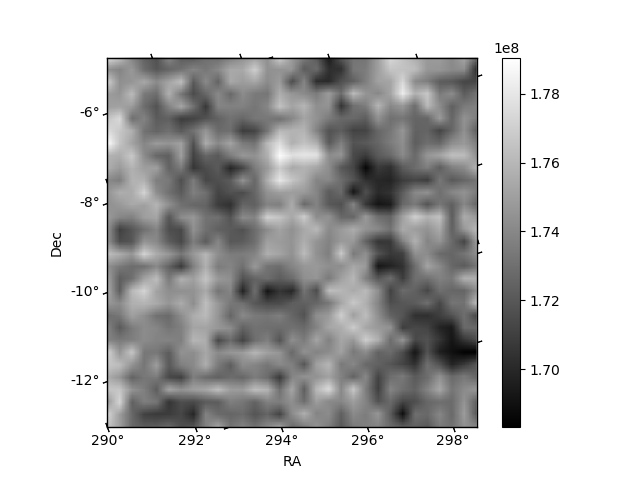
Quadrant B |
|---|---|---|---|
| Quadrant D | 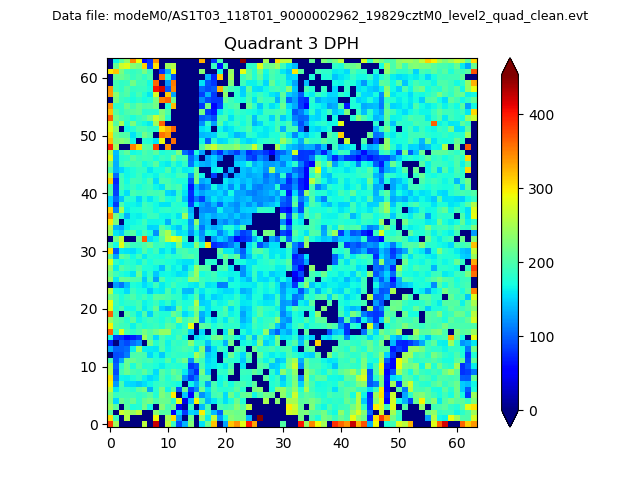 |
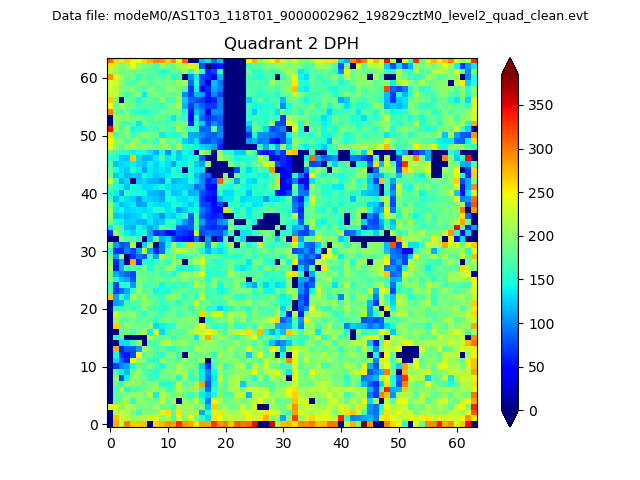 |
Quadrant C |
| Plot type | Count rate plots | Images |
|---|---|---|
| Comparison with Poisson distribution Blue bars denote a histogram of data divided into 1 sec bins. Red curve is a Poisson curve with rate = median count rate of data. |
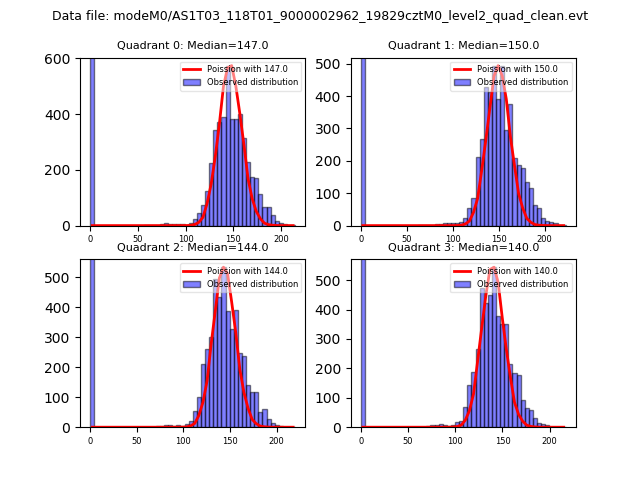 |
 |
| Quadrant-wise count rates Data is divided into 100 sec bins |
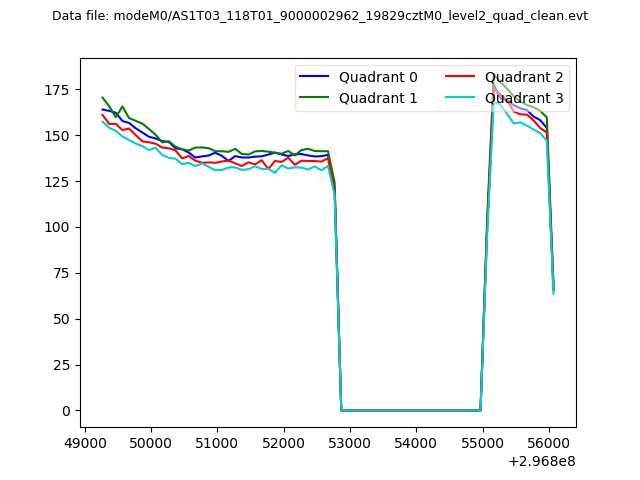 |
|
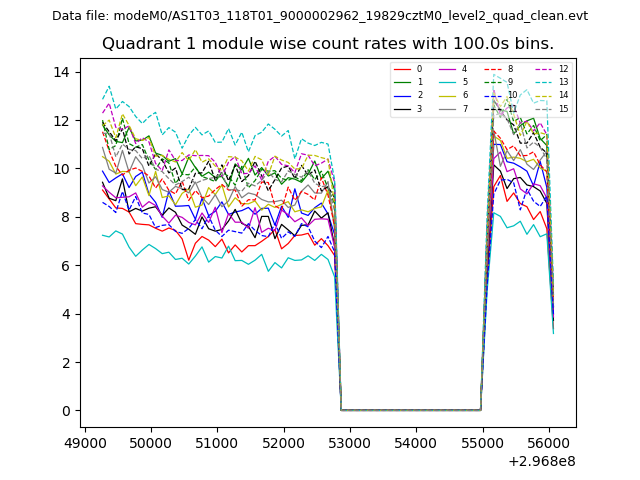
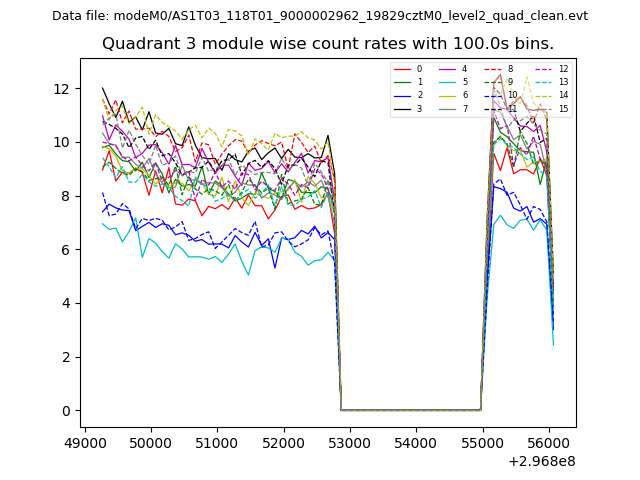
| Module-wise count rates for Quadrant A Data is divided into 100 sec bins |
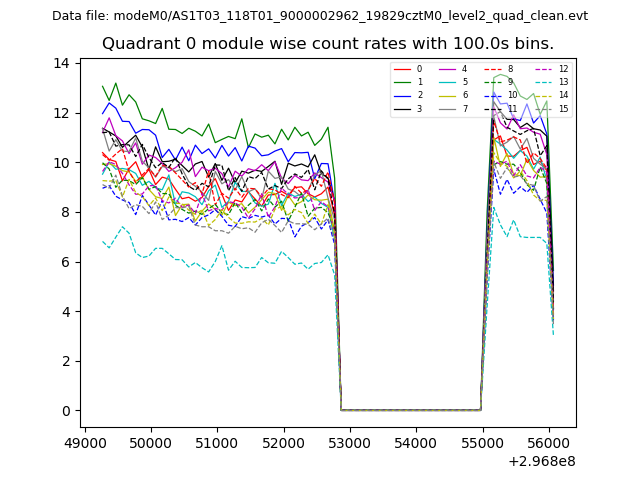 |
 |
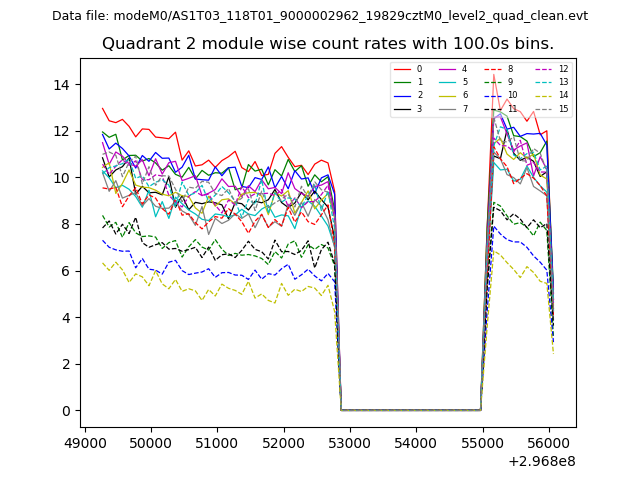
| Module-wise count rates for Quadrant B Data is divided into 100 sec bins |
 |
 |
| Module-wise count rates for Quadrant C Data is divided into 100 sec bins |
 |
 |
| Module-wise count rates for Quadrant D Data is divided into 100 sec bins |
 |
 |
| Parameter | Plot |
|---|---|
| CZT HV Monitor |  |
| D_VDD | 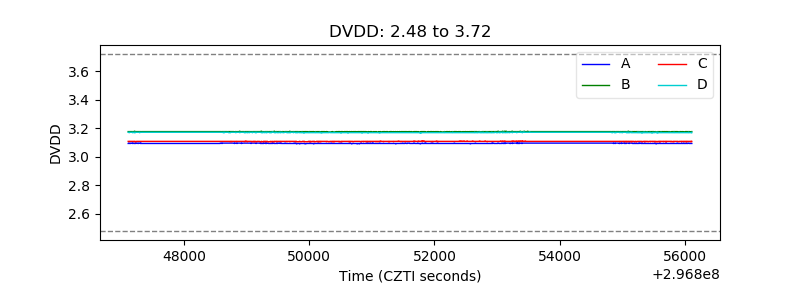 |
| Temperature 1 | 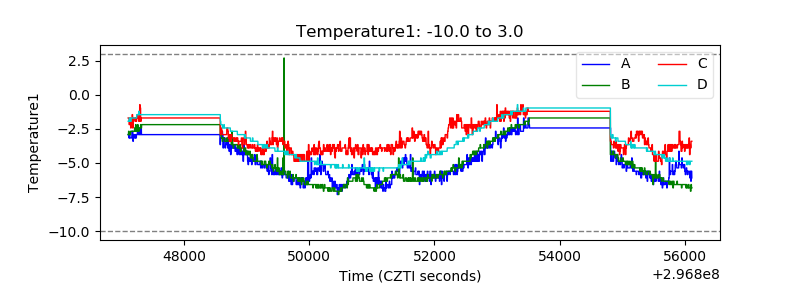 |
| Veto HV Monitor | 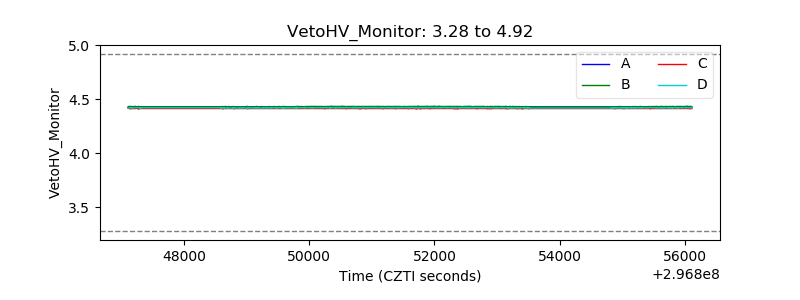 |
| Veto LLD | 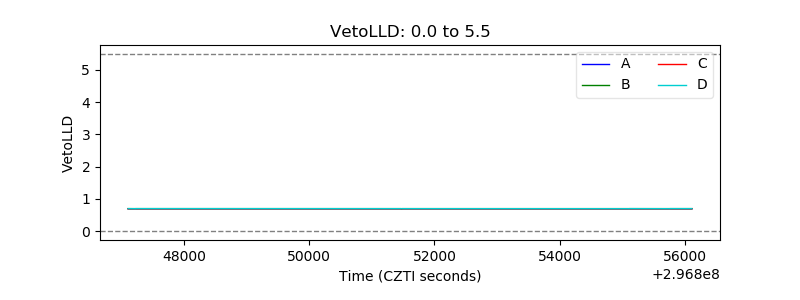 |
| Alpha Counter | 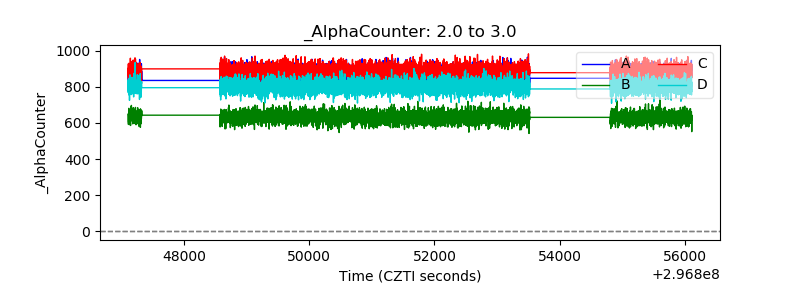 |
| _CPM_Rate | 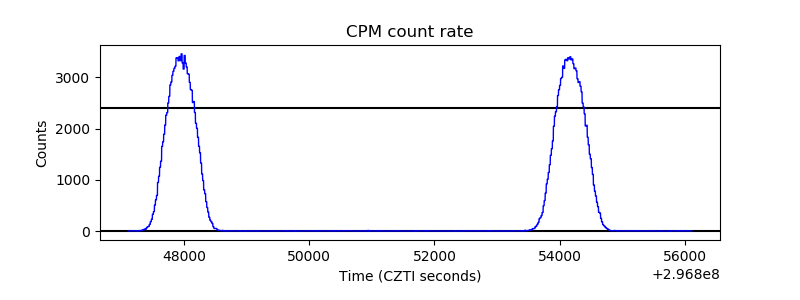 |
| CZT Counter | 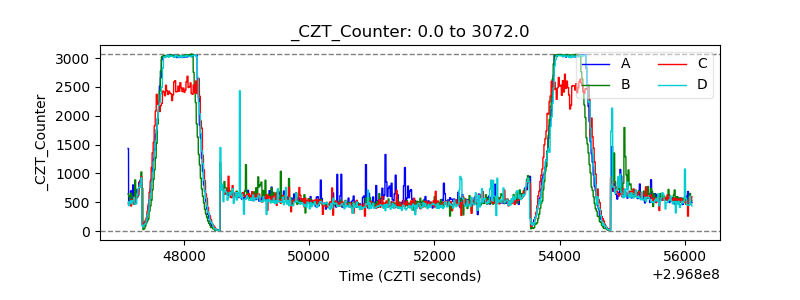 |
| +2.5 Volts monitor |  |
| +5 Volts monitor | 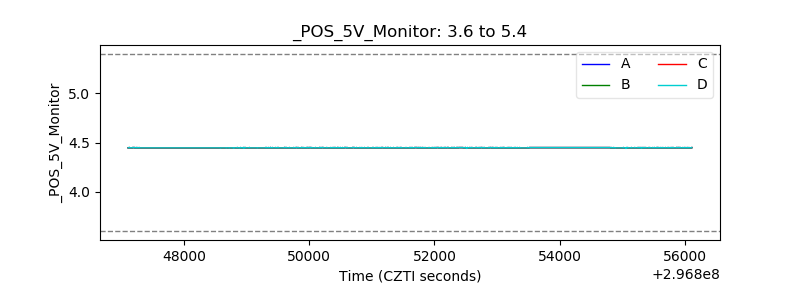 |
| _ROLL_ROT | 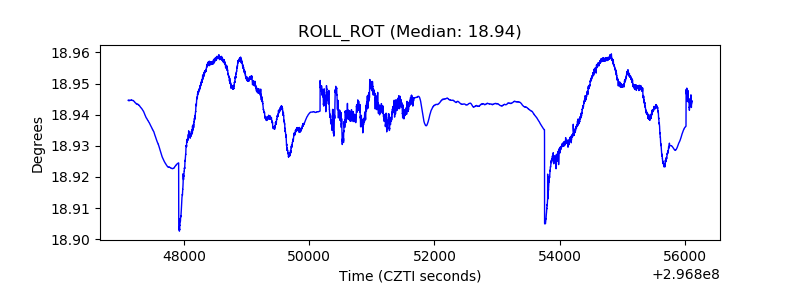 |
| _Roll_DEC | 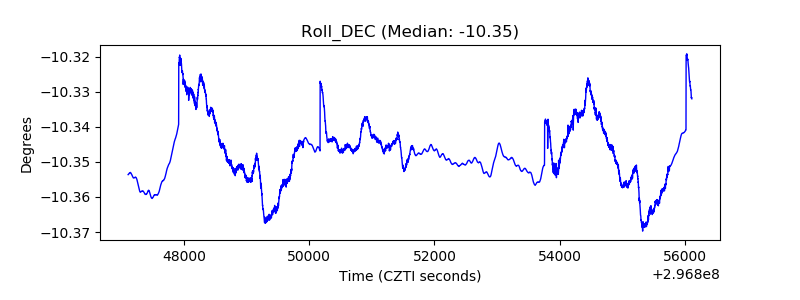 |
| _Roll_RA | 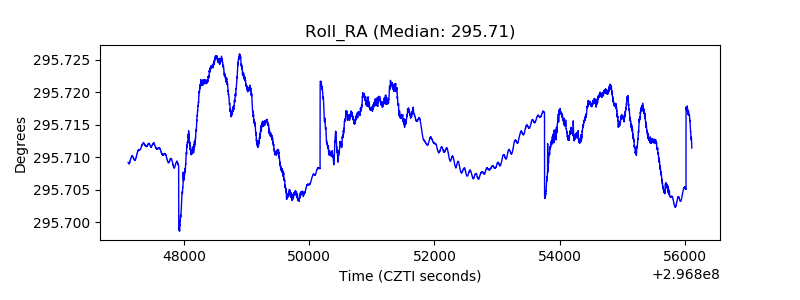 |
| Veto Counter | 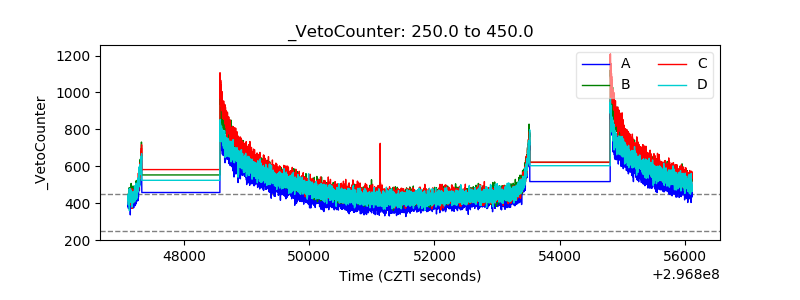 |