| Param | Original file | Final file |
|---|---|---|
| Filename | modeM0/AS1T03_118T01_9000002962_19831cztM0_level2.evt | modeM0/AS1T03_118T01_9000002962_19831cztM0_level2_quad_clean.evt |
| Size (bytes) | 455,774,400 | 105,310,080 |
| Size | 434.7 MB | 100.4 MB |
| Events in quadrant A | 3,268,916 | 696,375 |
| Events in quadrant B | 3,341,023 | 712,279 |
| Events in quadrant C | 3,194,788 | 686,067 |
| Events in quadrant D | 3,578,893 | 663,475 |
| Mode SS | |||
|---|---|---|---|
| Quadrant | BADHDUFLAG | Total packets | Discarded packets |
| A | 0 | 128 | 0 |
| B | 0 | 128 | 0 |
| C | 0 | 128 | 0 |
| D | 0 | 128 | 0 |
| Mode M9 | |||
|---|---|---|---|
| Quadrant | BADHDUFLAG | Total packets | Discarded packets |
| A | 0 | 26 | 0 |
| B | 0 | 27 | 0 |
| C | 0 | 27 | 0 |
| D | 0 | 27 | 0 |
| Mode M0 | |||
|---|---|---|---|
| Quadrant | BADHDUFLAG | Total packets | Discarded packets |
| A | 0 | 13584 | 2 |
| B | 0 | 13751 | 2 |
| C | 0 | 13239 | 2 |
| D | 0 | 14703 | 2 |
| Quadrant | Total seconds | Saturated seconds | Saturation percentage |
|---|---|---|---|
| A | 6183 | 102 | 1.649685% |
| B | 6182 | 108 | 1.747007% |
| C | 6182 | 80 | 1.294080% |
| D | 6182 | 69 | 1.116144% |
Noise dominated data is calculated using 1-second bins in cleaned event files. If a bin has >2000 counts, and if more than 50% of those come from <1% of pixels, then it is considered to be noise-dominated and hence unusable.
| Quadrant | # 1 sec bins | Bins with >0 counts | Bins with >2000 counts | High rate bins dominated by noise | Noise dominated (total time) | Noise dominated (detector-on time) | Marked lightcurve |
|---|---|---|---|---|---|---|---|
| A | 7498 | 6185 | 42 | 42 | 0.56% | 0.68% |  |
| B | 7497 | 6184 | 52 | 52 | 0.69% | 0.84% | 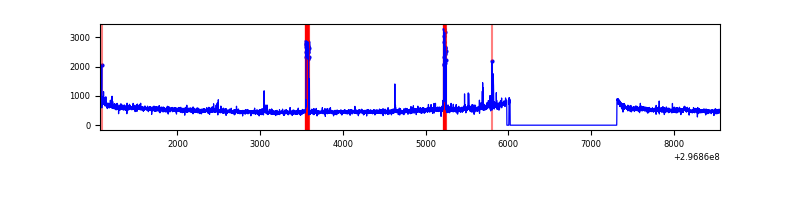 |
| C | 7497 | 6184 | 0 | 0 | 0.00% | 0.00% | 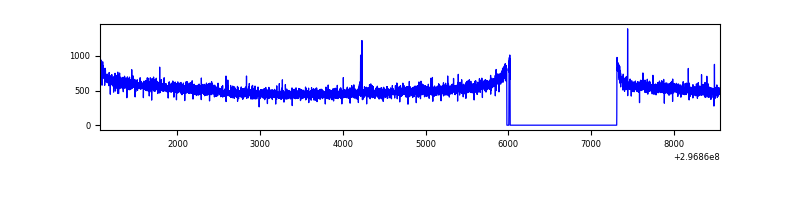 |
| D | 7497 | 6184 | 35 | 35 | 0.47% | 0.57% | 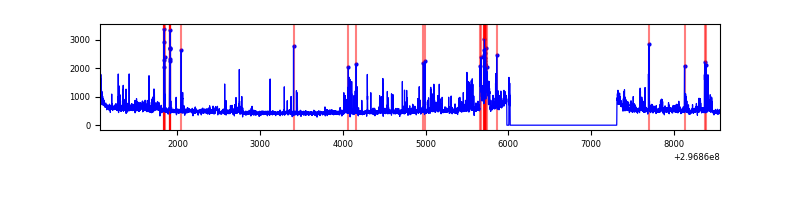 |
Top three noisy pixels from each quadrant. If the there are fewer than three noisy pixels in the level2.evt file, extra rows are filled as -1
| Pixel properties | Quadrant properties | ||||||
|---|---|---|---|---|---|---|---|
| Quadrant | DetID | PixID | Counts | Sigma | Mean | Median | Sigma |
| A | 14 | 238 | 183788 | 1145.62 | 798 | 783 | 159.7 |
| A | 14 | 254 | 10485 | 60.74 | 798 | 783 | 159.7 |
| A | 5 | 16 | 6959 | 38.66 | 798 | 783 | 159.7 |
| B | 3 | 64 | 95816 | 631.2 | 802 | 783 | 150.6 |
| B | 7 | 220 | 55387 | 362.68 | 802 | 783 | 150.6 |
| B | 0 | 190 | 23456 | 150.59 | 802 | 783 | 150.6 |
| C | 14 | 238 | 122659 | 662.99 | 787 | 796 | 183.8 |
| C | 3 | 233 | 6354 | 30.24 | 787 | 796 | 183.8 |
| C | 13 | 61 | 5463 | 25.39 | 787 | 796 | 183.8 |
| D | 1 | 52 | 350158 | 1824.16 | 787 | 765 | 191.5 |
| D | 10 | 230 | 132598 | 688.29 | 787 | 765 | 191.5 |
| D | 7 | 96 | 45359 | 232.82 | 787 | 765 | 191.5 |
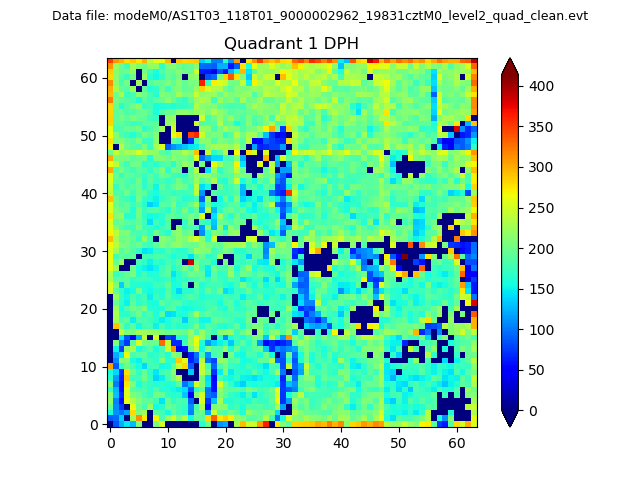
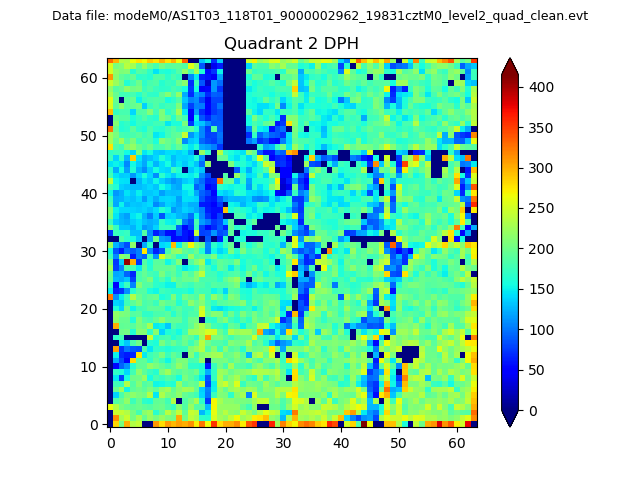
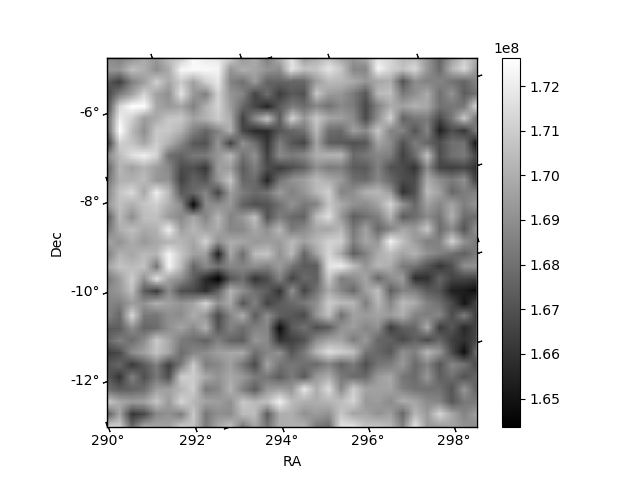
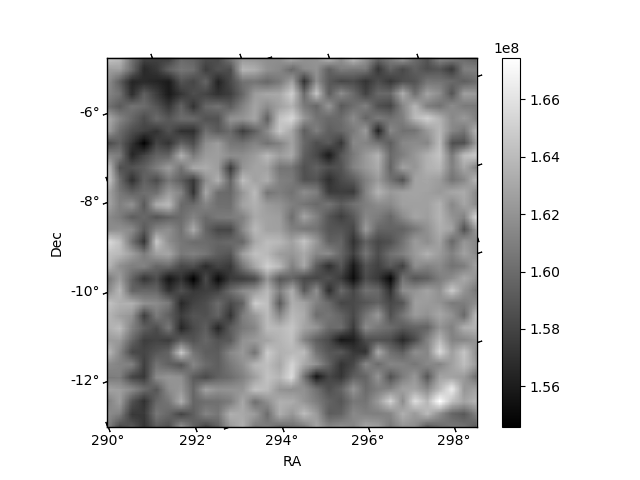
Histogram calculated using DETX and DETY for each event in the final _common_clean file
| Quadrant A | 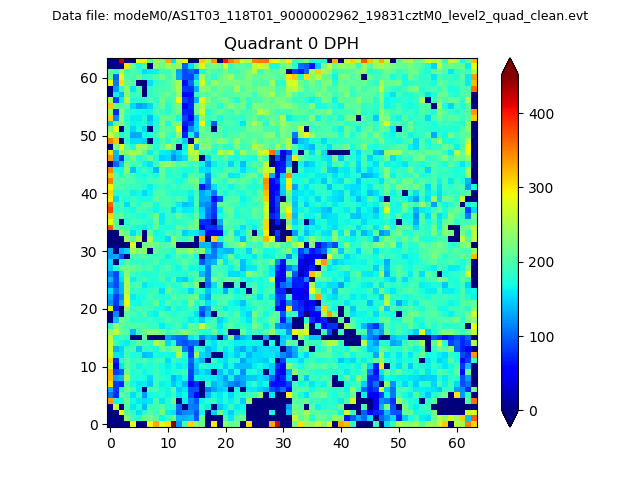 |
 |
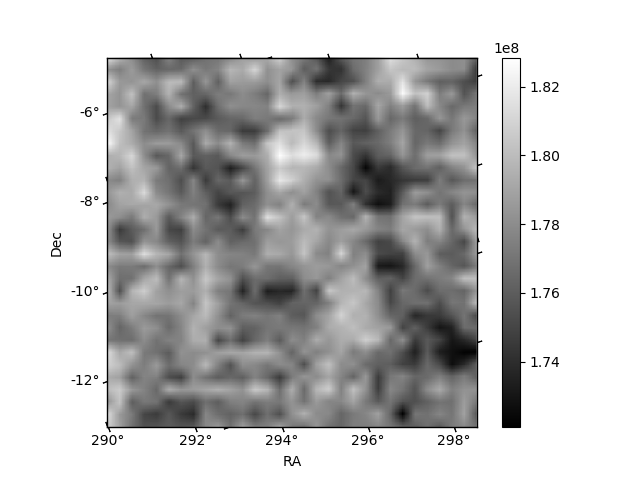
Quadrant B |
|---|---|---|---|
| Quadrant D | 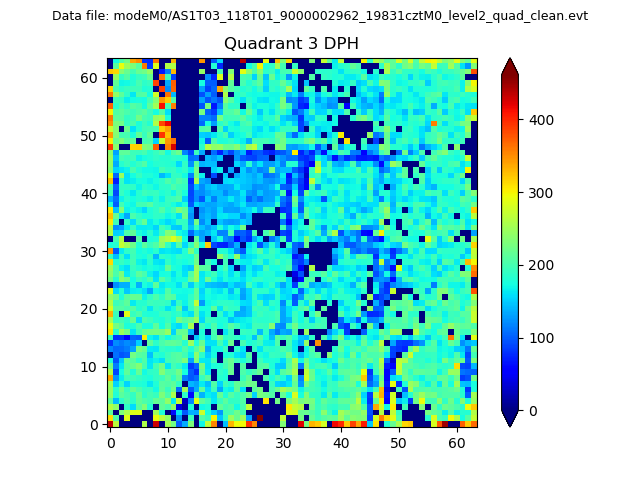 |
 |
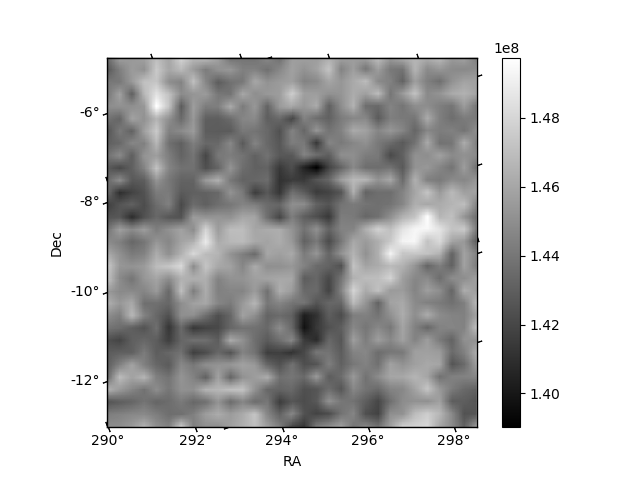
Quadrant C |
| Plot type | Count rate plots | Images |
|---|---|---|
| Comparison with Poisson distribution Blue bars denote a histogram of data divided into 1 sec bins. Red curve is a Poisson curve with rate = median count rate of data. |
 |
 |
| Quadrant-wise count rates Data is divided into 100 sec bins |
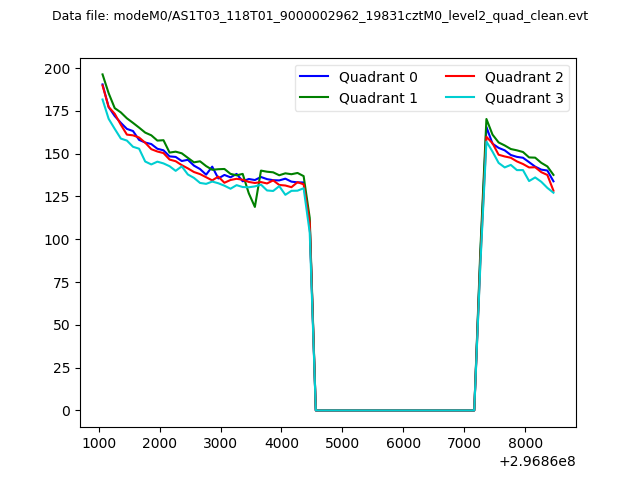 |
|
| Module-wise count rates for Quadrant A Data is divided into 100 sec bins |
 |
 |
| Module-wise count rates for Quadrant B Data is divided into 100 sec bins |
 |
 |
| Module-wise count rates for Quadrant C Data is divided into 100 sec bins |
 |
 |
| Module-wise count rates for Quadrant D Data is divided into 100 sec bins |
 |
 |
| Parameter | Plot |
|---|---|
| CZT HV Monitor |  |
| D_VDD | 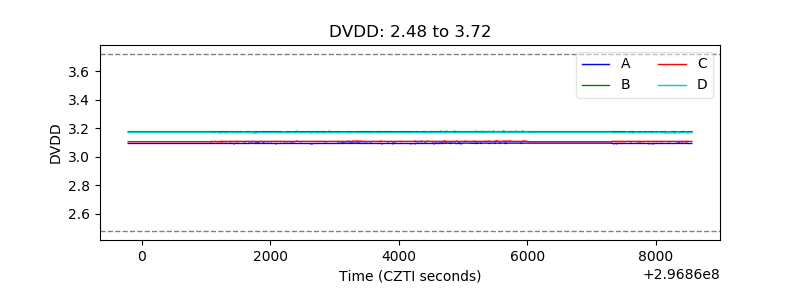 |
| Temperature 1 | 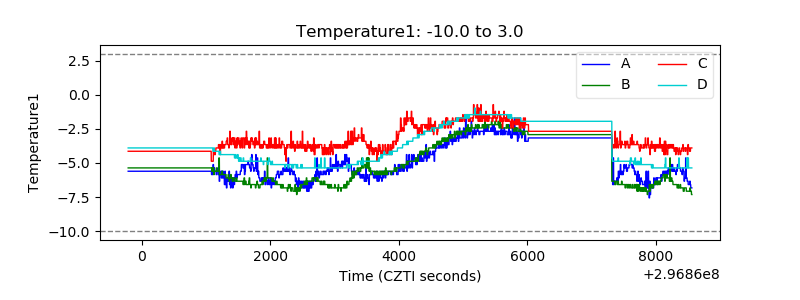 |
| Veto HV Monitor | 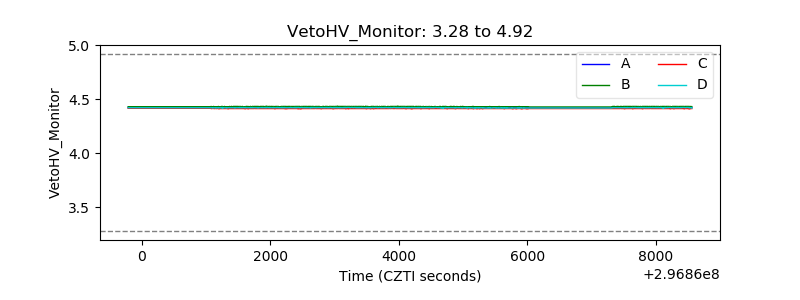 |
| Veto LLD | 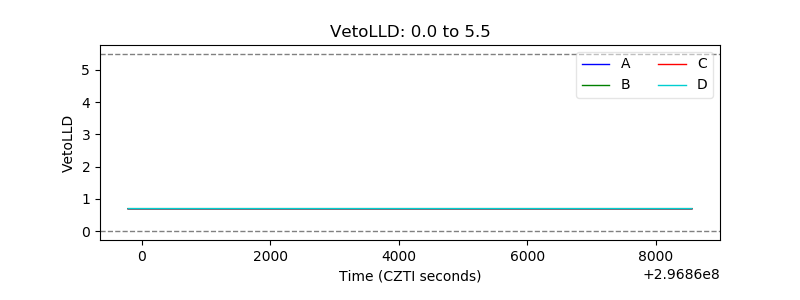 |
| Alpha Counter | 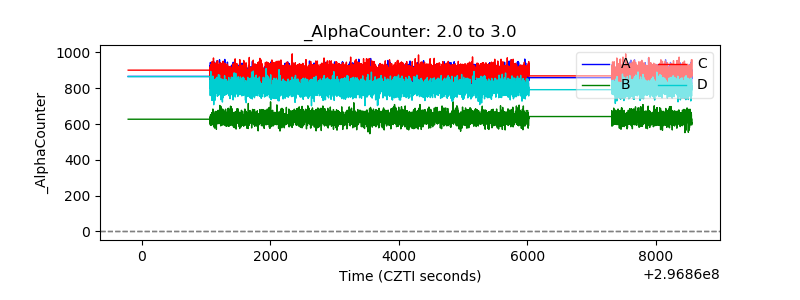 |
| _CPM_Rate | 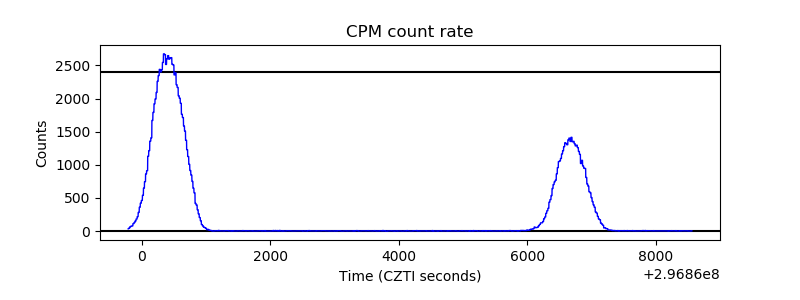 |
| CZT Counter | 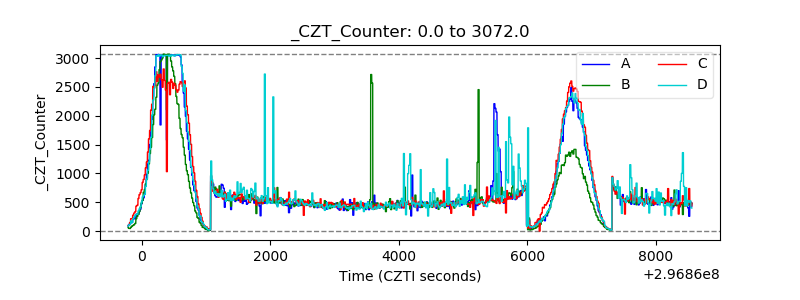 |
| +2.5 Volts monitor |  |
| +5 Volts monitor | 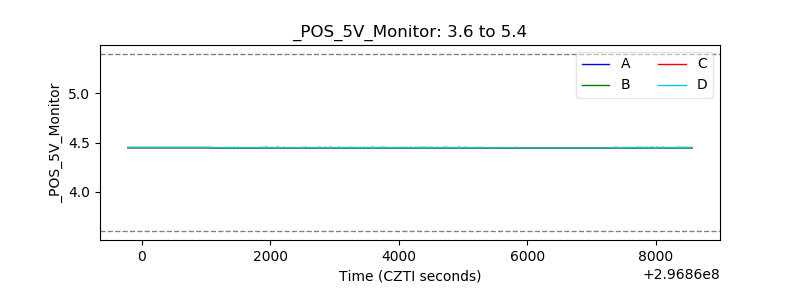 |
| _ROLL_ROT | 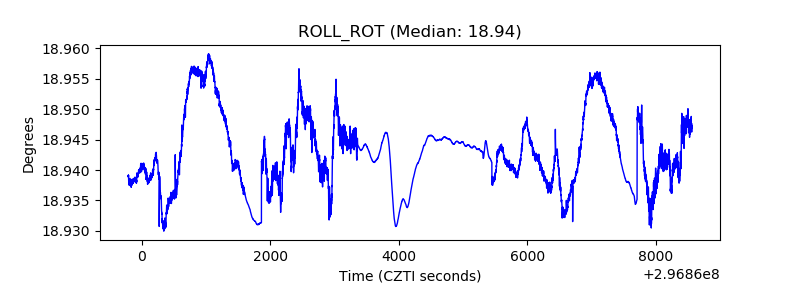 |
| _Roll_DEC | 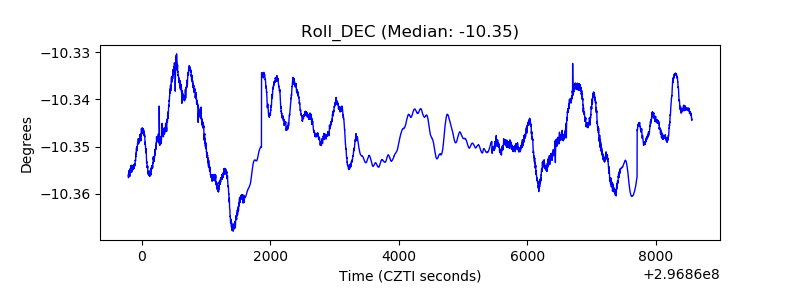 |
| _Roll_RA | 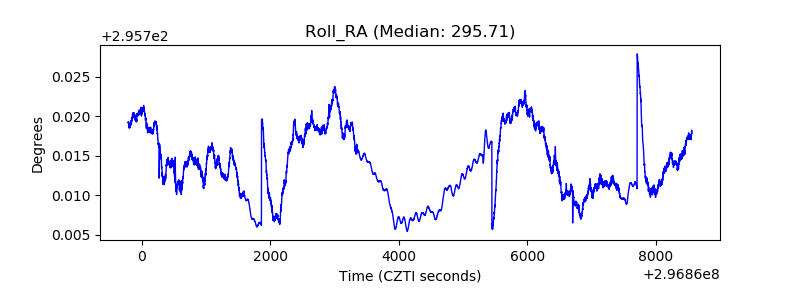 |
| Veto Counter |  |