| Param | Original file | Final file |
|---|---|---|
| Filename | modeM0/AS1T03_118T01_9000002962_19832cztM0_level2.evt | modeM0/AS1T03_118T01_9000002962_19832cztM0_level2_quad_clean.evt |
| Size (bytes) | 480,608,640 | 93,919,680 |
| Size | 458.3 MB | 89.6 MB |
| Events in quadrant A | 3,169,626 | 608,053 |
| Events in quadrant B | 3,288,180 | 620,982 |
| Events in quadrant C | 3,227,499 | 596,363 |
| Events in quadrant D | 4,430,790 | 567,571 |
| Mode SS | |||
|---|---|---|---|
| Quadrant | BADHDUFLAG | Total packets | Discarded packets |
| A | 0 | 130 | 0 |
| B | 0 | 130 | 0 |
| C | 0 | 130 | 0 |
| D | 0 | 130 | 0 |
| Mode M9 | |||
|---|---|---|---|
| Quadrant | BADHDUFLAG | Total packets | Discarded packets |
| A | 0 | 17 | 0 |
| B | 0 | 18 | 0 |
| C | 0 | 18 | 0 |
| D | 0 | 18 | 0 |
| Mode M0 | |||
|---|---|---|---|
| Quadrant | BADHDUFLAG | Total packets | Discarded packets |
| A | 0 | 13517 | 2 |
| B | 0 | 13860 | 2 |
| C | 0 | 13562 | 2 |
| D | 0 | 17322 | 2 |
| Quadrant | Total seconds | Saturated seconds | Saturation percentage |
|---|---|---|---|
| A | 6473 | 29 | 0.448015% |
| B | 6472 | 75 | 1.158838% |
| C | 6472 | 75 | 1.158838% |
| D | 6472 | 200 | 3.090235% |
Noise dominated data is calculated using 1-second bins in cleaned event files. If a bin has >2000 counts, and if more than 50% of those come from <1% of pixels, then it is considered to be noise-dominated and hence unusable.
| Quadrant | # 1 sec bins | Bins with >0 counts | Bins with >2000 counts | High rate bins dominated by noise | Noise dominated (total time) | Noise dominated (detector-on time) | Marked lightcurve |
|---|---|---|---|---|---|---|---|
| A | 7533 | 6474 | 1 | 1 | 0.01% | 0.02% | 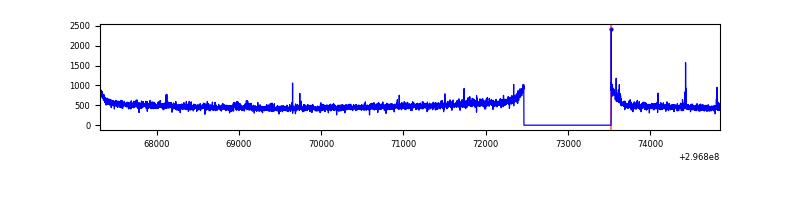 |
| B | 7532 | 6473 | 8 | 8 | 0.11% | 0.12% | 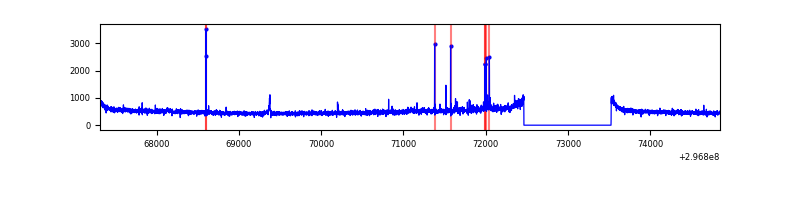 |
| C | 7532 | 6473 | 0 | 0 | 0.00% | 0.00% | 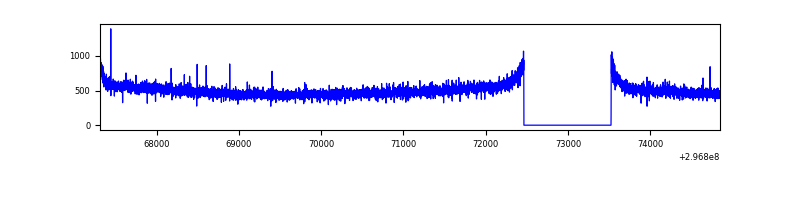 |
| D | 7532 | 6473 | 214 | 214 | 2.84% | 3.31% | 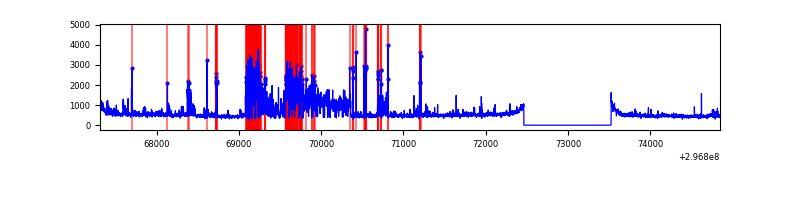 |
Top three noisy pixels from each quadrant. If the there are fewer than three noisy pixels in the level2.evt file, extra rows are filled as -1
| Pixel properties | Quadrant properties | ||||||
|---|---|---|---|---|---|---|---|
| Quadrant | DetID | PixID | Counts | Sigma | Mean | Median | Sigma |
| A | 5 | 16 | 13468 | 77.03 | 816 | 798 | 164.5 |
| A | 0 | 23 | 8373 | 46.05 | 816 | 798 | 164.5 |
| A | 0 | 226 | 7226 | 39.08 | 816 | 798 | 164.5 |
| B | 7 | 220 | 35575 | 222.4 | 817 | 797 | 156.4 |
| B | 12 | 111 | 18731 | 114.68 | 817 | 797 | 156.4 |
| B | 11 | 111 | 16661 | 101.45 | 817 | 797 | 156.4 |
| C | 14 | 238 | 123247 | 653.09 | 796 | 803 | 187.5 |
| C | 13 | 61 | 5454 | 24.8 | 796 | 803 | 187.5 |
| C | 9 | 221 | 3113 | 12.32 | 796 | 803 | 187.5 |
| D | 1 | 20 | 1038649 | 5383.62 | 793 | 770 | 192.8 |
| D | 1 | 52 | 324606 | 1679.78 | 793 | 770 | 192.8 |
| D | 7 | 238 | 38156 | 193.93 | 793 | 770 | 192.8 |
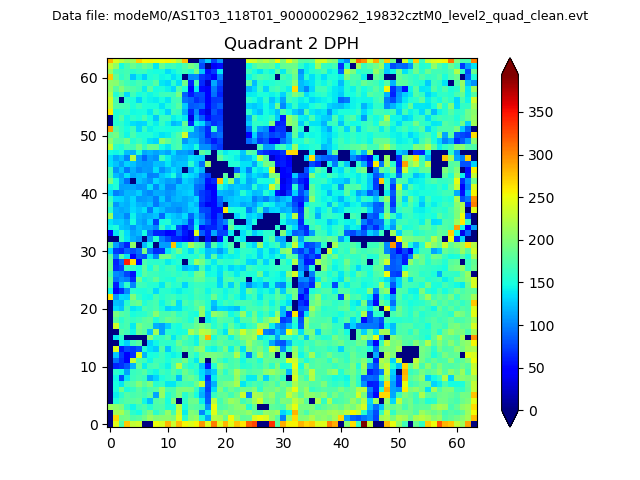
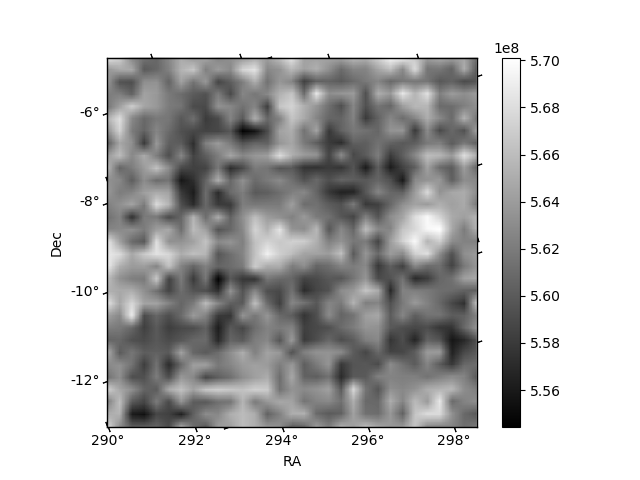
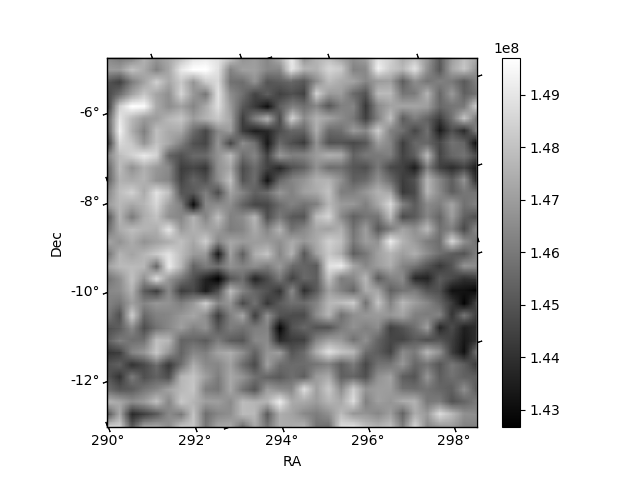
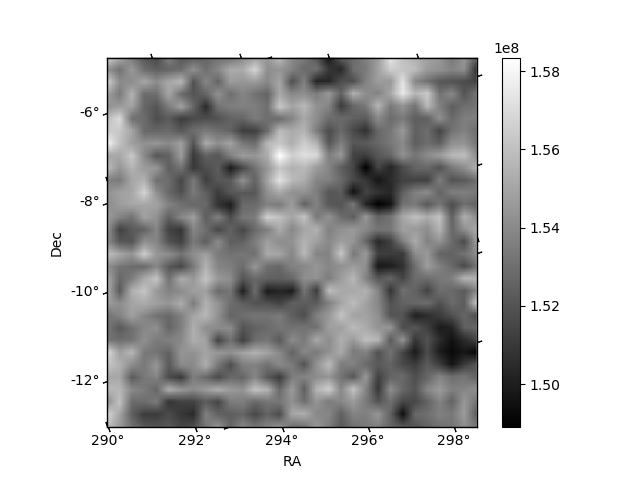
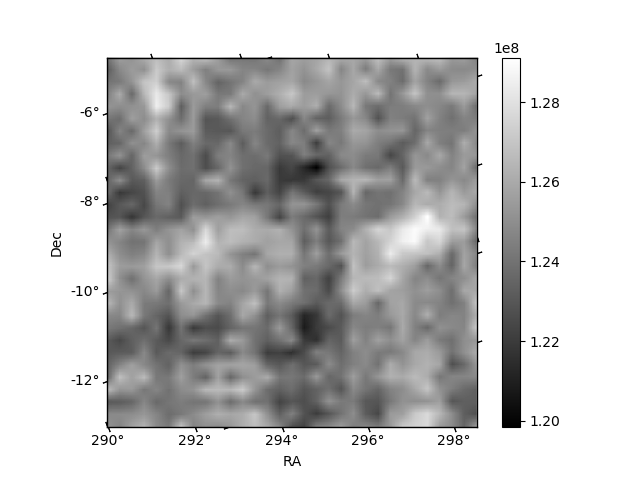
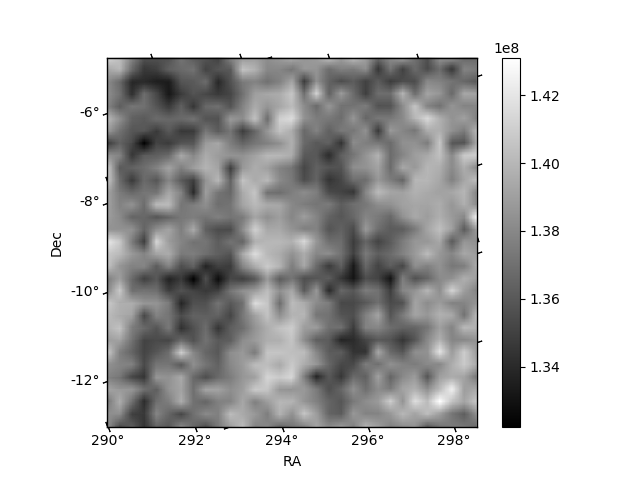
Histogram calculated using DETX and DETY for each event in the final _common_clean file
| Quadrant A | 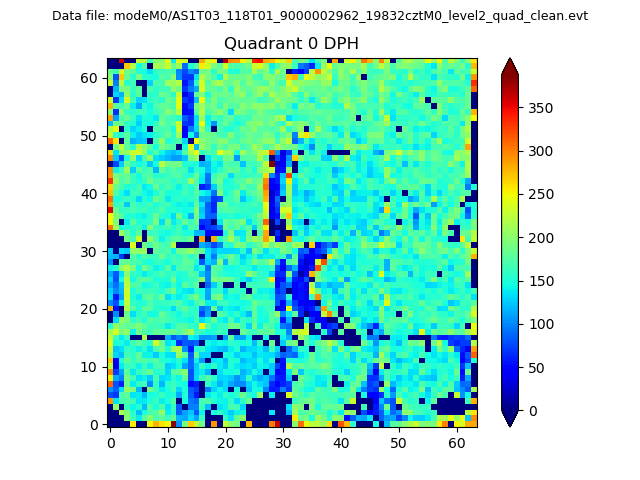 |
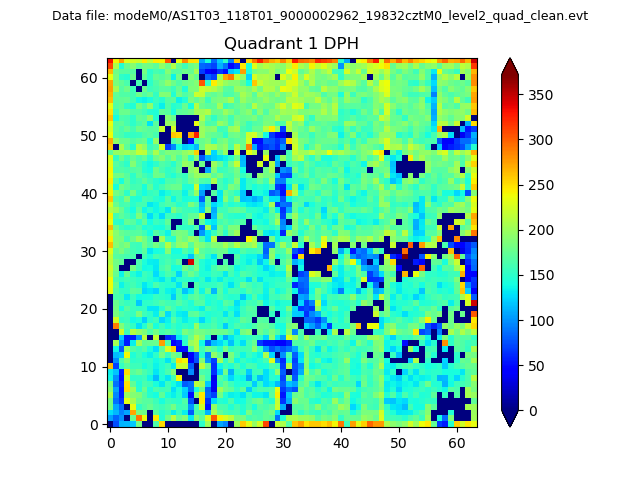 |
Quadrant B |
|---|---|---|---|
| Quadrant D | 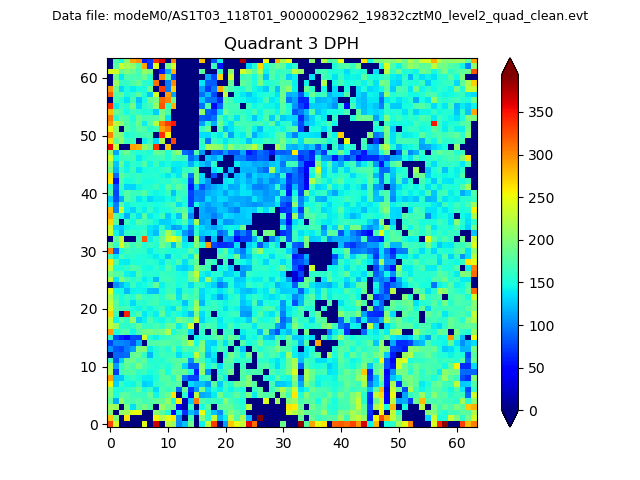 |
 |
Quadrant C |
| Plot type | Count rate plots | Images |
|---|---|---|
| Comparison with Poisson distribution Blue bars denote a histogram of data divided into 1 sec bins. Red curve is a Poisson curve with rate = median count rate of data. |
 |
 |
| Quadrant-wise count rates Data is divided into 100 sec bins |
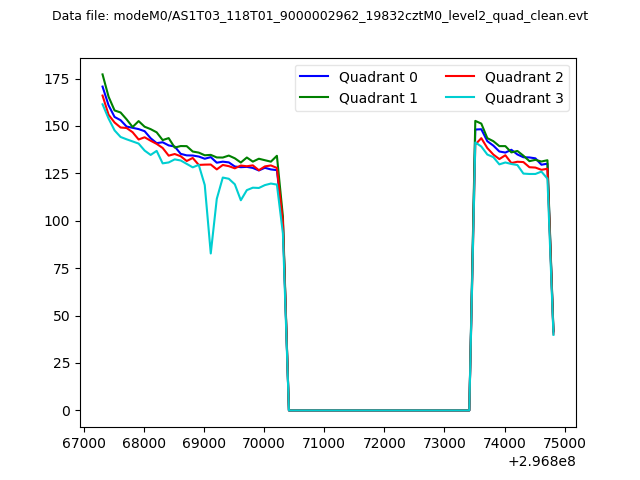 |
|
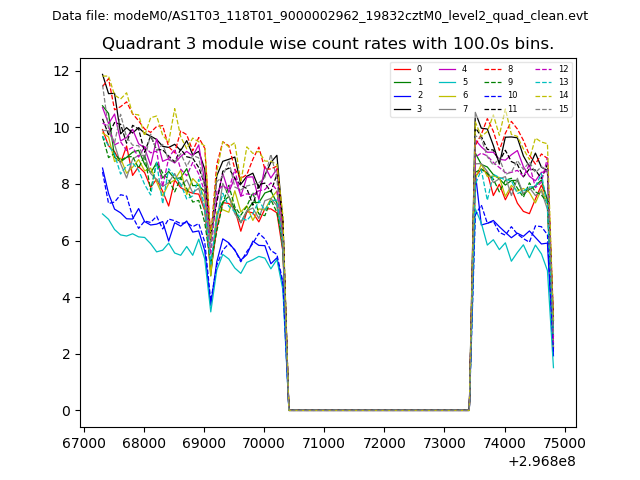
| Module-wise count rates for Quadrant A Data is divided into 100 sec bins |
 |
 |
| Module-wise count rates for Quadrant B Data is divided into 100 sec bins |
 |
 |
| Module-wise count rates for Quadrant C Data is divided into 100 sec bins |
 |
 |
| Module-wise count rates for Quadrant D Data is divided into 100 sec bins |
 |
 |
| Parameter | Plot |
|---|---|
| CZT HV Monitor |  |
| D_VDD | 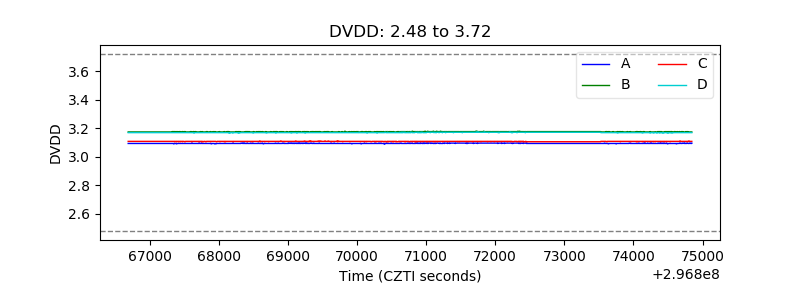 |
| Temperature 1 | 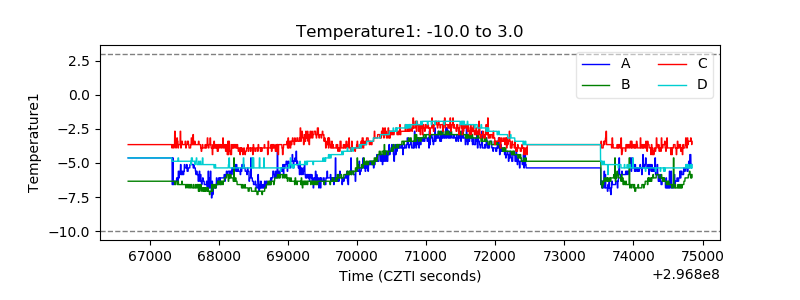 |
| Veto HV Monitor | 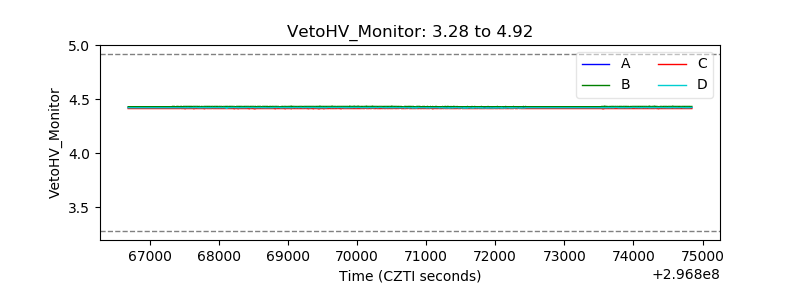 |
| Veto LLD | 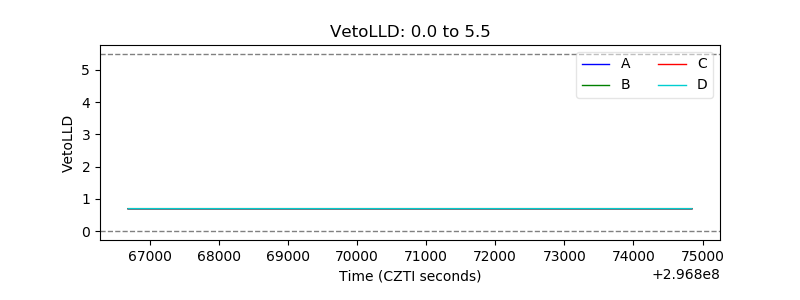 |
| Alpha Counter | 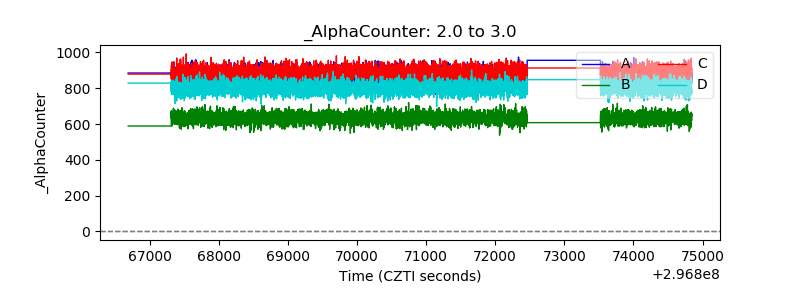 |
| _CPM_Rate | 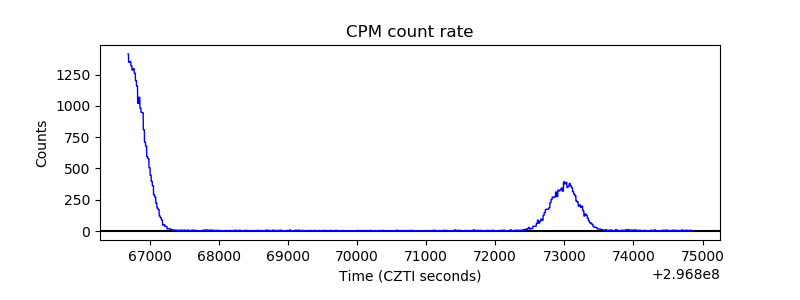 |
| CZT Counter | 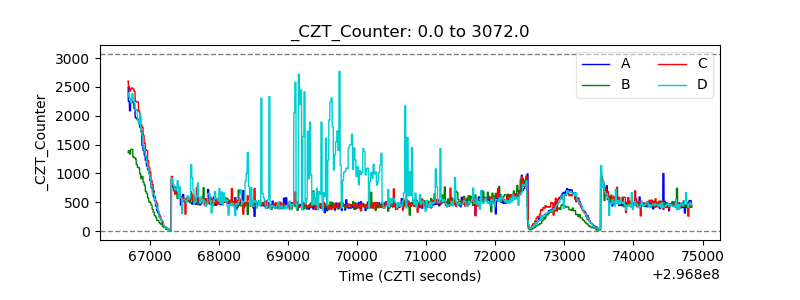 |
| +2.5 Volts monitor |  |
| +5 Volts monitor | 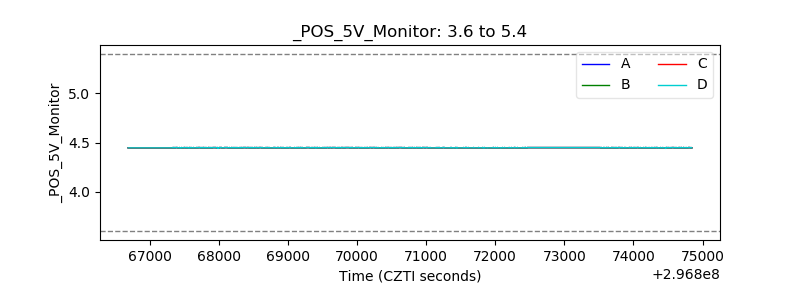 |
| _ROLL_ROT |  |
| _Roll_DEC |  |
| _Roll_RA | 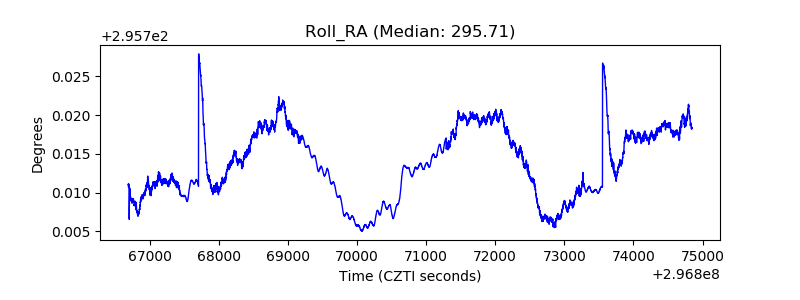 |
| Veto Counter |  |