| Param | Original file | Final file |
|---|---|---|
| Filename | modeM0/AS1T03_118T01_9000002962_19834cztM0_level2.evt | modeM0/AS1T03_118T01_9000002962_19834cztM0_level2_quad_clean.evt |
| Size (bytes) | 563,152,320 | 100,601,280 |
| Size | 537.1 MB | 95.9 MB |
| Events in quadrant A | 5,337,125 | 617,734 |
| Events in quadrant B | 3,570,822 | 662,608 |
| Events in quadrant C | 3,499,728 | 635,378 |
| Events in quadrant D | 4,147,937 | 618,447 |
| Mode SS | |||
|---|---|---|---|
| Quadrant | BADHDUFLAG | Total packets | Discarded packets |
| A | 0 | 150 | 0 |
| B | 0 | 150 | 0 |
| C | 0 | 150 | 0 |
| D | 0 | 150 | 0 |
| Mode M9 | |||
|---|---|---|---|
| Quadrant | BADHDUFLAG | Total packets | Discarded packets |
| A | 0 | 3 | 0 |
| B | 0 | 3 | 0 |
| C | 0 | 3 | 0 |
| D | 0 | 3 | 0 |
| Mode M0 | |||
|---|---|---|---|
| Quadrant | BADHDUFLAG | Total packets | Discarded packets |
| A | 0 | 20871 | 1 |
| B | 0 | 15342 | 1 |
| C | 0 | 15142 | 1 |
| D | 0 | 17274 | 1 |
| Quadrant | Total seconds | Saturated seconds | Saturation percentage |
|---|---|---|---|
| A | 7354 | 804 | 10.932826% |
| B | 7354 | 129 | 1.754147% |
| C | 7354 | 119 | 1.618167% |
| D | 7355 | 156 | 2.121006% |
Noise dominated data is calculated using 1-second bins in cleaned event files. If a bin has >2000 counts, and if more than 50% of those come from <1% of pixels, then it is considered to be noise-dominated and hence unusable.
| Quadrant | # 1 sec bins | Bins with >0 counts | Bins with >2000 counts | High rate bins dominated by noise | Noise dominated (total time) | Noise dominated (detector-on time) | Marked lightcurve |
|---|---|---|---|---|---|---|---|
| A | 7639 | 7354 | 578 | 578 | 7.57% | 7.86% | 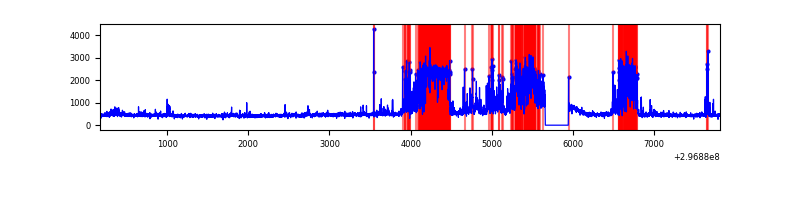 |
| B | 7639 | 7355 | 15 | 15 | 0.20% | 0.20% | 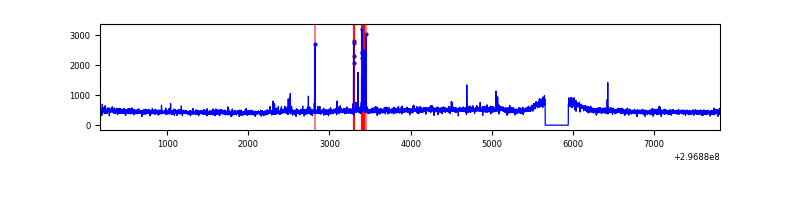 |
| C | 7639 | 7355 | 1 | 1 | 0.01% | 0.01% | 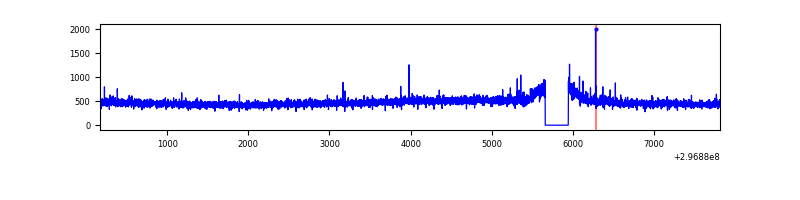 |
| D | 7640 | 7356 | 73 | 73 | 0.96% | 0.99% | 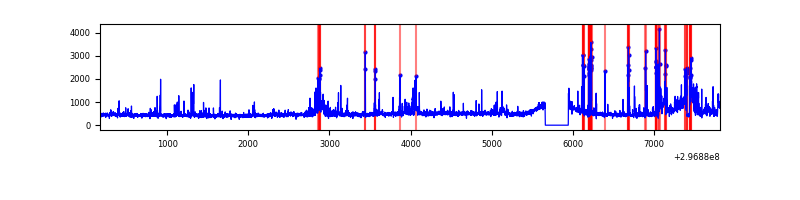 |
Top three noisy pixels from each quadrant. If the there are fewer than three noisy pixels in the level2.evt file, extra rows are filled as -1
| Pixel properties | Quadrant properties | ||||||
|---|---|---|---|---|---|---|---|
| Quadrant | DetID | PixID | Counts | Sigma | Mean | Median | Sigma |
| A | 14 | 238 | 1976127 | 11545.39 | 840 | 822 | 171.1 |
| A | 5 | 16 | 85356 | 494.09 | 840 | 822 | 171.1 |
| A | 14 | 254 | 43944 | 252.04 | 840 | 822 | 171.1 |
| B | 7 | 220 | 55190 | 316.18 | 880 | 853 | 171.9 |
| B | 10 | 245 | 28896 | 163.18 | 880 | 853 | 171.9 |
| B | 12 | 111 | 20889 | 116.59 | 880 | 853 | 171.9 |
| C | 14 | 238 | 130504 | 644.87 | 853 | 860 | 201.0 |
| C | 9 | 221 | 36057 | 175.08 | 853 | 860 | 201.0 |
| C | 13 | 61 | 5941 | 25.27 | 853 | 860 | 201.0 |
| D | 7 | 238 | 419102 | 1985.96 | 863 | 836 | 210.6 |
| D | 1 | 52 | 400288 | 1896.63 | 863 | 836 | 210.6 |
| D | 1 | 20 | 60156 | 281.66 | 863 | 836 | 210.6 |
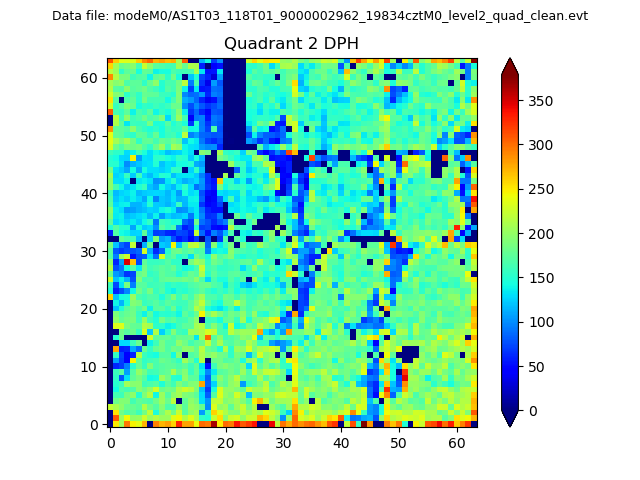
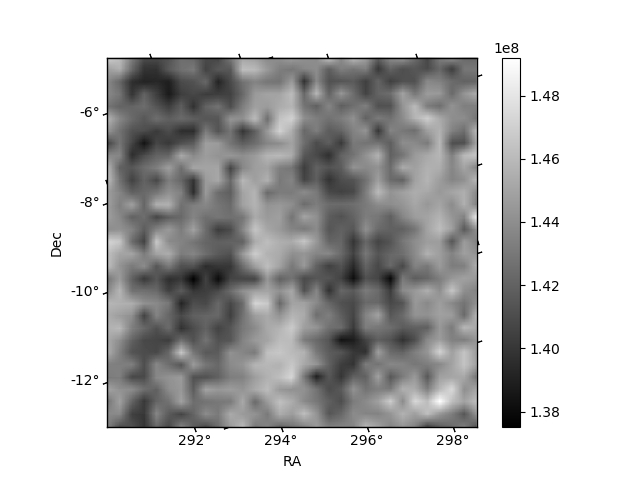
Histogram calculated using DETX and DETY for each event in the final _common_clean file
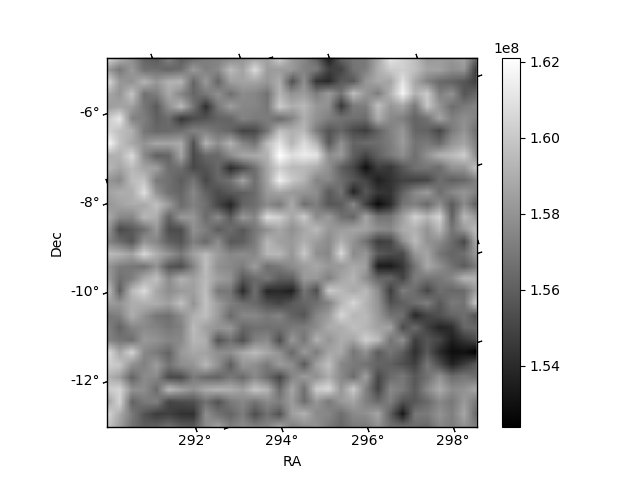
| Quadrant A | 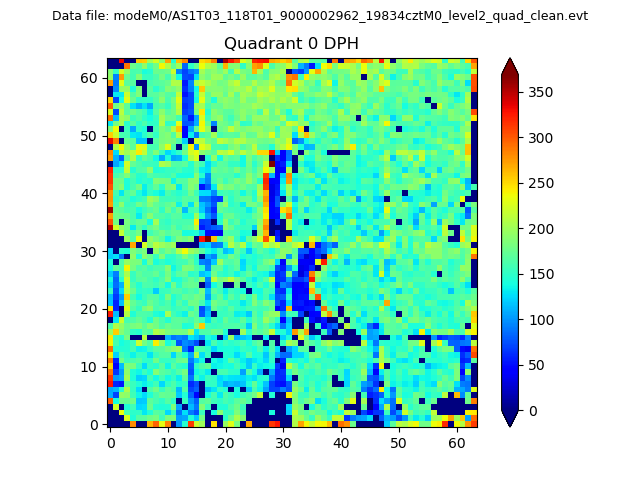 |
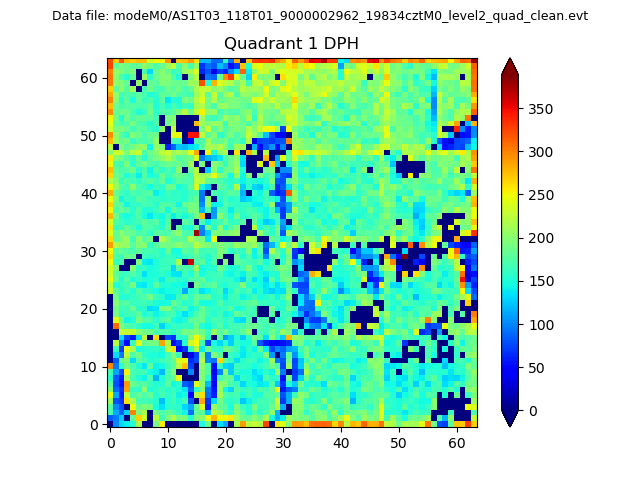 |
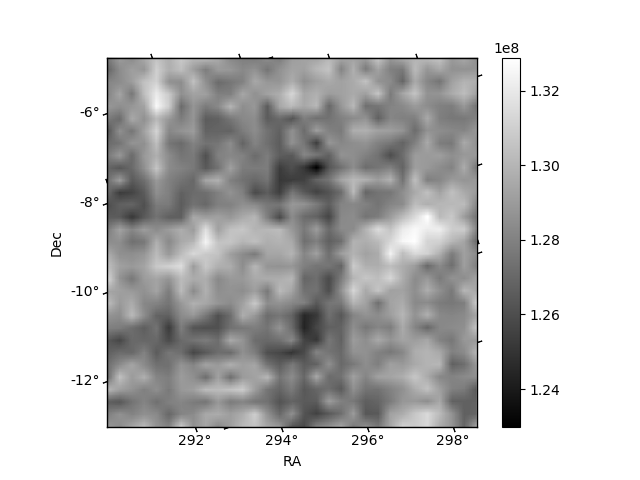
Quadrant B |
|---|---|---|---|
| Quadrant D | 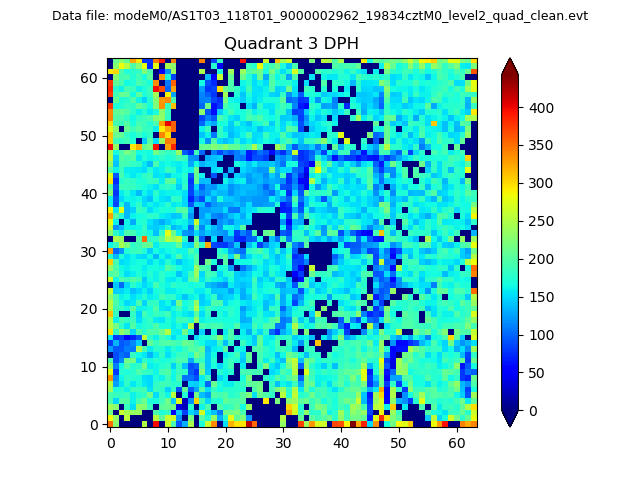 |
 |
Quadrant C |
| Plot type | Count rate plots | Images |
|---|---|---|
| Comparison with Poisson distribution Blue bars denote a histogram of data divided into 1 sec bins. Red curve is a Poisson curve with rate = median count rate of data. |
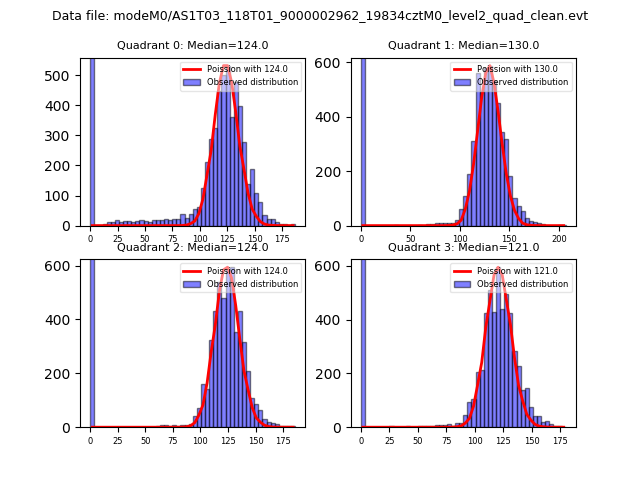 |
 |
| Quadrant-wise count rates Data is divided into 100 sec bins |
 |
|
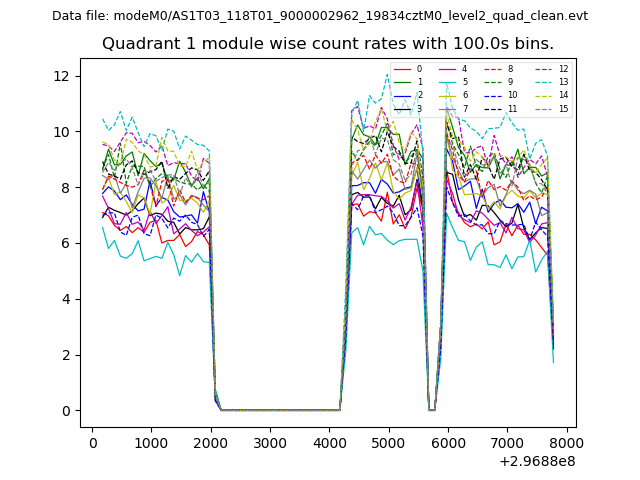
| Module-wise count rates for Quadrant A Data is divided into 100 sec bins |
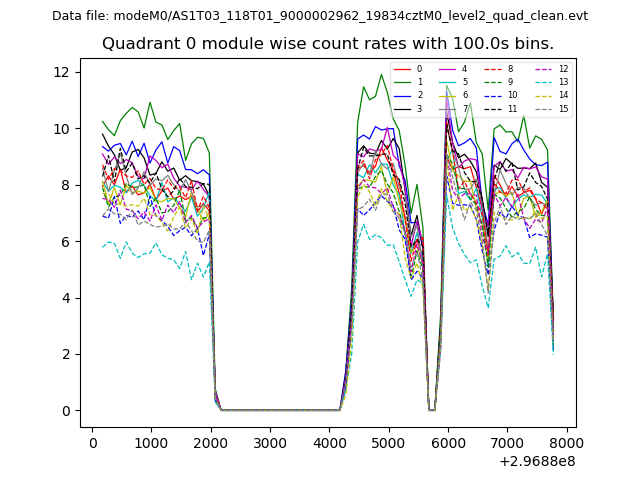 |
 |
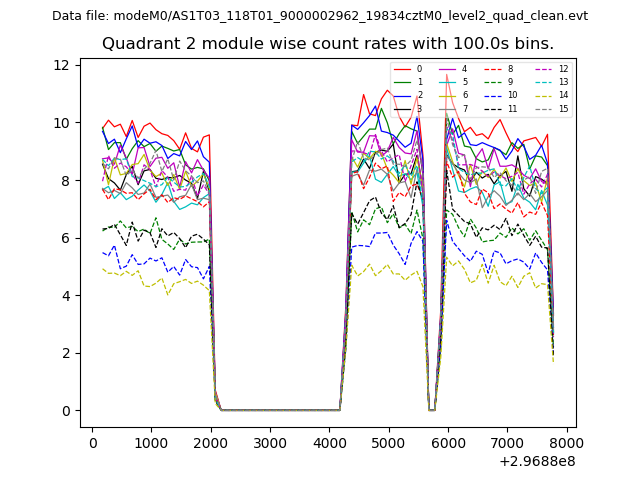
| Module-wise count rates for Quadrant B Data is divided into 100 sec bins |
 |
 |
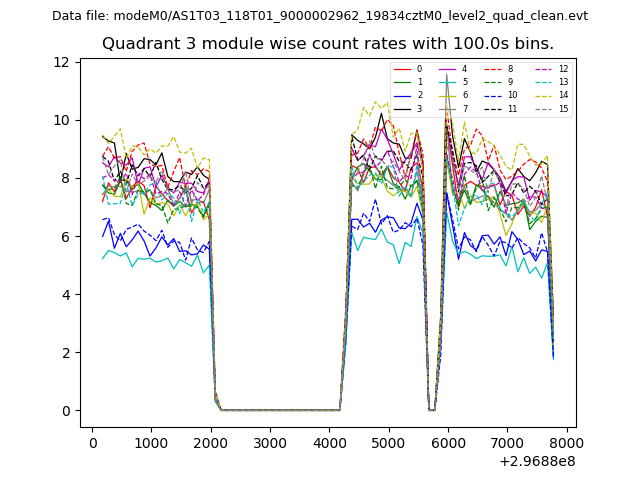
| Module-wise count rates for Quadrant C Data is divided into 100 sec bins |
 |
 |
| Module-wise count rates for Quadrant D Data is divided into 100 sec bins |
 |
 |
| Parameter | Plot |
|---|---|
| CZT HV Monitor |  |
| D_VDD | 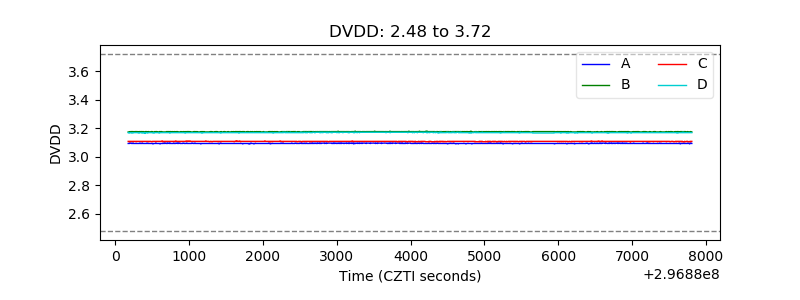 |
| Temperature 1 |  |
| Veto HV Monitor | 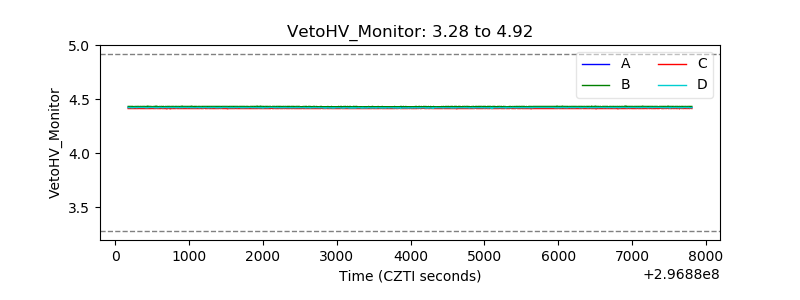 |
| Veto LLD | 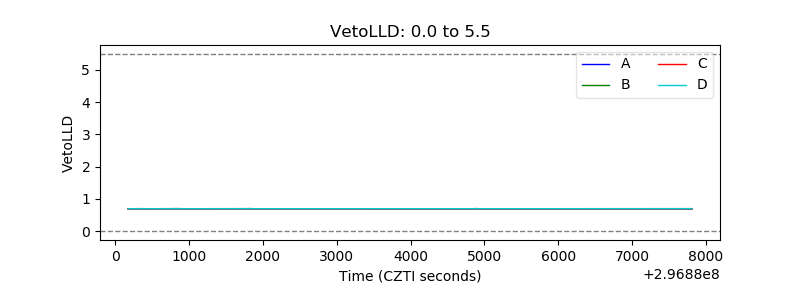 |
| Alpha Counter | 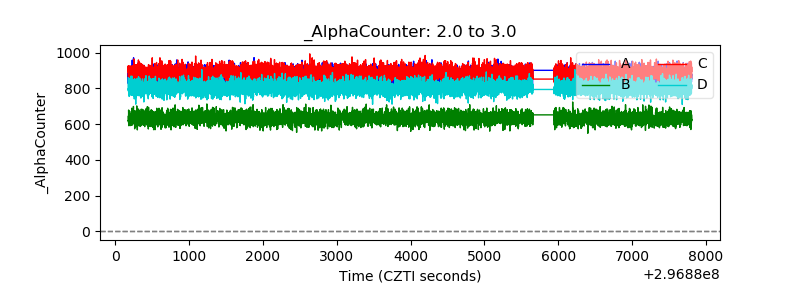 |
| _CPM_Rate | 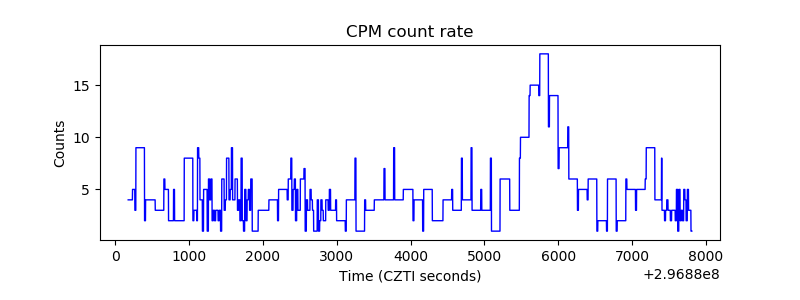 |
| CZT Counter |  |
| +2.5 Volts monitor |  |
| +5 Volts monitor |  |
| _ROLL_ROT | 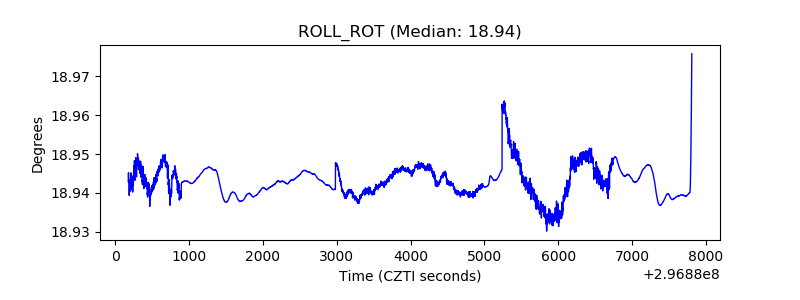 |
| _Roll_DEC | 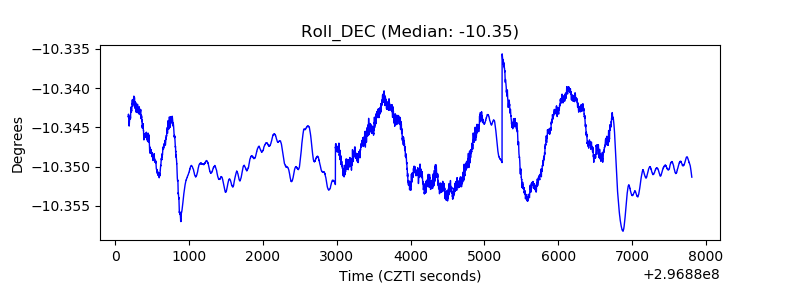 |
| _Roll_RA | 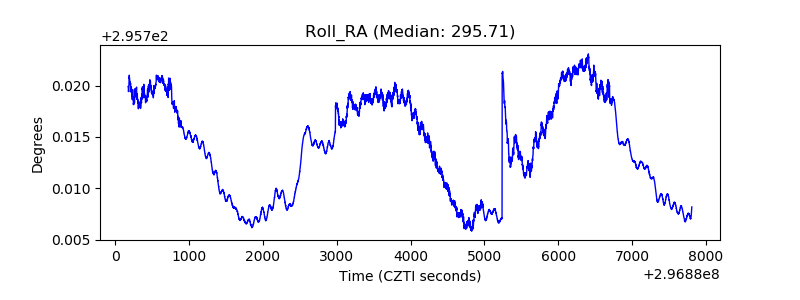 |
| Veto Counter | 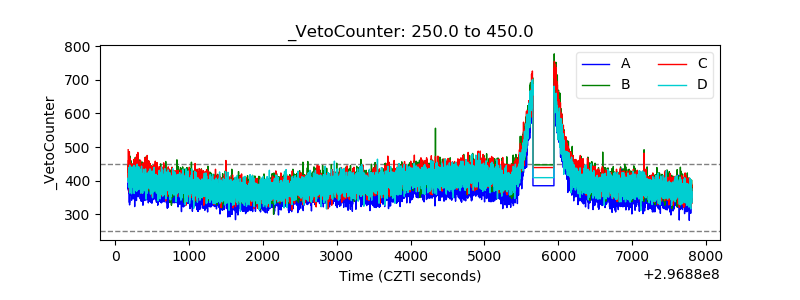 |