| Param | Original file | Final file |
|---|---|---|
| Filename | modeM0/AS1T03_118T01_9000002962_19835cztM0_level2.evt | modeM0/AS1T03_118T01_9000002962_19835cztM0_level2_quad_clean.evt |
| Size (bytes) | 30,260,160 | 6,082,560 |
| Size | 28.9 MB | 5.8 MB |
| Events in quadrant A | 161,111 | 30,209 |
| Events in quadrant B | 299,017 | 57,741 |
| Events in quadrant C | 296,722 | 37,707 |
| Events in quadrant D | 118,451 | 11,920 |
| Mode SS | |||
|---|---|---|---|
| Quadrant | BADHDUFLAG | Total packets | Discarded packets |
| A | 0 | 139947232942984 | 46 |
| B | 0 | -1 | -1 |
| C | 0 | -1 | -1 |
| D | 0 | -1 | -1 |
| Mode M9 | |||
|---|---|---|---|
| Quadrant | BADHDUFLAG | Total packets | Discarded packets |
| A | 0 | 2 | 0 |
| B | 0 | 5 | 0 |
| C | 0 | 2 | 0 |
| D | 0 | 5 | 0 |
| Mode M0 | |||
|---|---|---|---|
| Quadrant | BADHDUFLAG | Total packets | Discarded packets |
| A | 0 | 12202 | 11518 |
| B | 0 | 10153 | 8852 |
| C | 0 | 10151 | 8840 |
| D | 0 | 12655 | 12168 |
| Quadrant | Total seconds | Saturated seconds | Saturation percentage |
|---|---|---|---|
| A | 343 | 1 | 0.291545% |
| B | 651 | 2 | 0.307220% |
| C | 656 | 4 | 0.609756% |
| D | 244 | 1 | 0.409836% |
Noise dominated data is calculated using 1-second bins in cleaned event files. If a bin has >2000 counts, and if more than 50% of those come from <1% of pixels, then it is considered to be noise-dominated and hence unusable.
| Quadrant | # 1 sec bins | Bins with >0 counts | Bins with >2000 counts | High rate bins dominated by noise | Noise dominated (total time) | Noise dominated (detector-on time) | Marked lightcurve |
|---|---|---|---|---|---|---|---|
| A | 19972 | 683 | 0 | 0 | 0.00% | 0.00% | 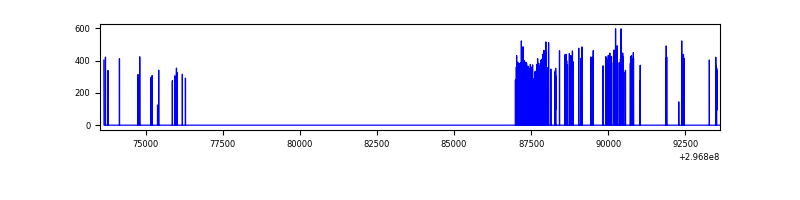 |
| B | 20097 | 1299 | 0 | 0 | 0.00% | 0.00% | 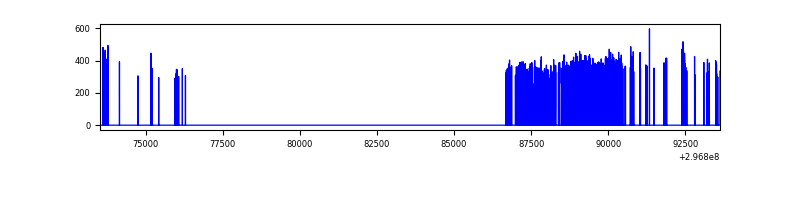 |
| C | 19995 | 1310 | 0 | 0 | 0.00% | 0.00% | 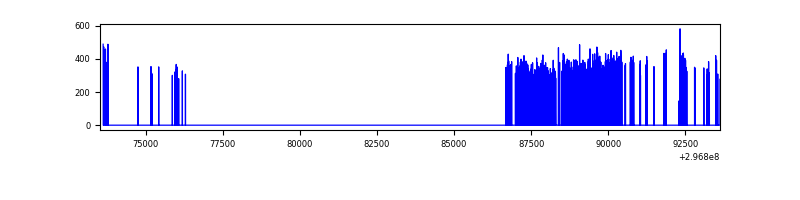 |
| D | 20097 | 484 | 0 | 0 | 0.00% | 0.00% | 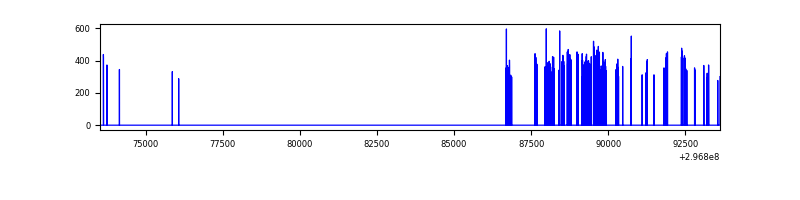 |
Top three noisy pixels from each quadrant. If the there are fewer than three noisy pixels in the level2.evt file, extra rows are filled as -1
| Pixel properties | Quadrant properties | ||||||
|---|---|---|---|---|---|---|---|
| Quadrant | DetID | PixID | Counts | Sigma | Mean | Median | Sigma |
| A | 14 | 238 | 8193 | 804.73 | 39 | 38 | 10.1 |
| A | 5 | 16 | 1615 | 155.62 | 39 | 38 | 10.1 |
| A | 3 | 1 | 473 | 42.93 | 39 | 38 | 10.1 |
| B | 0 | 229 | 3023 | 175.14 | 75 | 73 | 16.8 |
| B | 12 | 111 | 1768 | 100.63 | 75 | 73 | 16.8 |
| B | 11 | 111 | 1611 | 91.31 | 75 | 73 | 16.8 |
| C | 14 | 238 | 11206 | 594.9 | 72 | 73 | 18.7 |
| C | 9 | 221 | 948 | 46.76 | 72 | 73 | 18.7 |
| C | 13 | 61 | 500 | 22.82 | 72 | 73 | 18.7 |
| D | 1 | 52 | 8297 | 951.95 | 28 | 26 | 8.7 |
| D | 7 | 238 | 2068 | 235.02 | 28 | 26 | 8.7 |
| D | 2 | 234 | 1222 | 137.65 | 28 | 26 | 8.7 |
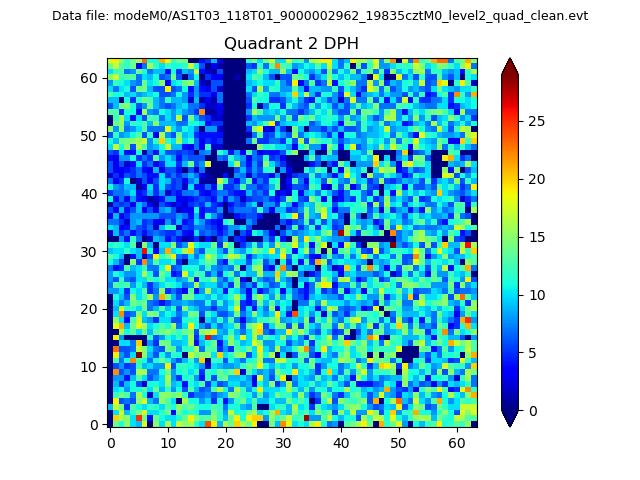
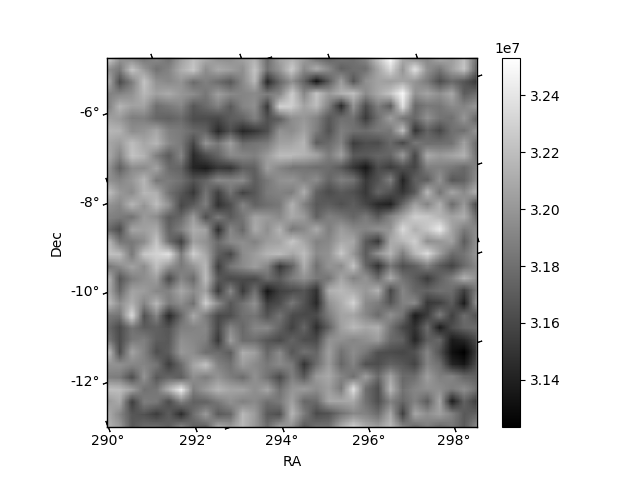
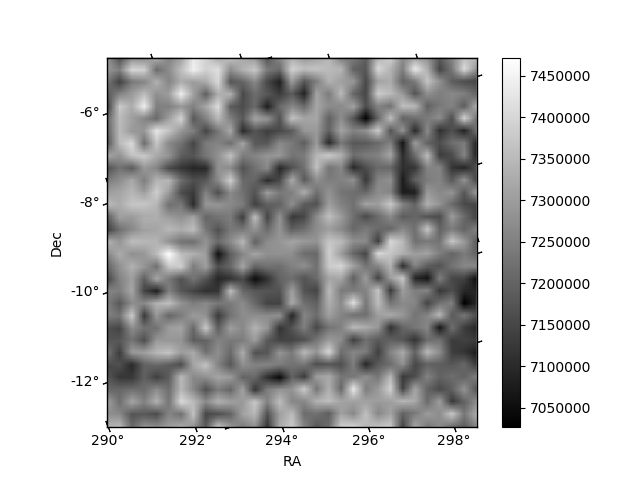
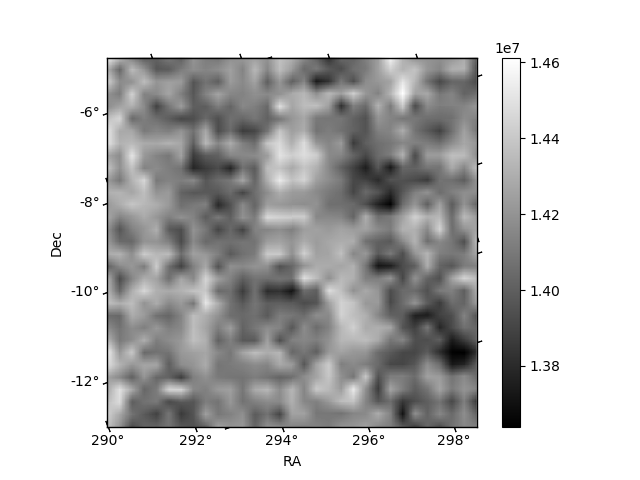
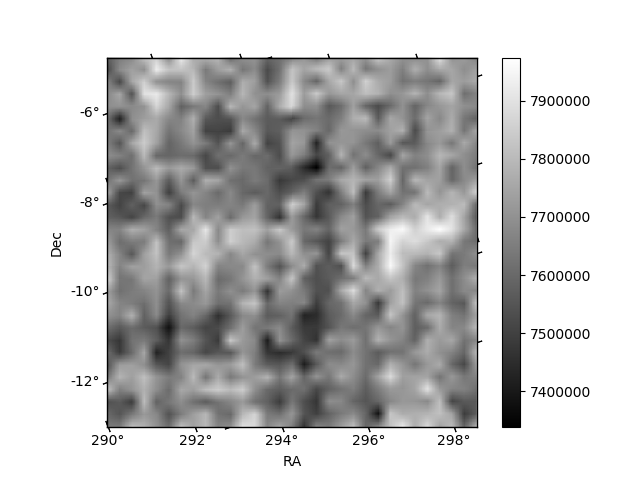
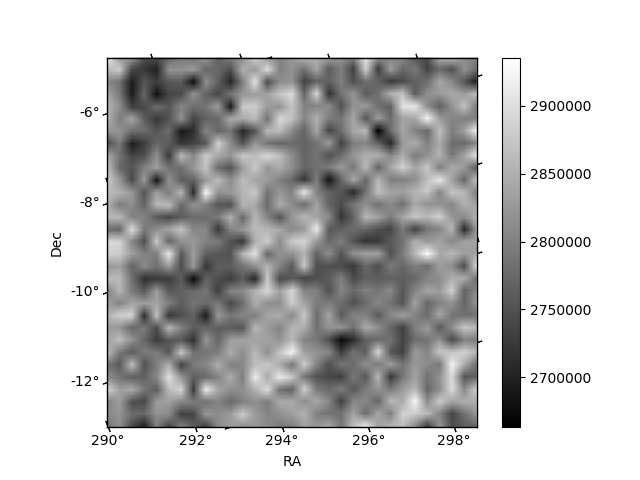
Histogram calculated using DETX and DETY for each event in the final _common_clean file
| Quadrant A | 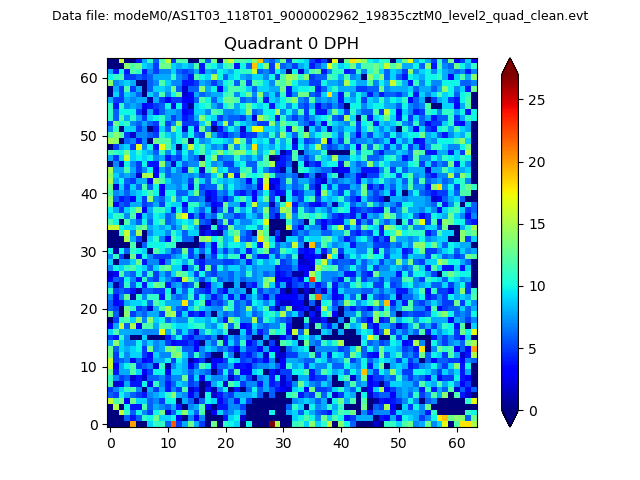 |
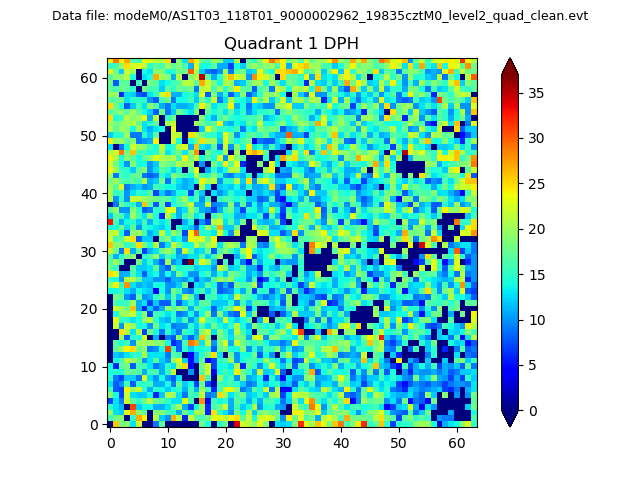 |
Quadrant B |
|---|---|---|---|
| Quadrant D | 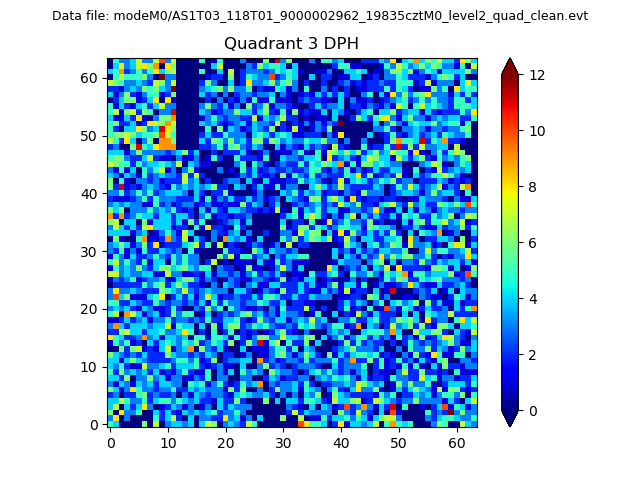 |
 |
Quadrant C |
| Plot type | Count rate plots | Images |
|---|---|---|
| Comparison with Poisson distribution Blue bars denote a histogram of data divided into 1 sec bins. Red curve is a Poisson curve with rate = median count rate of data. |
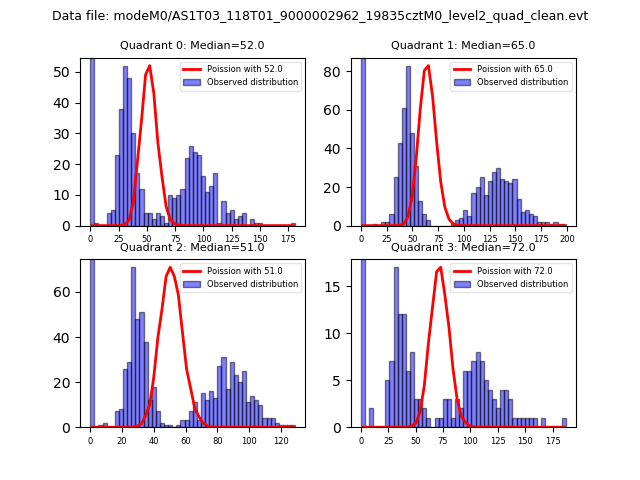 |
 |
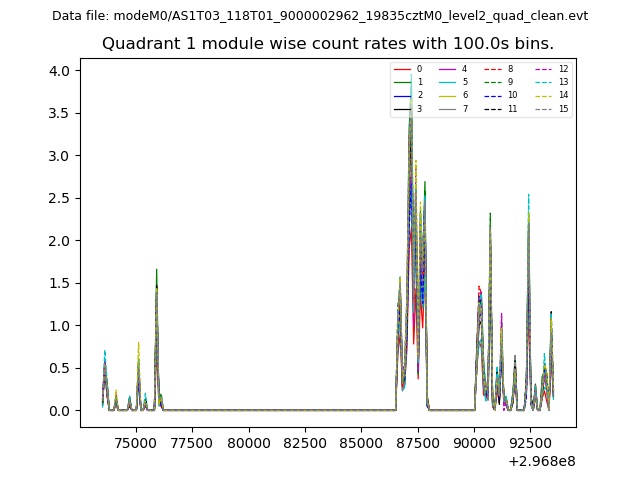
| Quadrant-wise count rates Data is divided into 100 sec bins |
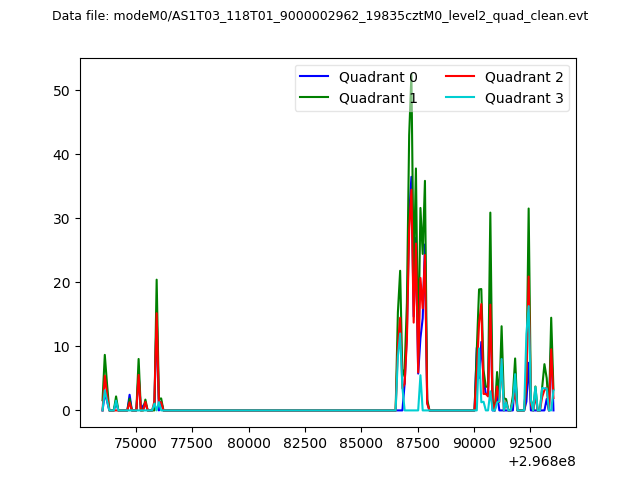 |
|
| Module-wise count rates for Quadrant A Data is divided into 100 sec bins |
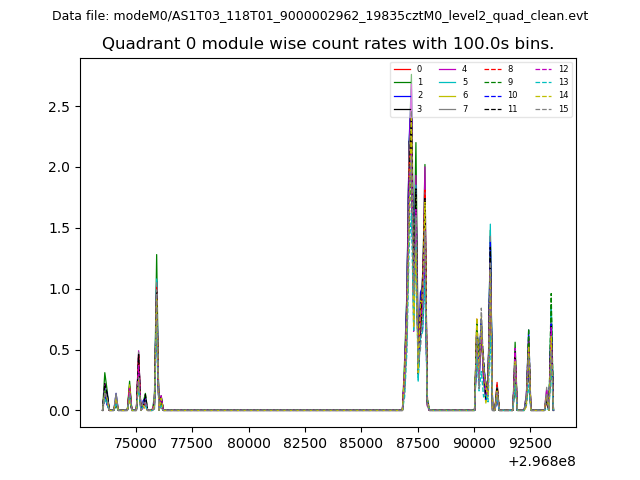 |
 |
| Module-wise count rates for Quadrant B Data is divided into 100 sec bins |
 |
 |
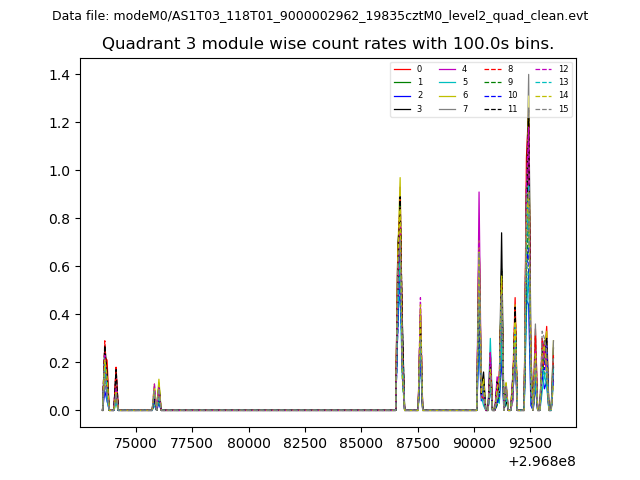
| Module-wise count rates for Quadrant C Data is divided into 100 sec bins |
 |
 |
| Module-wise count rates for Quadrant D Data is divided into 100 sec bins |
 |
 |
| Parameter | Plot |
|---|---|
| CZT HV Monitor |  |
| D_VDD | 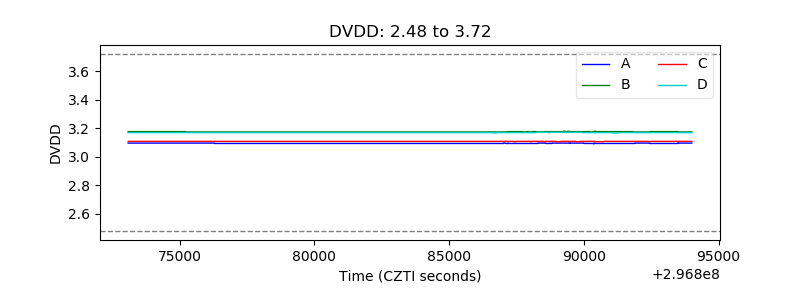 |
| Temperature 1 | 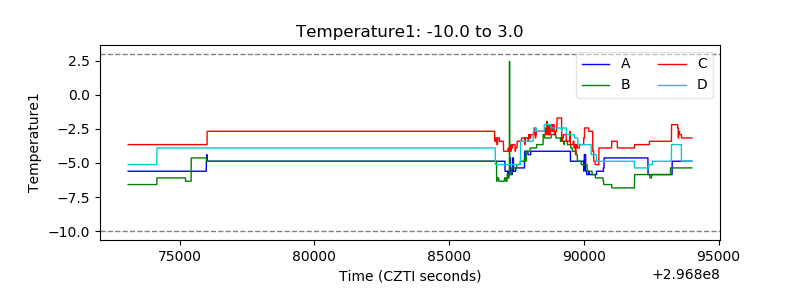 |
| Veto HV Monitor | 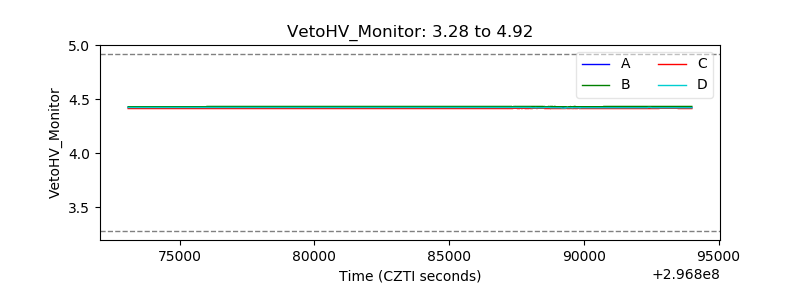 |
| Veto LLD | 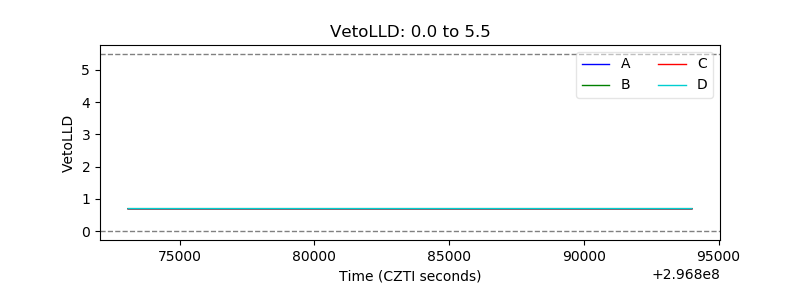 |
| Alpha Counter | 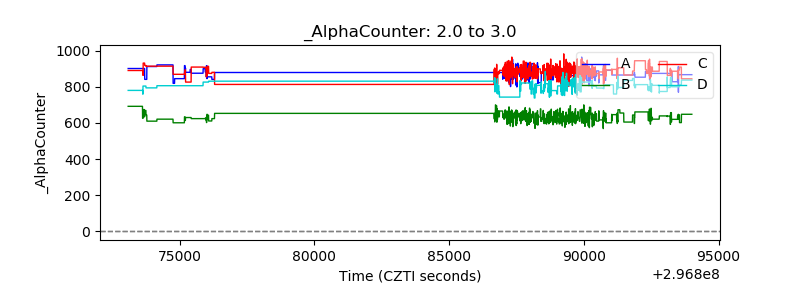 |
| _CPM_Rate | 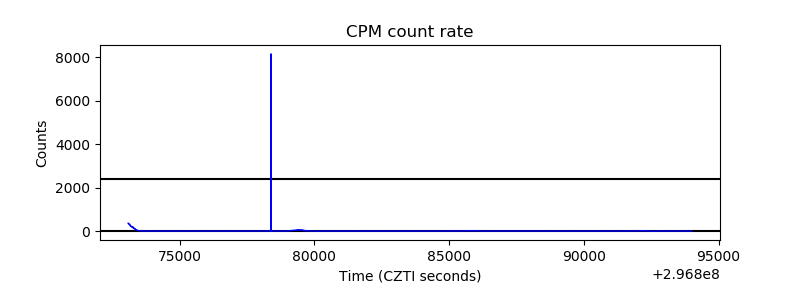 |
| CZT Counter | 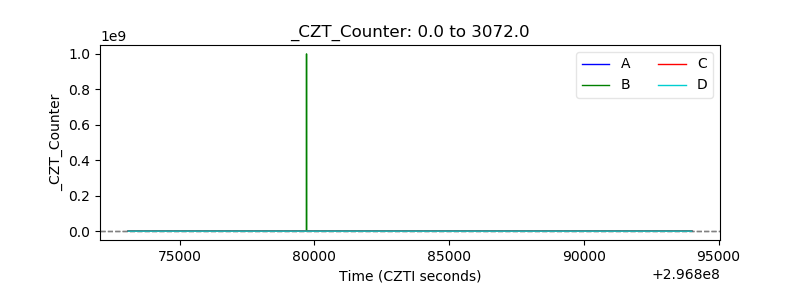 |
| +2.5 Volts monitor | 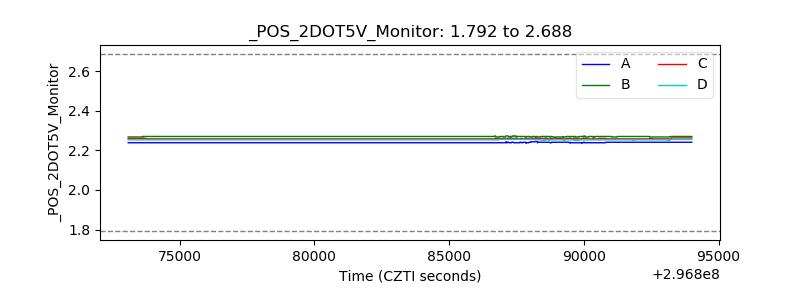 |
| +5 Volts monitor |  |
| _ROLL_ROT | 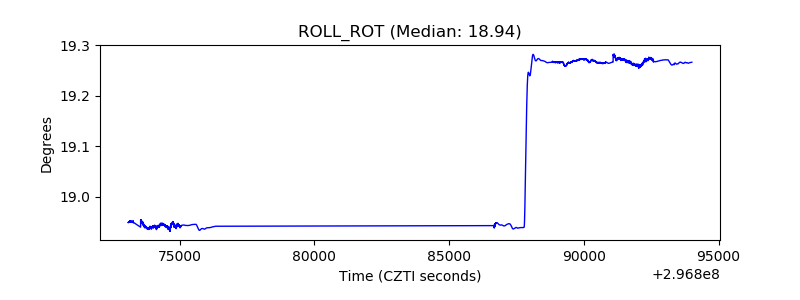 |
| _Roll_DEC | 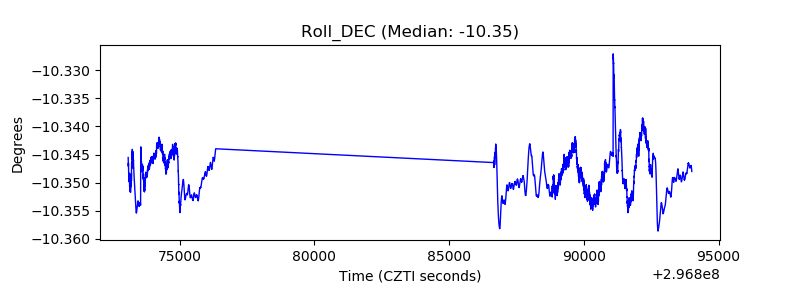 |
| _Roll_RA | 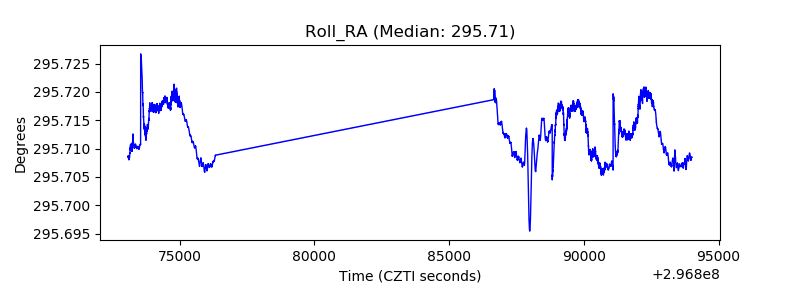 |
| Veto Counter | 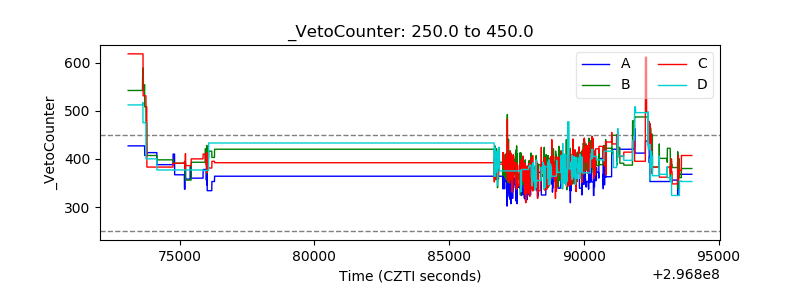 |