| Param | Original file | Final file |
|---|---|---|
| Filename | modeM0/AS1T03_118T01_9000002962_19839cztM0_level2.evt | modeM0/AS1T03_118T01_9000002962_19839cztM0_level2_quad_clean.evt |
| Size (bytes) | 2,928,283,200 | 501,739,200 |
| Size | 2.7 GB | 478.5 MB |
| Events in quadrant A | 22,871,417 | 3,116,449 |
| Events in quadrant B | 20,581,417 | 3,186,164 |
| Events in quadrant C | 19,997,298 | 3,051,509 |
| Events in quadrant D | 22,418,010 | 2,979,152 |
| Mode SS | |||
|---|---|---|---|
| Quadrant | BADHDUFLAG | Total packets | Discarded packets |
| A | 0 | 848 | 0 |
| B | 0 | 848 | 0 |
| C | 0 | 848 | 0 |
| D | 0 | 848 | 0 |
| Mode M9 | |||
|---|---|---|---|
| Quadrant | BADHDUFLAG | Total packets | Discarded packets |
| A | 0 | 42 | 0 |
| B | 0 | 43 | 0 |
| C | 0 | 43 | 0 |
| D | 0 | 43 | 0 |
| Mode M0 | |||
|---|---|---|---|
| Quadrant | BADHDUFLAG | Total packets | Discarded packets |
| A | 0 | 95024 | 10 |
| B | 0 | 87490 | 8 |
| C | 0 | 85883 | 8 |
| D | 0 | 94676 | 8 |
| Quadrant | Total seconds | Saturated seconds | Saturation percentage |
|---|---|---|---|
| A | 41697 | 1502 | 3.602178% |
| B | 41698 | 705 | 1.690729% |
| C | 41698 | 698 | 1.673941% |
| D | 41698 | 1041 | 2.496523% |
Noise dominated data is calculated using 1-second bins in cleaned event files. If a bin has >2000 counts, and if more than 50% of those come from <1% of pixels, then it is considered to be noise-dominated and hence unusable.
| Quadrant | # 1 sec bins | Bins with >0 counts | Bins with >2000 counts | High rate bins dominated by noise | Noise dominated (total time) | Noise dominated (detector-on time) | Marked lightcurve |
|---|---|---|---|---|---|---|---|
| A | 45498 | 41699 | 750 | 750 | 1.65% | 1.80% | 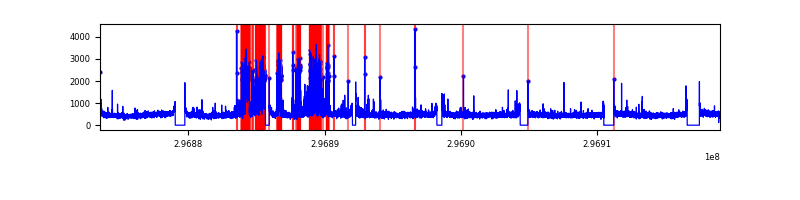 |
| B | 45498 | 41700 | 40 | 40 | 0.09% | 0.10% | 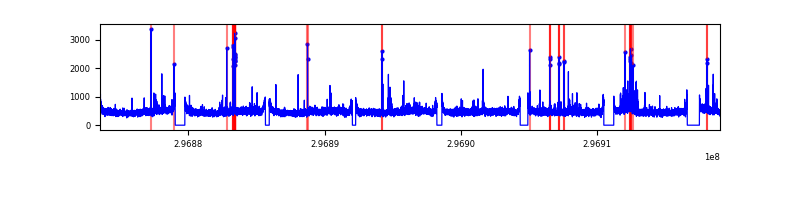 |
| C | 45498 | 41701 | 1 | 1 | 0.00% | 0.00% | 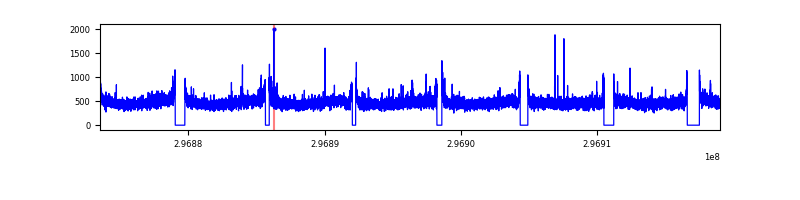 |
| D | 45498 | 41700 | 509 | 509 | 1.12% | 1.22% | 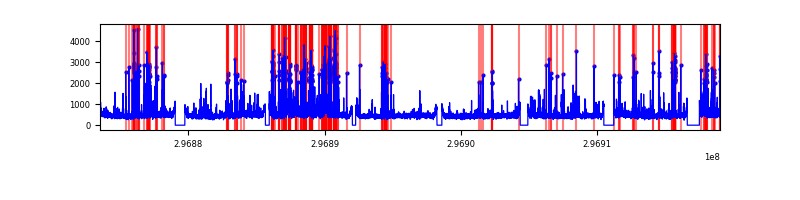 |
Top three noisy pixels from each quadrant. If the there are fewer than three noisy pixels in the level2.evt file, extra rows are filled as -1
| Pixel properties | Quadrant properties | ||||||
|---|---|---|---|---|---|---|---|
| Quadrant | DetID | PixID | Counts | Sigma | Mean | Median | Sigma |
| A | 14 | 238 | 3209217 | 3171.17 | 5027 | 4918 | 1010.4 |
| A | 5 | 16 | 210028 | 202.99 | 5027 | 4918 | 1010.4 |
| A | 14 | 254 | 53015 | 47.6 | 5027 | 4918 | 1010.4 |
| B | 10 | 245 | 237506 | 241.34 | 5050 | 4916 | 963.8 |
| B | 7 | 220 | 194339 | 196.55 | 5050 | 4916 | 963.8 |
| B | 0 | 198 | 143415 | 143.71 | 5050 | 4916 | 963.8 |
| C | 14 | 238 | 752097 | 652.99 | 4881 | 4903 | 1144.3 |
| C | 9 | 221 | 174731 | 148.42 | 4881 | 4903 | 1144.3 |
| C | 3 | 233 | 38389 | 29.26 | 4881 | 4903 | 1144.3 |
| D | 1 | 52 | 1939234 | 1626.75 | 4931 | 4791 | 1189.1 |
| D | 7 | 238 | 1141645 | 956.03 | 4931 | 4791 | 1189.1 |
| D | 7 | 96 | 317301 | 262.8 | 4931 | 4791 | 1189.1 |
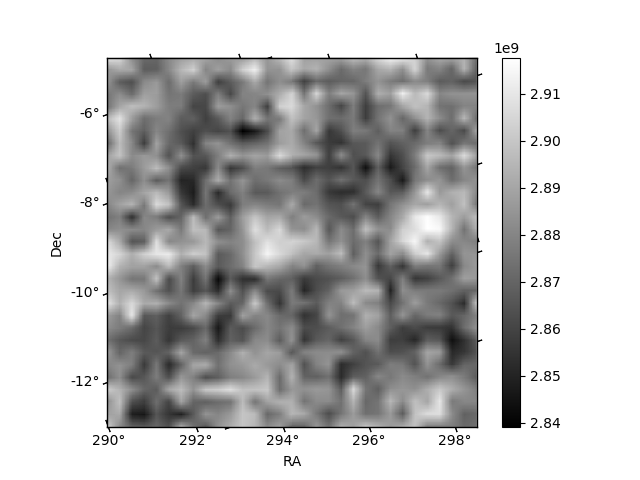
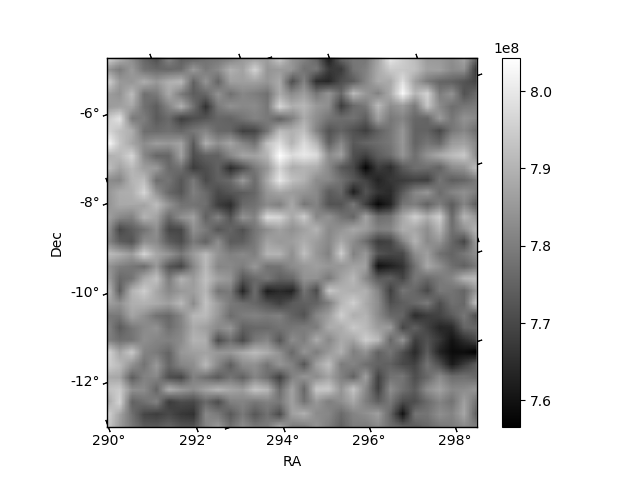
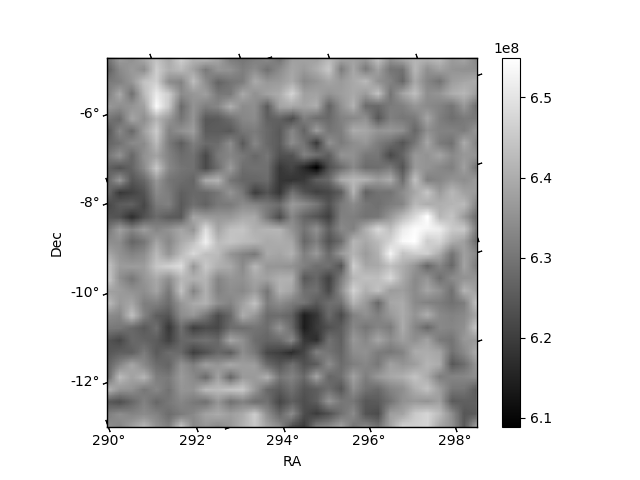
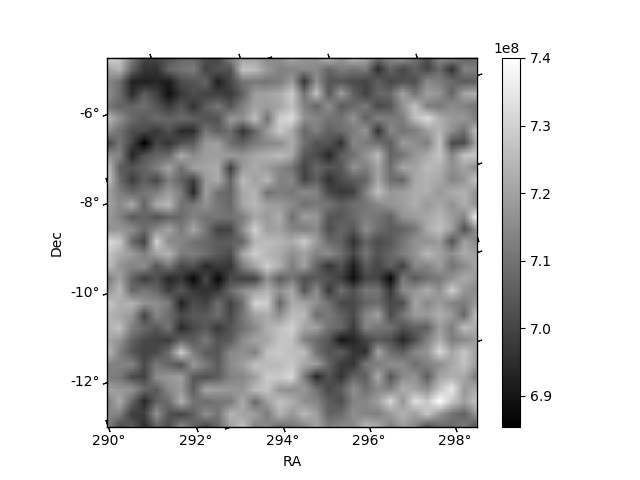
Histogram calculated using DETX and DETY for each event in the final _common_clean file
| Quadrant A | 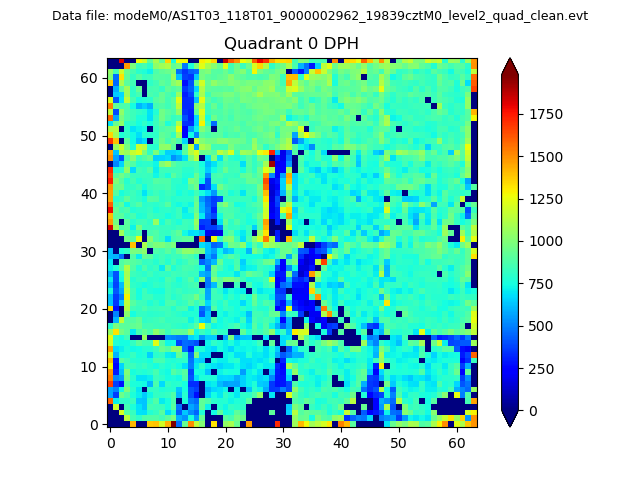 |
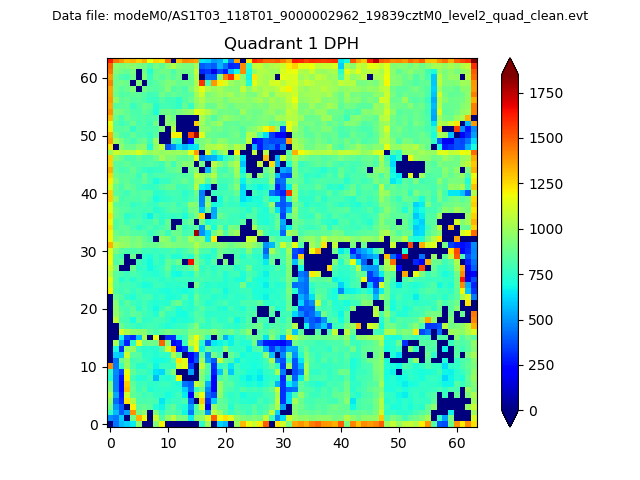 |
Quadrant B |
|---|---|---|---|
| Quadrant D | 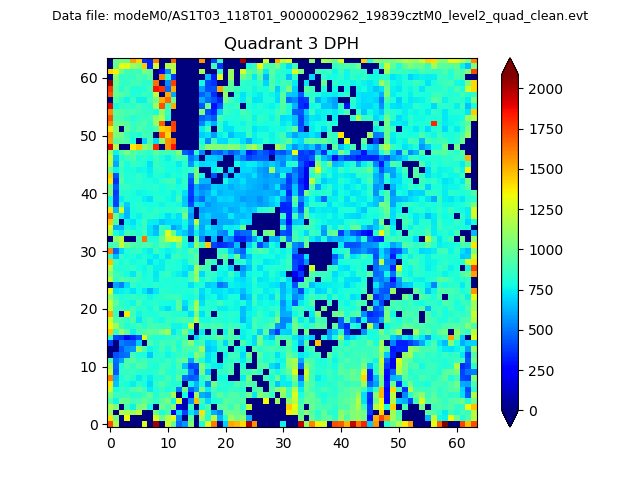 |
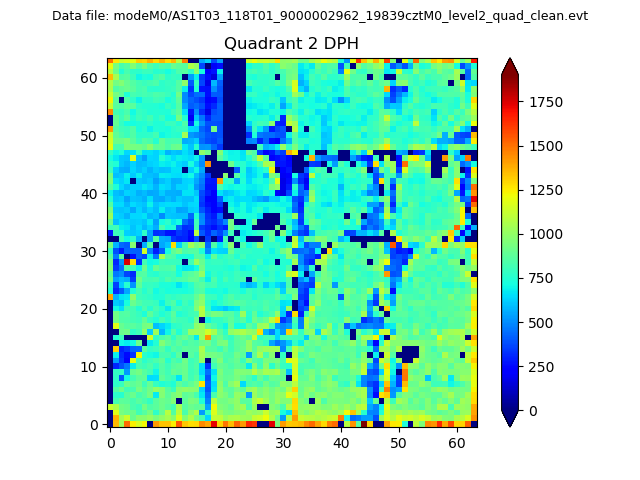 |
Quadrant C |
| Plot type | Count rate plots | Images |
|---|---|---|
| Comparison with Poisson distribution Blue bars denote a histogram of data divided into 1 sec bins. Red curve is a Poisson curve with rate = median count rate of data. |
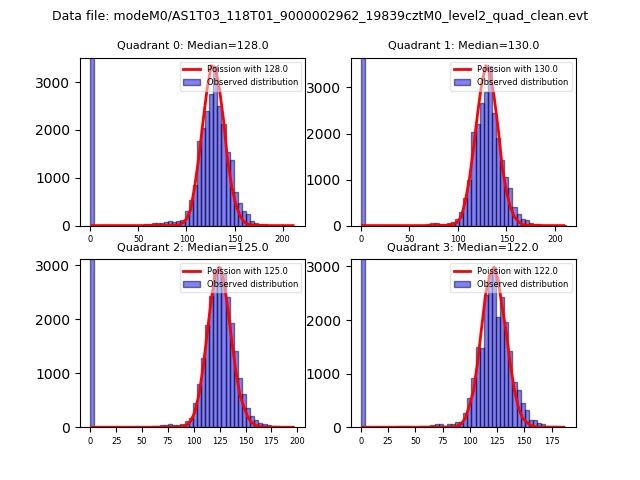 |
 |
| Quadrant-wise count rates Data is divided into 100 sec bins |
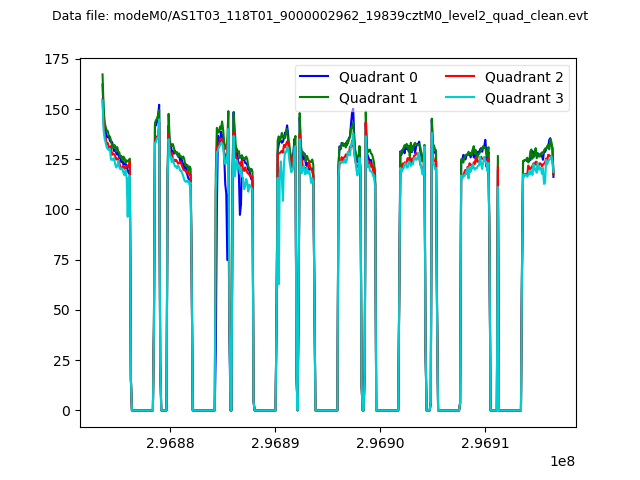 |
|
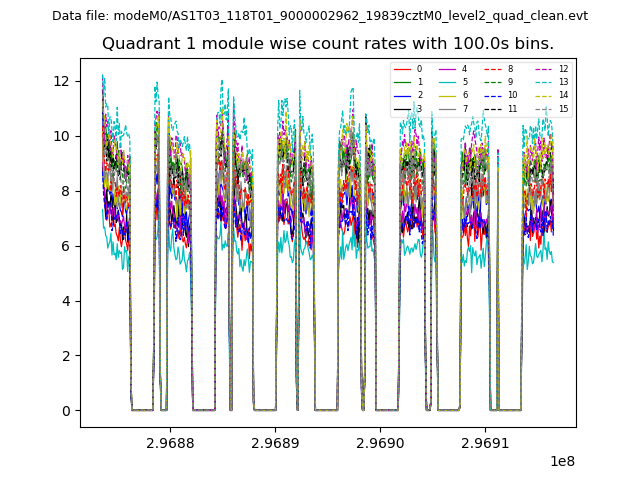
| Module-wise count rates for Quadrant A Data is divided into 100 sec bins |
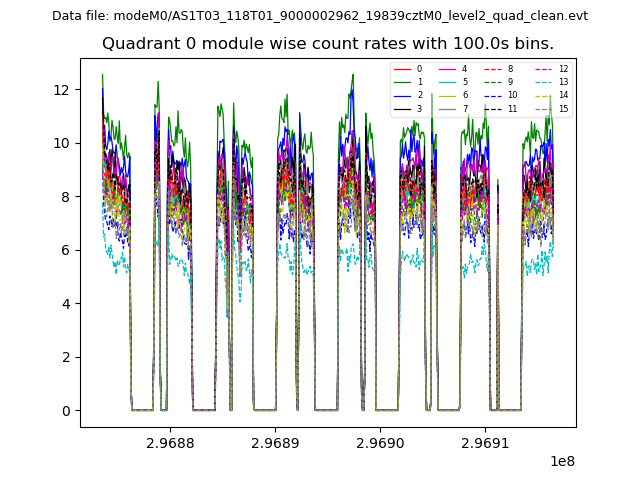 |
 |
| Module-wise count rates for Quadrant B Data is divided into 100 sec bins |
 |
 |
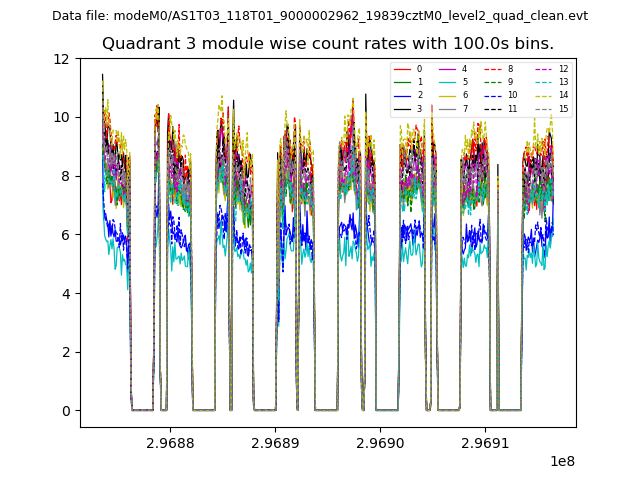
| Module-wise count rates for Quadrant C Data is divided into 100 sec bins |
 |
 |
| Module-wise count rates for Quadrant D Data is divided into 100 sec bins |
 |
 |
| Parameter | Plot |
|---|---|
| CZT HV Monitor |  |
| D_VDD | 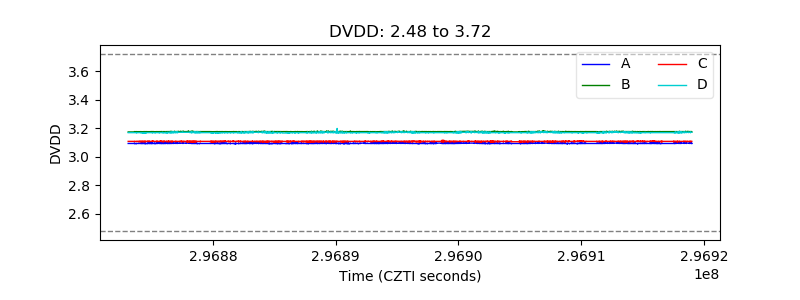 |
| Temperature 1 | 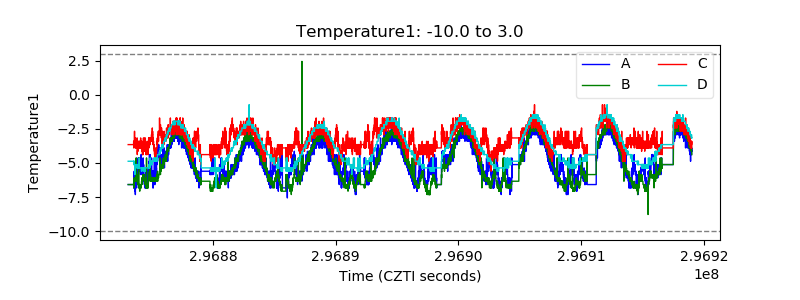 |
| Veto HV Monitor | 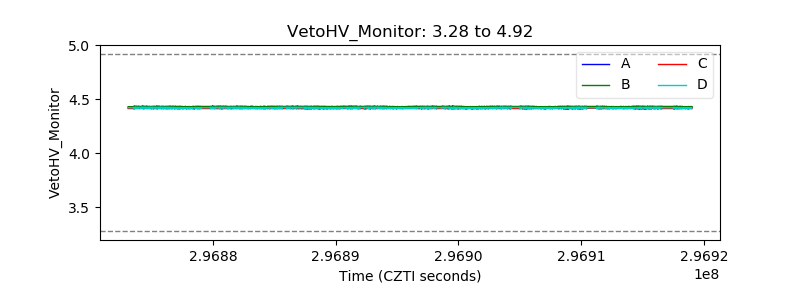 |
| Veto LLD | 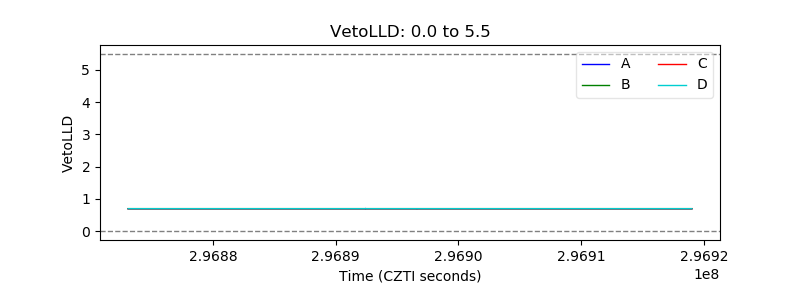 |
| Alpha Counter | 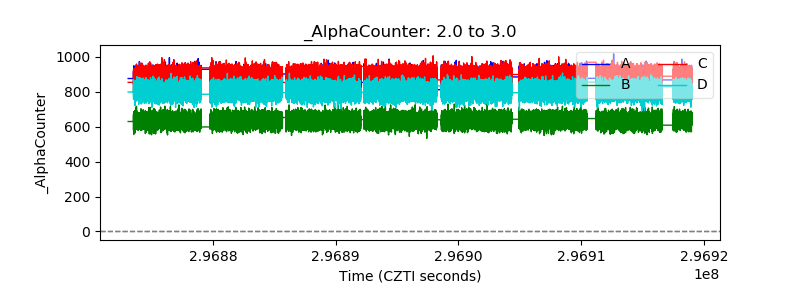 |
| _CPM_Rate | 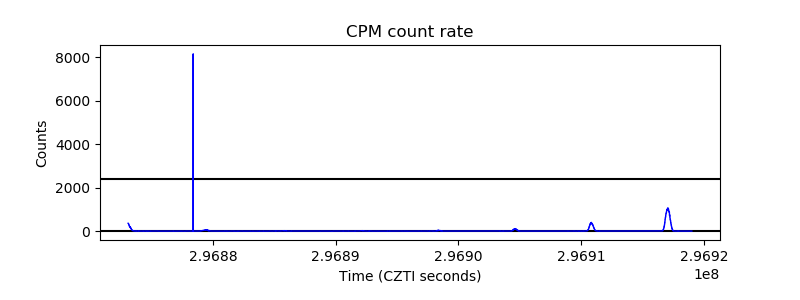 |
| CZT Counter | 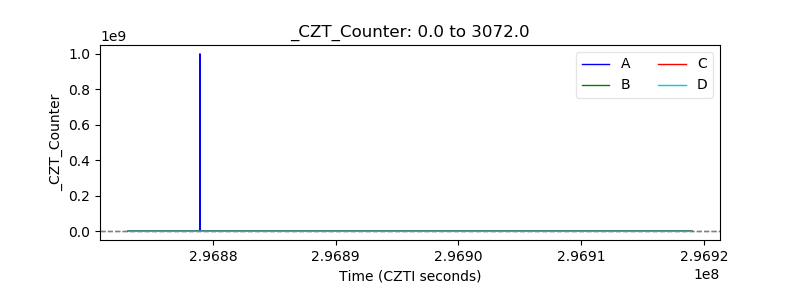 |
| +2.5 Volts monitor | 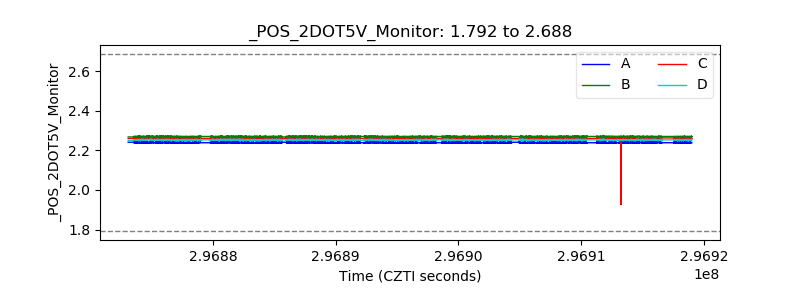 |
| +5 Volts monitor |  |
| _ROLL_ROT | 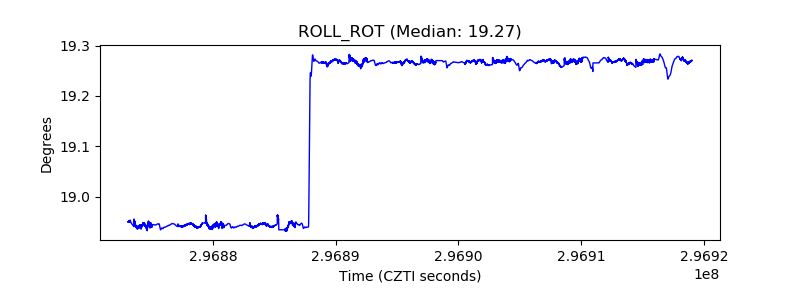 |
| _Roll_DEC | 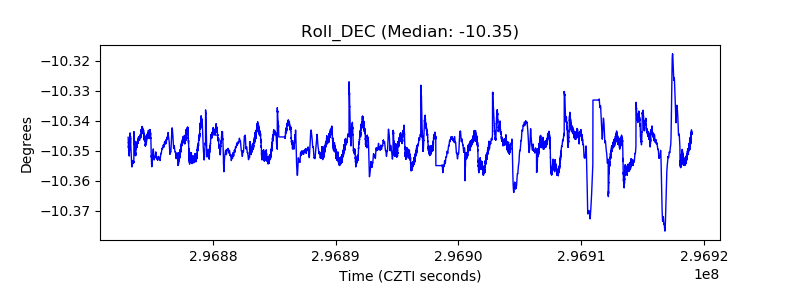 |
| _Roll_RA | 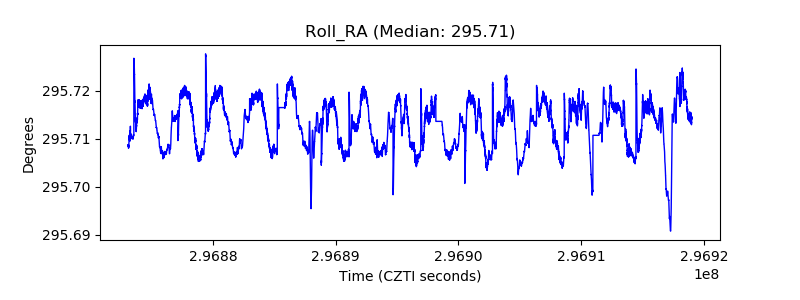 |
| Veto Counter | 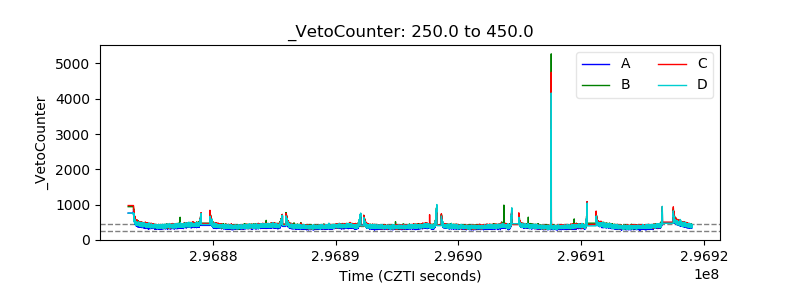 |