| Param | Original file | Final file |
|---|---|---|
| Filename | modeM0/AS1T03_118T01_9000002962_19840cztM0_level2.evt | modeM0/AS1T03_118T01_9000002962_19840cztM0_level2_quad_clean.evt |
| Size (bytes) | 468,221,760 | 71,262,720 |
| Size | 446.5 MB | 68.0 MB |
| Events in quadrant A | 3,578,786 | 435,648 |
| Events in quadrant B | 3,354,037 | 437,350 |
| Events in quadrant C | 3,296,082 | 414,979 |
| Events in quadrant D | 3,503,768 | 410,425 |
| Mode SS | |||
|---|---|---|---|
| Quadrant | BADHDUFLAG | Total packets | Discarded packets |
| A | 0 | 132 | 0 |
| B | 0 | 132 | 0 |
| C | 0 | 132 | 0 |
| D | 0 | 132 | 0 |
| Mode M9 | |||
|---|---|---|---|
| Quadrant | BADHDUFLAG | Total packets | Discarded packets |
| A | 0 | 16 | 0 |
| B | 0 | 17 | 0 |
| C | 0 | 17 | 0 |
| D | 0 | 17 | 0 |
| Mode M0 | |||
|---|---|---|---|
| Quadrant | BADHDUFLAG | Total packets | Discarded packets |
| A | 0 | 14782 | 3 |
| B | 0 | 14133 | 2 |
| C | 0 | 13906 | 2 |
| D | 0 | 14784 | 2 |
| Quadrant | Total seconds | Saturated seconds | Saturation percentage |
|---|---|---|---|
| A | 6593 | 175 | 2.654330% |
| B | 6593 | 77 | 1.167905% |
| C | 6593 | 79 | 1.198241% |
| D | 6593 | 87 | 1.319581% |
Noise dominated data is calculated using 1-second bins in cleaned event files. If a bin has >2000 counts, and if more than 50% of those come from <1% of pixels, then it is considered to be noise-dominated and hence unusable.
| Quadrant | # 1 sec bins | Bins with >0 counts | Bins with >2000 counts | High rate bins dominated by noise | Noise dominated (total time) | Noise dominated (detector-on time) | Marked lightcurve |
|---|---|---|---|---|---|---|---|
| A | 7658 | 6593 | 43 | 43 | 0.56% | 0.65% | 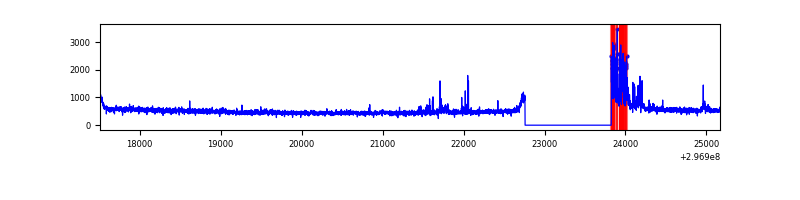 |
| B | 7658 | 6593 | 2 | 2 | 0.03% | 0.03% | 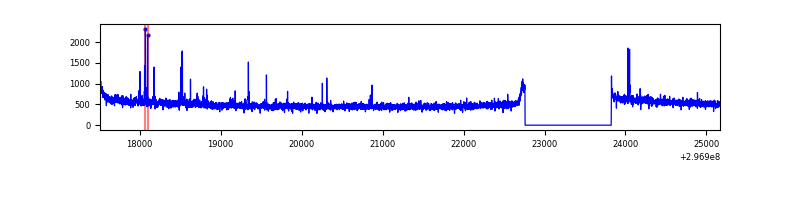 |
| C | 7658 | 6593 | 0 | 0 | 0.00% | 0.00% | 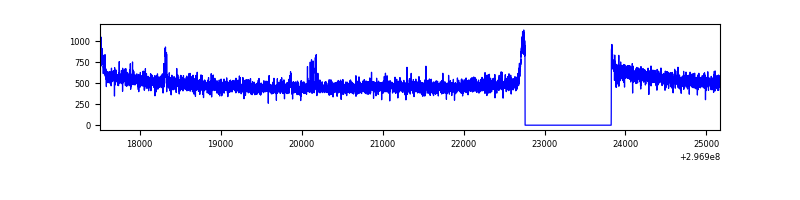 |
| D | 7658 | 6593 | 38 | 38 | 0.50% | 0.58% | 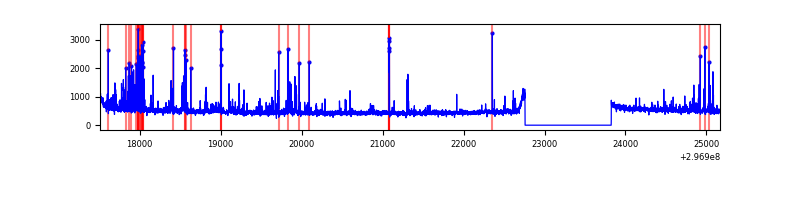 |
Top three noisy pixels from each quadrant. If the there are fewer than three noisy pixels in the level2.evt file, extra rows are filled as -1
| Pixel properties | Quadrant properties | ||||||
|---|---|---|---|---|---|---|---|
| Quadrant | DetID | PixID | Counts | Sigma | Mean | Median | Sigma |
| A | 14 | 238 | 331332 | 1961.96 | 838 | 821 | 168.5 |
| A | 10 | 253 | 11978 | 66.23 | 838 | 821 | 168.5 |
| A | 0 | 23 | 11517 | 63.49 | 838 | 821 | 168.5 |
| B | 7 | 220 | 29924 | 180.89 | 838 | 818 | 160.9 |
| B | 0 | 190 | 23910 | 143.51 | 838 | 818 | 160.9 |
| B | 12 | 111 | 19021 | 113.13 | 838 | 818 | 160.9 |
| C | 14 | 238 | 125773 | 661.22 | 805 | 811 | 189.0 |
| C | 9 | 221 | 17965 | 90.77 | 805 | 811 | 189.0 |
| C | 7 | 220 | 7592 | 35.88 | 805 | 811 | 189.0 |
| D | 1 | 52 | 249678 | 1257.72 | 817 | 795 | 197.9 |
| D | 12 | 17 | 106512 | 534.24 | 817 | 795 | 197.9 |
| D | 2 | 234 | 31041 | 152.85 | 817 | 795 | 197.9 |
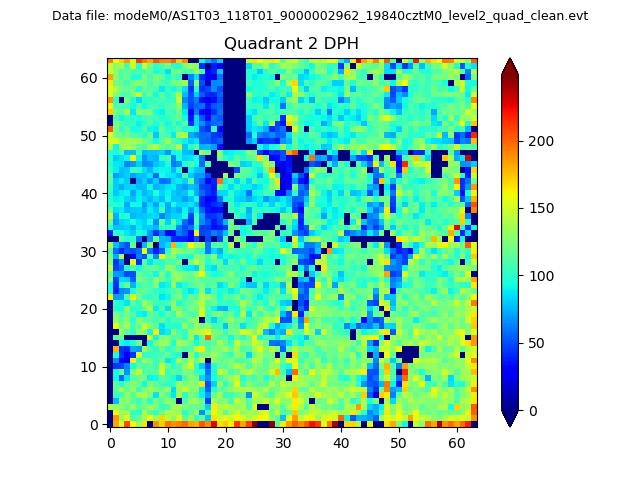
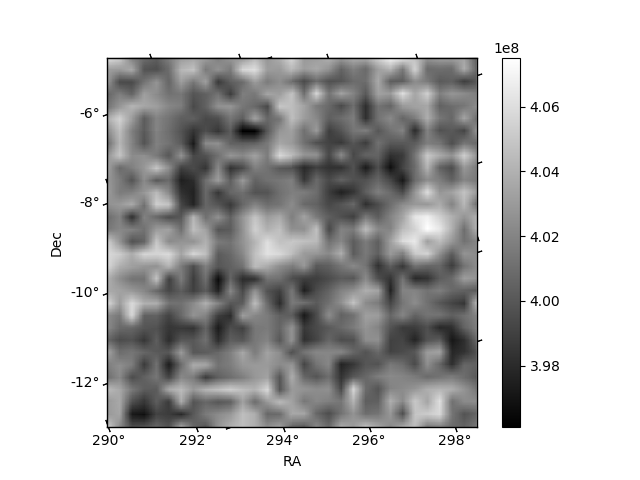
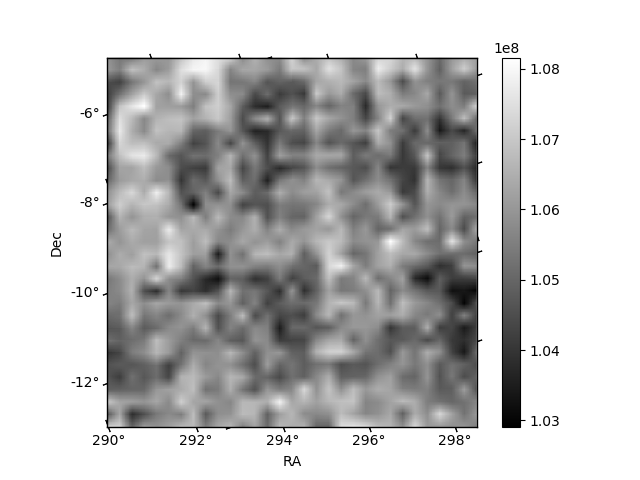
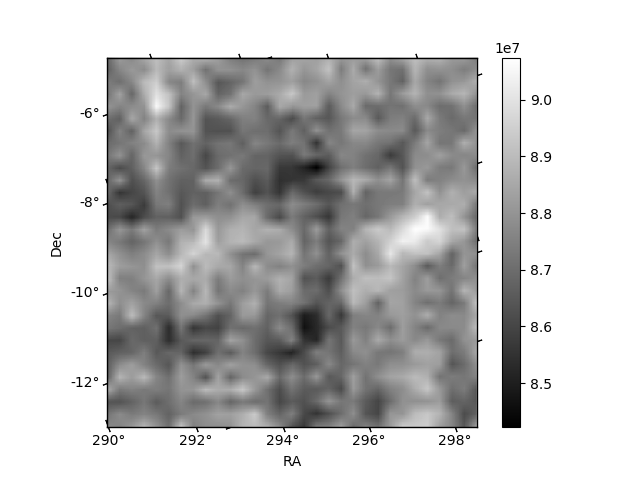
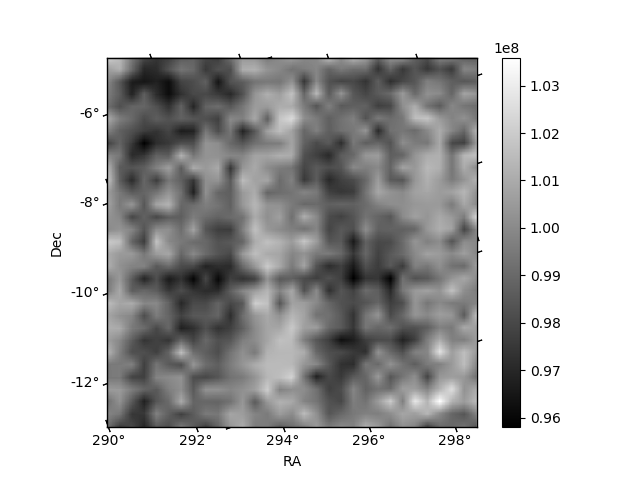
Histogram calculated using DETX and DETY for each event in the final _common_clean file
| Quadrant A | 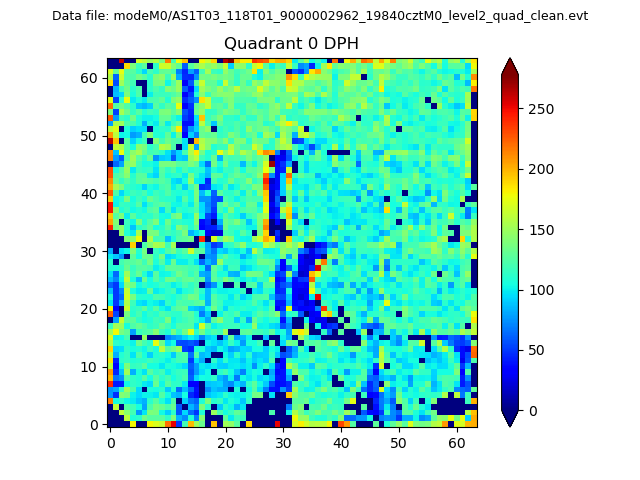 |
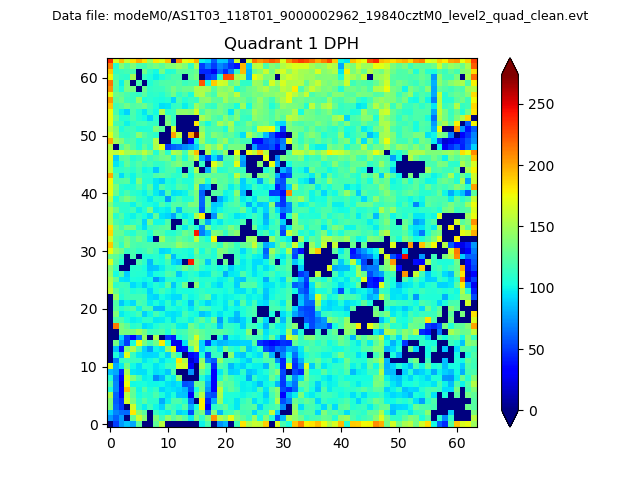 |
Quadrant B |
|---|---|---|---|
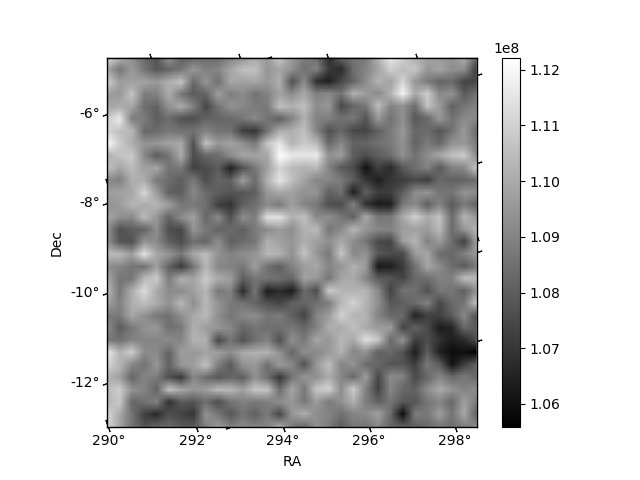
| Quadrant D | 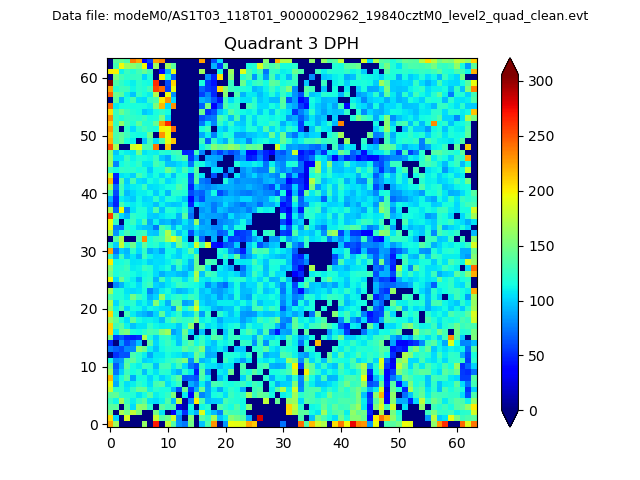 |
 |
Quadrant C |
| Plot type | Count rate plots | Images |
|---|---|---|
| Comparison with Poisson distribution Blue bars denote a histogram of data divided into 1 sec bins. Red curve is a Poisson curve with rate = median count rate of data. |
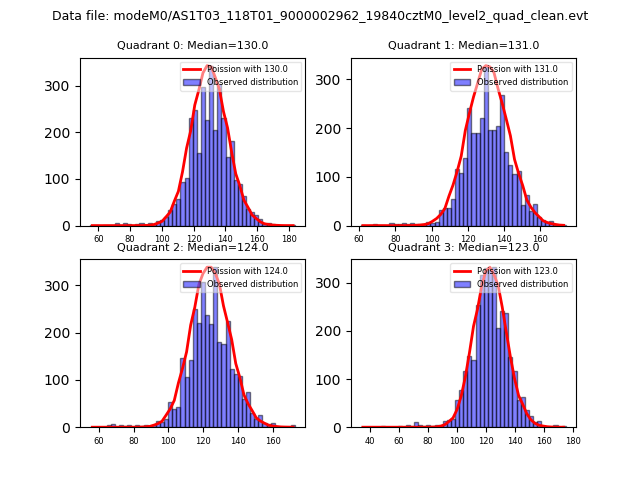 |
 |
| Quadrant-wise count rates Data is divided into 100 sec bins |
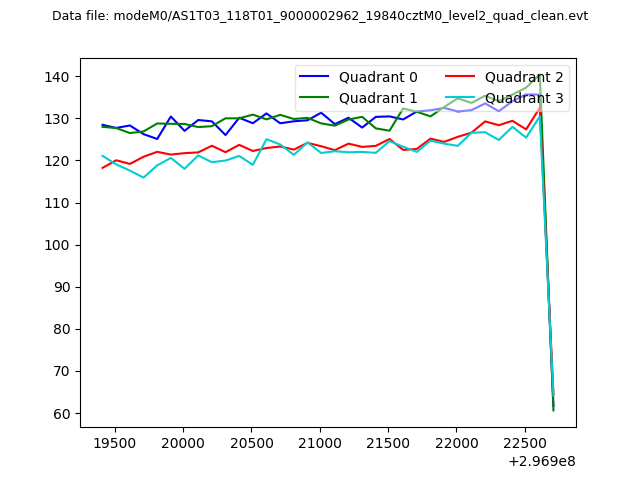 |
|
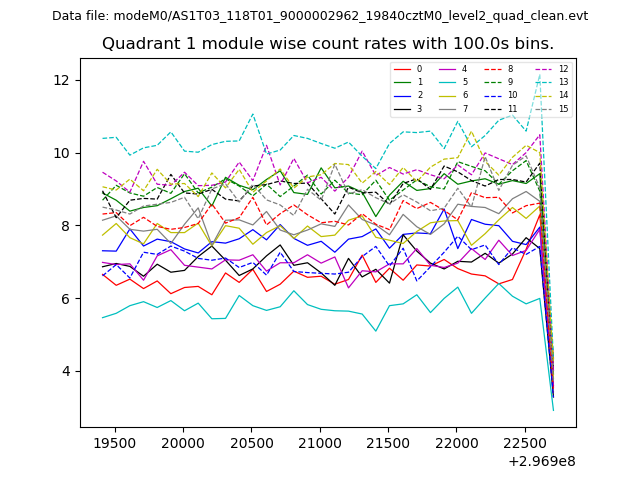
| Module-wise count rates for Quadrant A Data is divided into 100 sec bins |
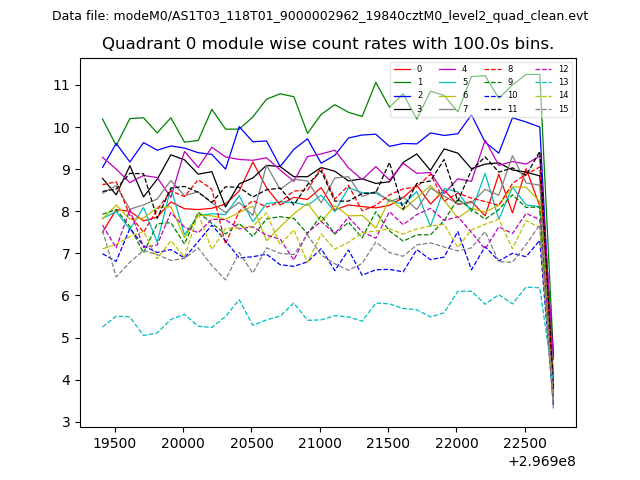 |
 |
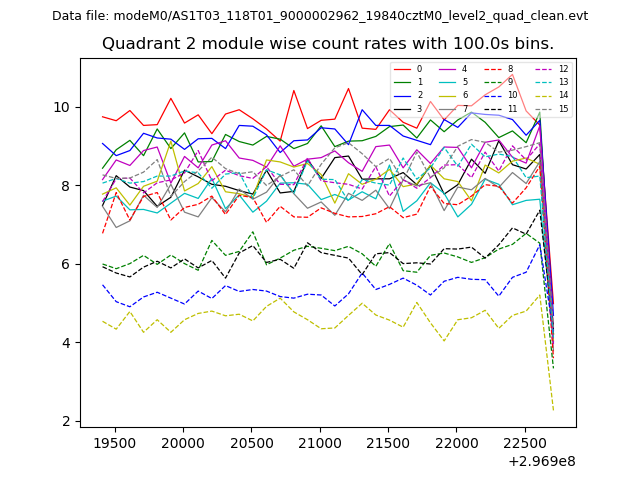
| Module-wise count rates for Quadrant B Data is divided into 100 sec bins |
 |
 |
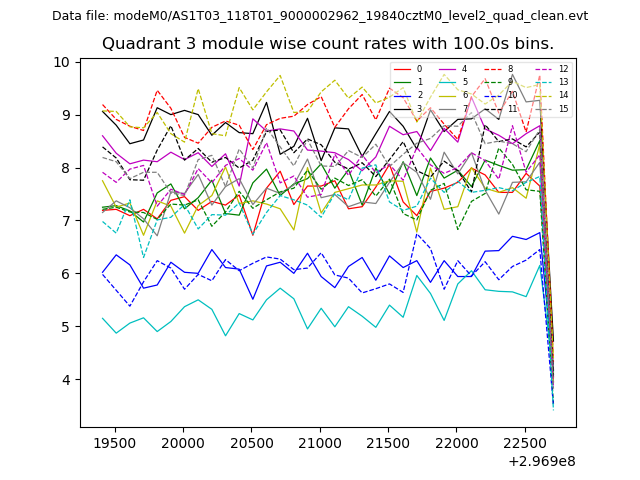
| Module-wise count rates for Quadrant C Data is divided into 100 sec bins |
 |
 |
| Module-wise count rates for Quadrant D Data is divided into 100 sec bins |
 |
 |
| Parameter | Plot |
|---|---|
| CZT HV Monitor | 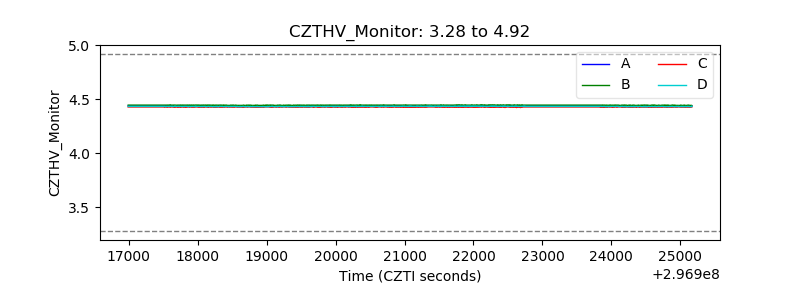 |
| D_VDD | 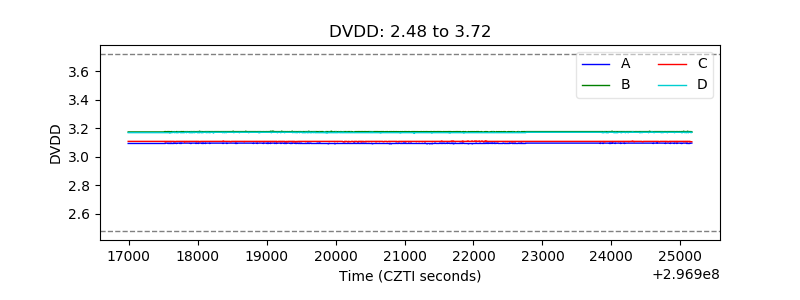 |
| Temperature 1 | 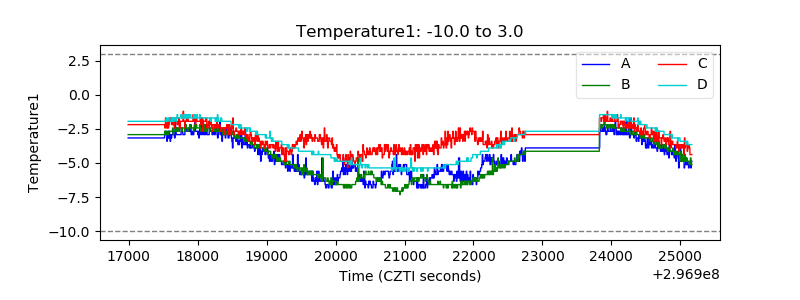 |
| Veto HV Monitor | 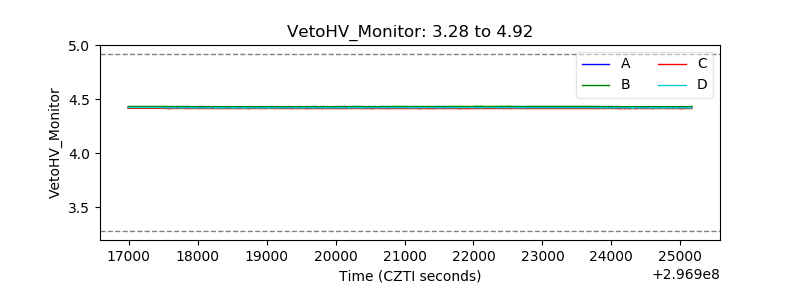 |
| Veto LLD | 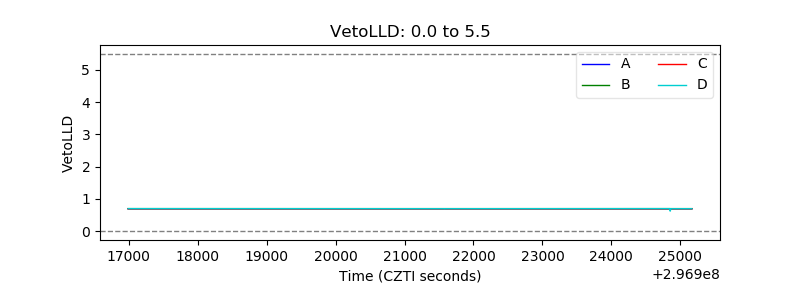 |
| Alpha Counter | 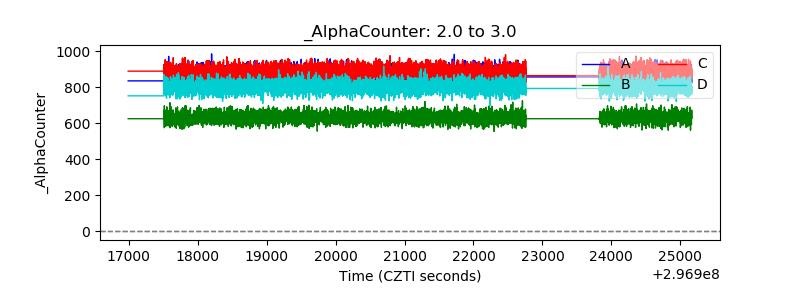 |
| _CPM_Rate | 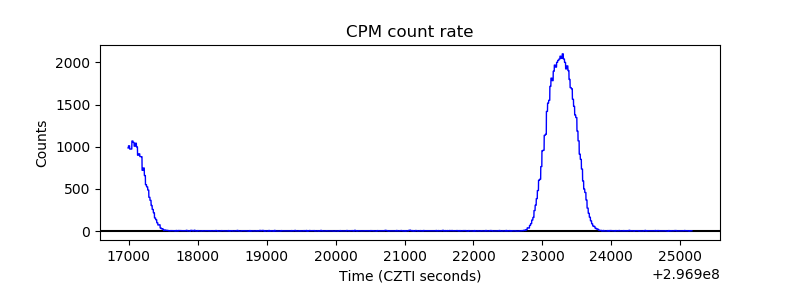 |
| CZT Counter | 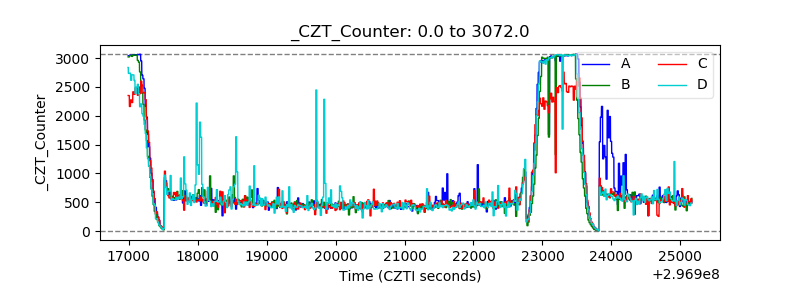 |
| +2.5 Volts monitor | 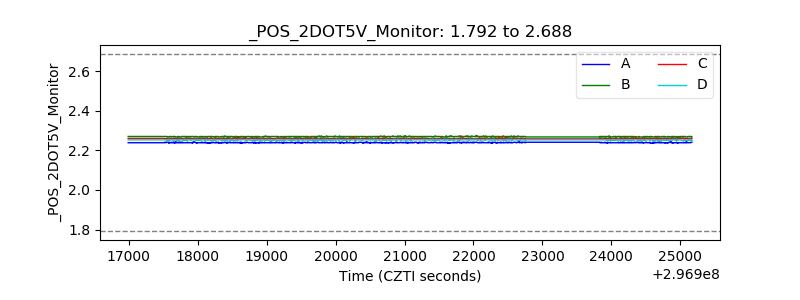 |
| +5 Volts monitor |  |
| _ROLL_ROT | 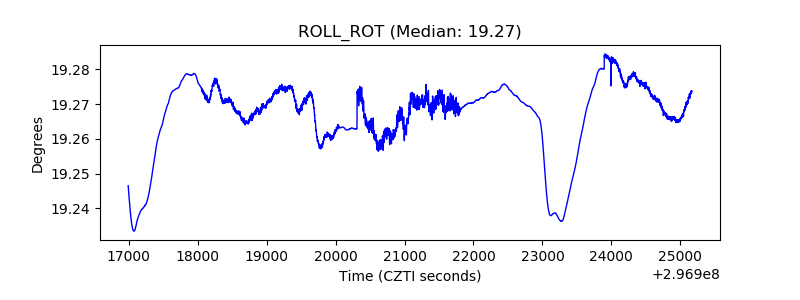 |
| _Roll_DEC | 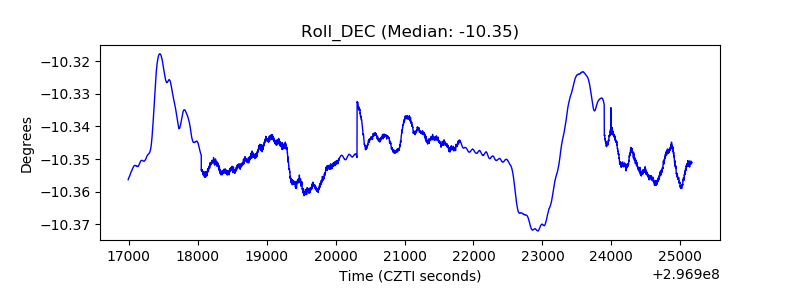 |
| _Roll_RA | 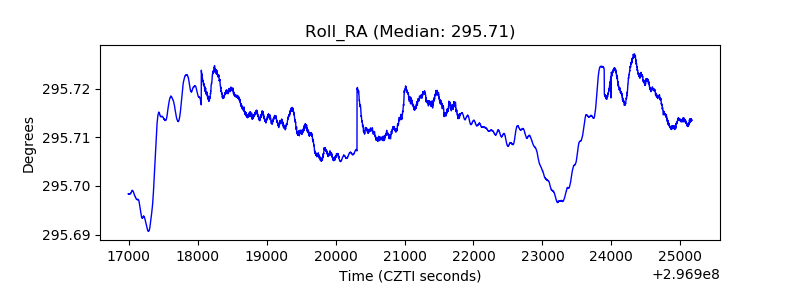 |
| Veto Counter | 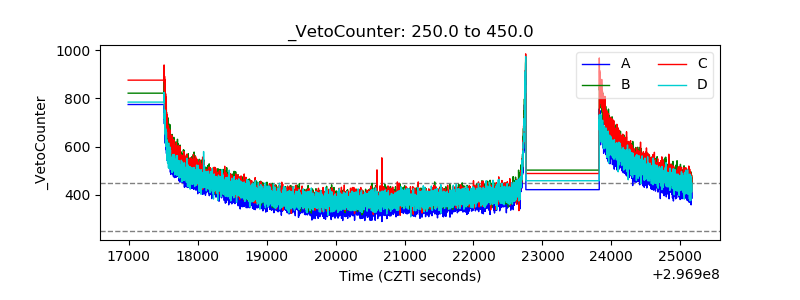 |