| Param | Original file | Final file |
|---|---|---|
| Filename | modeM0/AS1T03_118T01_9000002962_19845cztM0_level2.evt | modeM0/AS1T03_118T01_9000002962_19845cztM0_level2_quad_clean.evt |
| Size (bytes) | 599,451,840 | 106,182,720 |
| Size | 571.7 MB | 101.3 MB |
| Events in quadrant A | 6,926,897 | 658,113 |
| Events in quadrant B | 3,270,055 | 747,671 |
| Events in quadrant C | 3,265,182 | 713,399 |
| Events in quadrant D | 4,276,751 | 667,853 |
| Mode SS | |||
|---|---|---|---|
| Quadrant | BADHDUFLAG | Total packets | Discarded packets |
| A | 0 | 124 | 0 |
| B | 0 | 124 | 0 |
| C | 0 | 124 | 0 |
| D | 0 | 124 | 0 |
| Mode M9 | |||
|---|---|---|---|
| Quadrant | BADHDUFLAG | Total packets | Discarded packets |
| A | 0 | 28 | 0 |
| B | 0 | 28 | 0 |
| C | 0 | 28 | 0 |
| D | 0 | 28 | 0 |
| Mode M0 | |||
|---|---|---|---|
| Quadrant | BADHDUFLAG | Total packets | Discarded packets |
| A | 0 | 24828 | 2 |
| B | 0 | 13524 | 2 |
| C | 0 | 13429 | 2 |
| D | 0 | 16689 | 2 |
| Quadrant | Total seconds | Saturated seconds | Saturation percentage |
|---|---|---|---|
| A | 6146 | 1289 | 20.972991% |
| B | 6146 | 90 | 1.464367% |
| C | 6146 | 74 | 1.204035% |
| D | 6146 | 438 | 7.126586% |
Noise dominated data is calculated using 1-second bins in cleaned event files. If a bin has >2000 counts, and if more than 50% of those come from <1% of pixels, then it is considered to be noise-dominated and hence unusable.
| Quadrant | # 1 sec bins | Bins with >0 counts | Bins with >2000 counts | High rate bins dominated by noise | Noise dominated (total time) | Noise dominated (detector-on time) | Marked lightcurve |
|---|---|---|---|---|---|---|---|
| A | 8861 | 6148 | 985 | 985 | 11.12% | 16.02% | 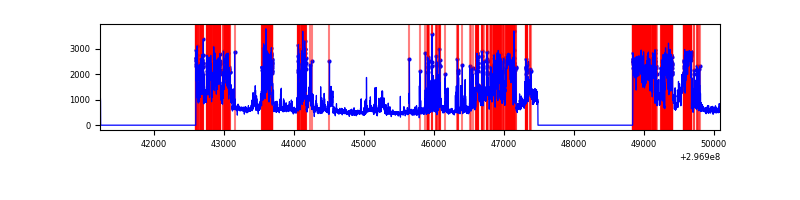 |
| B | 8861 | 6148 | 6 | 6 | 0.07% | 0.10% | 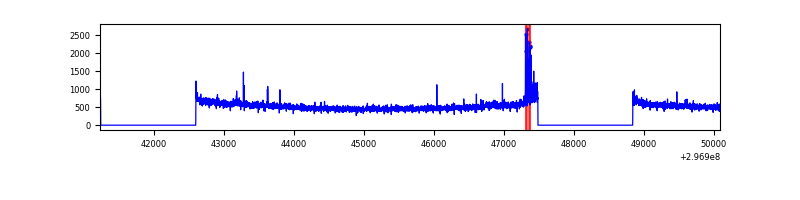 |
| C | 8861 | 6148 | 0 | 0 | 0.00% | 0.00% | 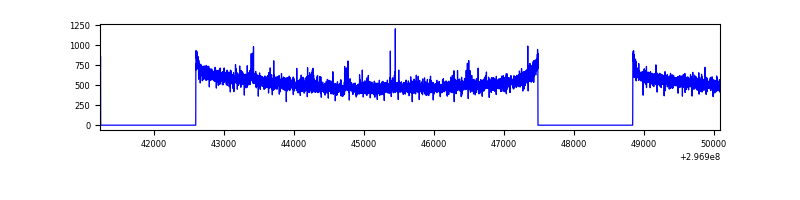 |
| D | 8861 | 6148 | 317 | 317 | 3.58% | 5.16% | 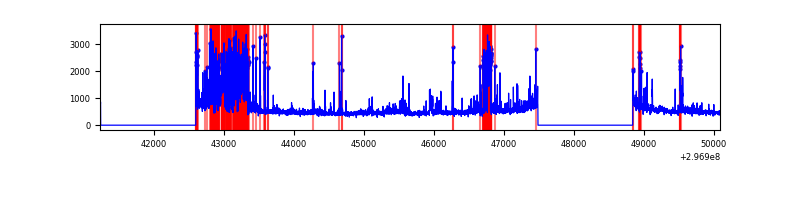 |
Top three noisy pixels from each quadrant. If the there are fewer than three noisy pixels in the level2.evt file, extra rows are filled as -1
| Pixel properties | Quadrant properties | ||||||
|---|---|---|---|---|---|---|---|
| Quadrant | DetID | PixID | Counts | Sigma | Mean | Median | Sigma |
| A | 14 | 238 | 3771463 | 25350.61 | 740 | 728 | 148.7 |
| A | 5 | 16 | 268000 | 1796.87 | 740 | 728 | 148.7 |
| A | 14 | 254 | 43355 | 286.58 | 740 | 728 | 148.7 |
| B | 7 | 220 | 52913 | 341.29 | 814 | 795 | 152.7 |
| B | 12 | 111 | 17998 | 112.65 | 814 | 795 | 152.7 |
| B | 11 | 111 | 15674 | 97.43 | 814 | 795 | 152.7 |
| C | 14 | 238 | 125727 | 677.07 | 795 | 802 | 184.5 |
| C | 9 | 221 | 33539 | 177.43 | 795 | 802 | 184.5 |
| C | 13 | 61 | 5432 | 25.09 | 795 | 802 | 184.5 |
| D | 12 | 218 | 717892 | 3799.12 | 777 | 758 | 188.8 |
| D | 1 | 52 | 437909 | 2315.87 | 777 | 758 | 188.8 |
| D | 12 | 17 | 101182 | 532.01 | 777 | 758 | 188.8 |
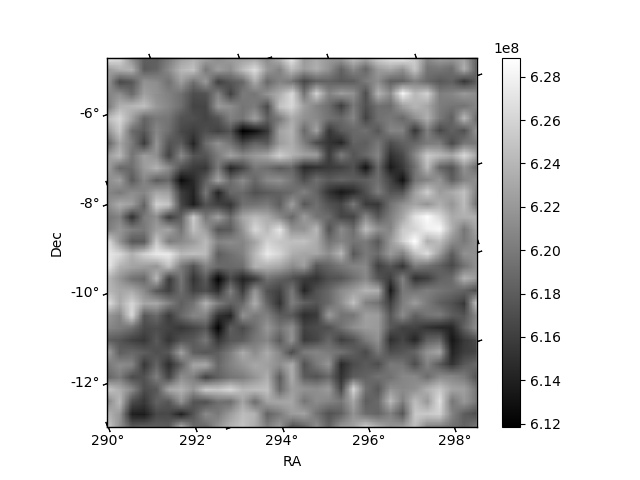
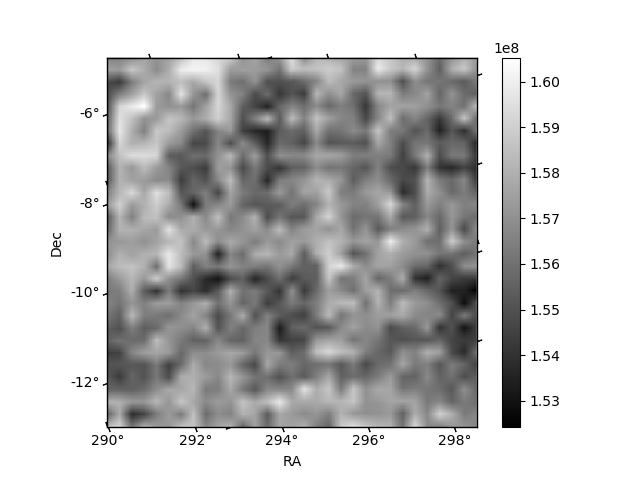
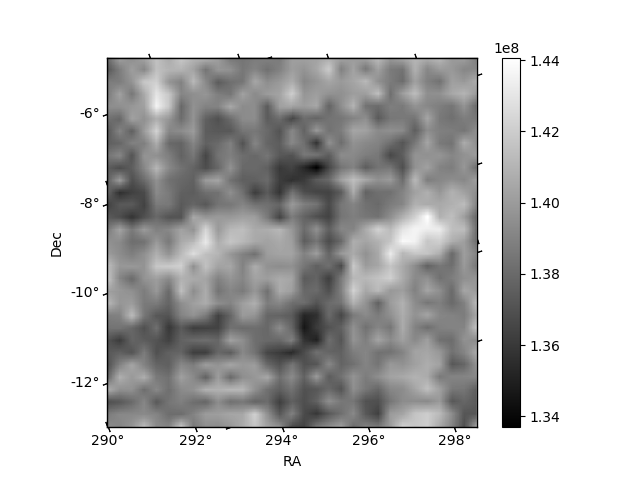
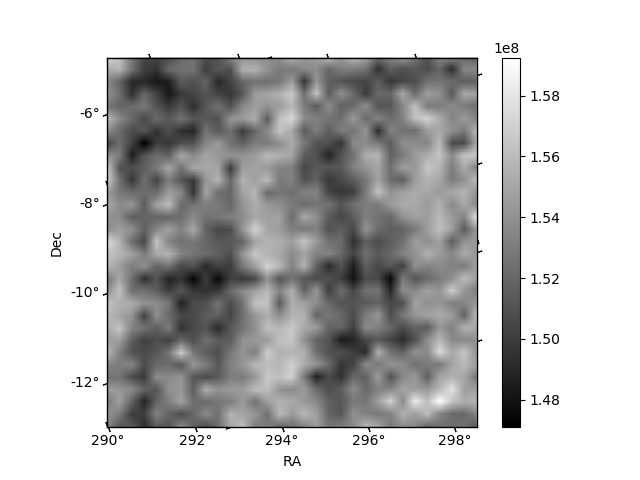
Histogram calculated using DETX and DETY for each event in the final _common_clean file
| Quadrant A | 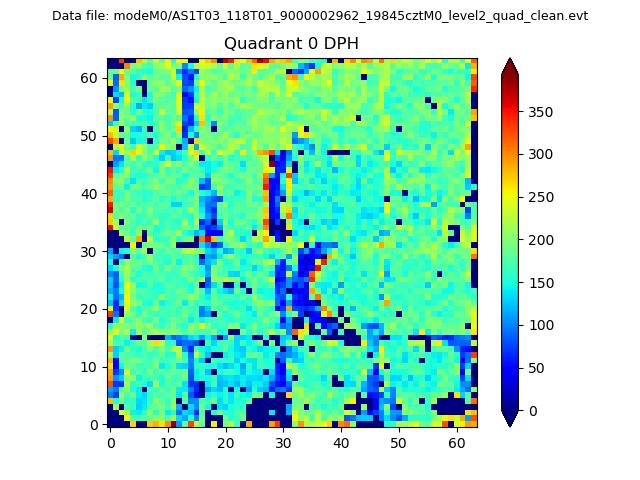 |
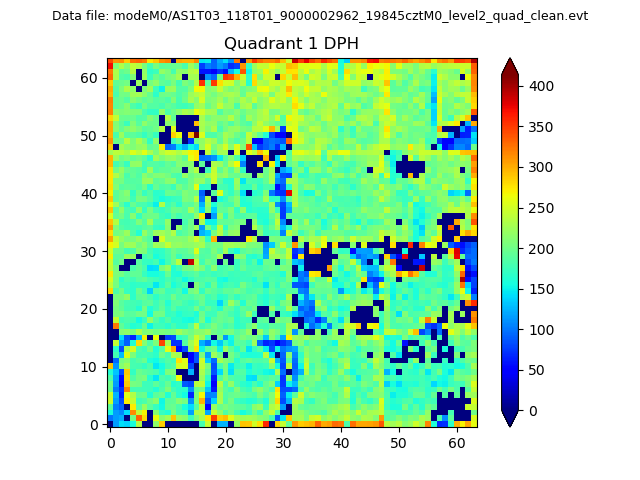 |
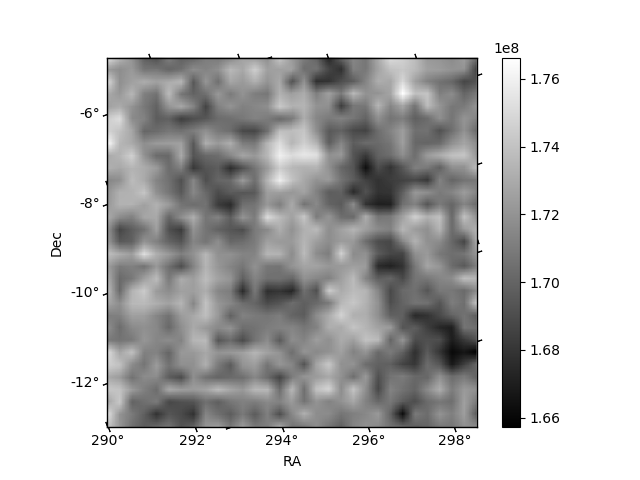
Quadrant B |
|---|---|---|---|
| Quadrant D | 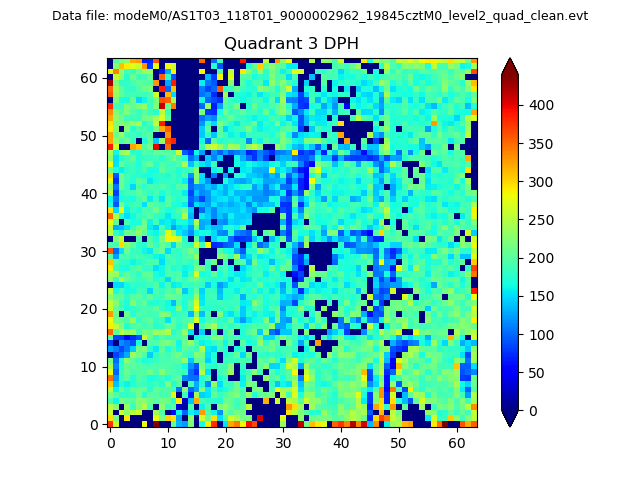 |
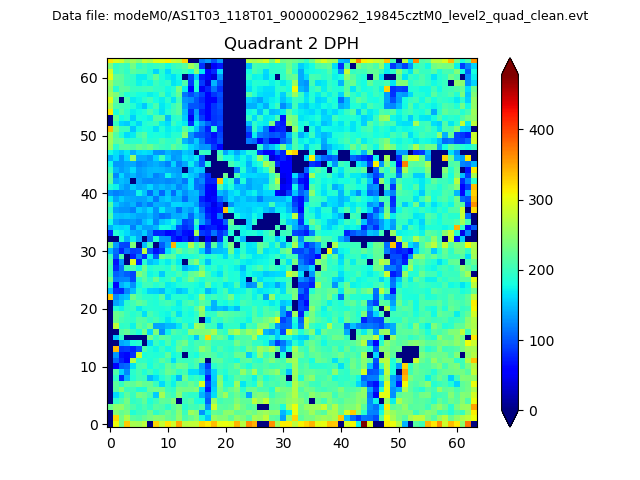 |
Quadrant C |
| Plot type | Count rate plots | Images |
|---|---|---|
| Comparison with Poisson distribution Blue bars denote a histogram of data divided into 1 sec bins. Red curve is a Poisson curve with rate = median count rate of data. |
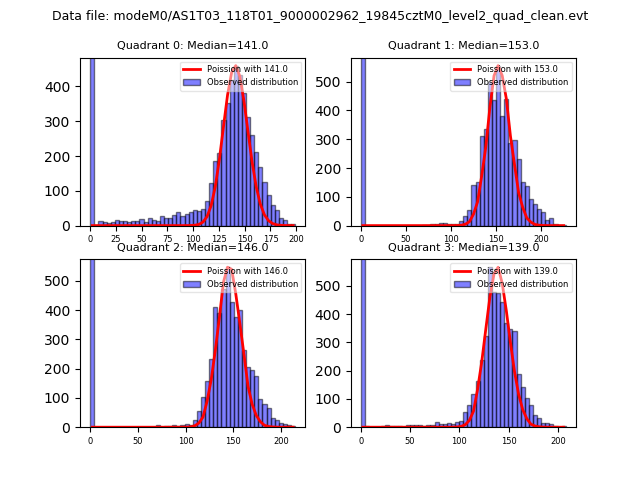 |
 |
| Quadrant-wise count rates Data is divided into 100 sec bins |
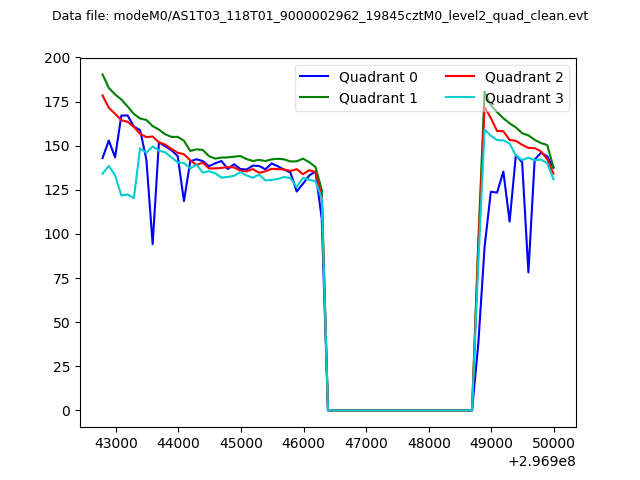 |
|
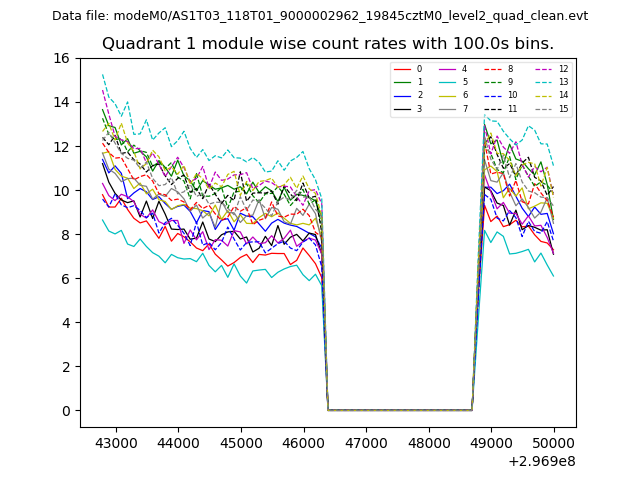
| Module-wise count rates for Quadrant A Data is divided into 100 sec bins |
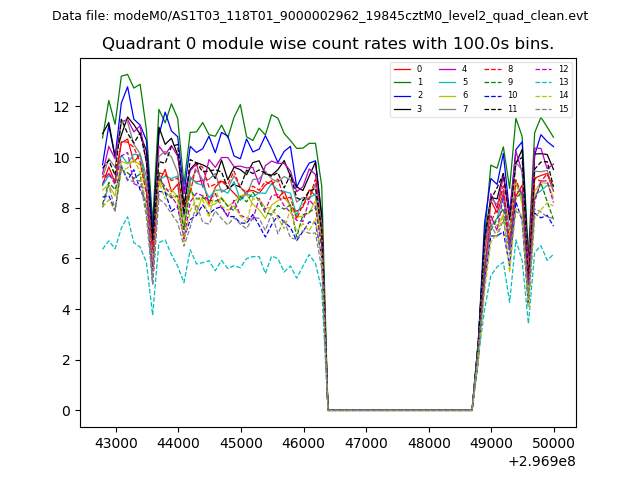 |
 |
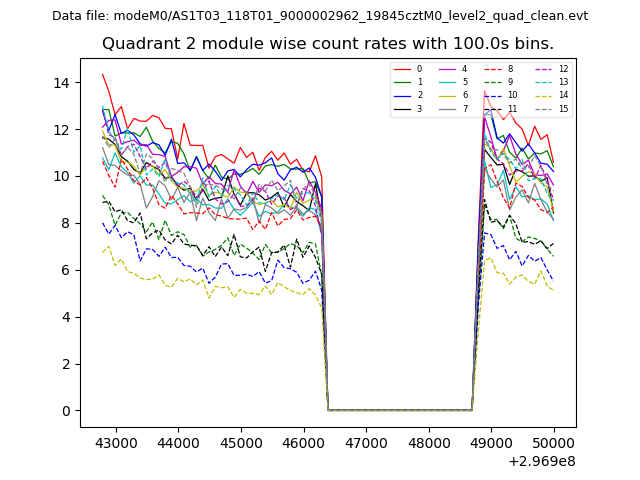
| Module-wise count rates for Quadrant B Data is divided into 100 sec bins |
 |
 |
| Module-wise count rates for Quadrant C Data is divided into 100 sec bins |
 |
 |
| Module-wise count rates for Quadrant D Data is divided into 100 sec bins |
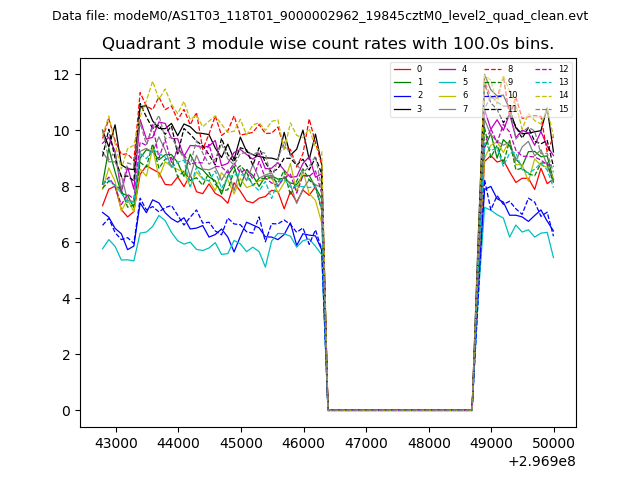 |
 |
| Parameter | Plot |
|---|---|
| CZT HV Monitor | 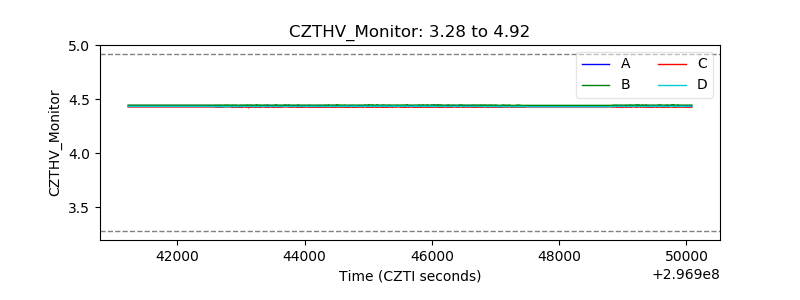 |
| D_VDD | 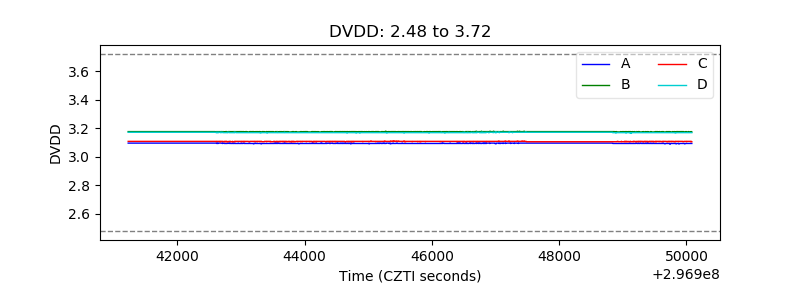 |
| Temperature 1 | 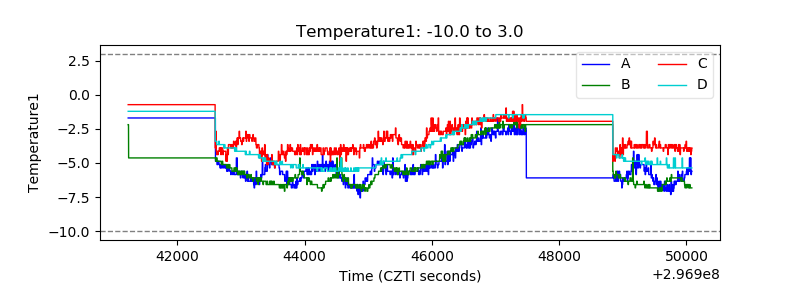 |
| Veto HV Monitor | 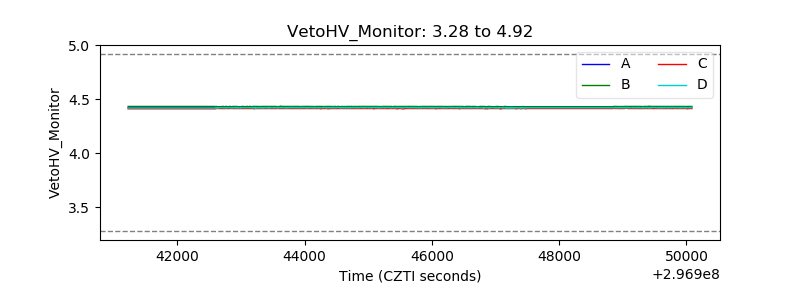 |
| Veto LLD | 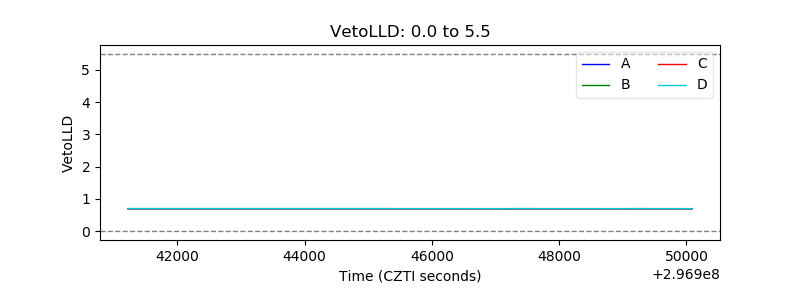 |
| Alpha Counter | 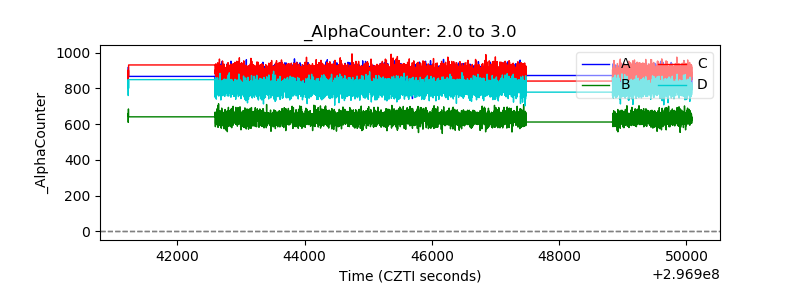 |
| _CPM_Rate | 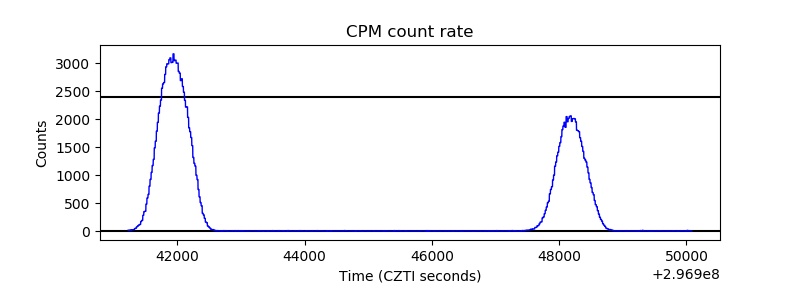 |
| CZT Counter | 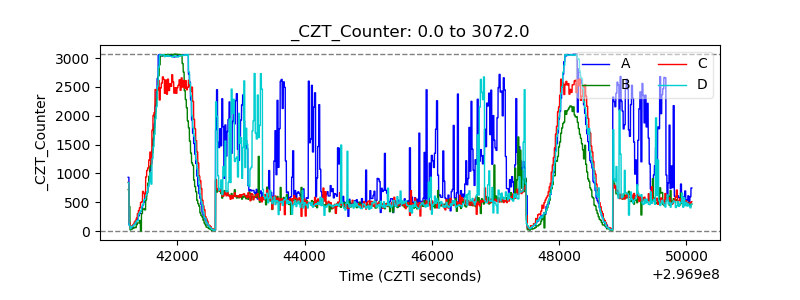 |
| +2.5 Volts monitor |  |
| +5 Volts monitor |  |
| _ROLL_ROT | 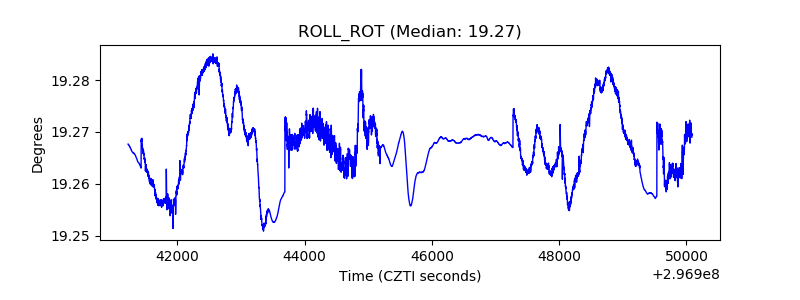 |
| _Roll_DEC | 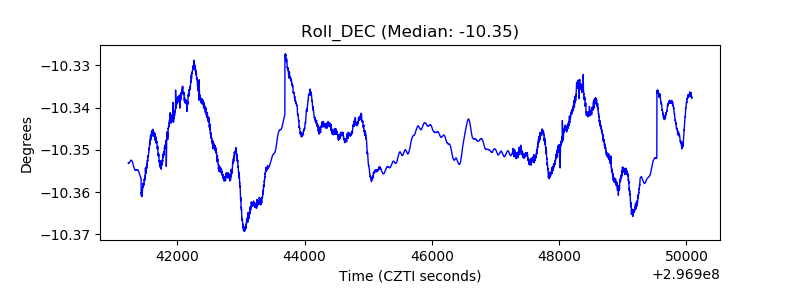 |
| _Roll_RA | 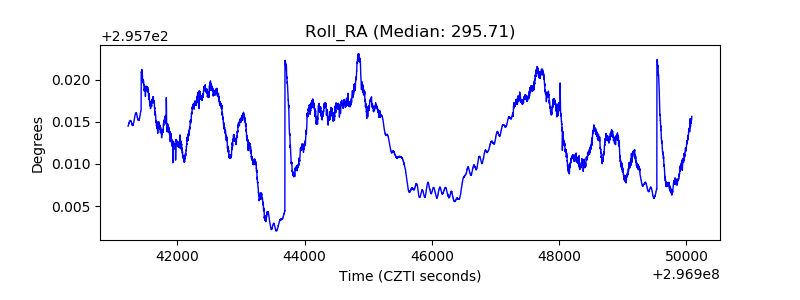 |
| Veto Counter | 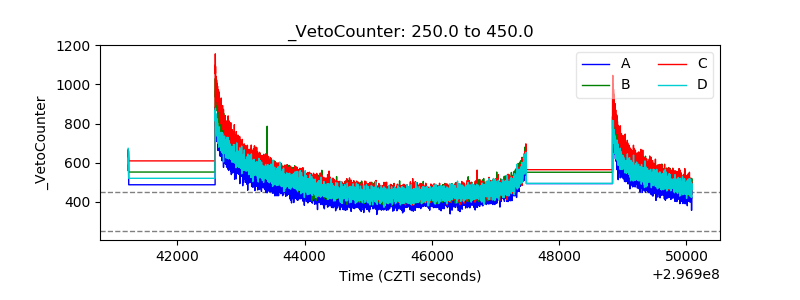 |