| Param | Original file | Final file |
|---|---|---|
| Filename | modeM0/AS1T03_118T01_9000002962_19847cztM0_level2.evt | modeM0/AS1T03_118T01_9000002962_19847cztM0_level2_quad_clean.evt |
| Size (bytes) | 695,203,200 | 92,070,720 |
| Size | 663.0 MB | 87.8 MB |
| Events in quadrant A | 10,476,018 | 530,075 |
| Events in quadrant B | 3,351,482 | 618,677 |
| Events in quadrant C | 3,386,998 | 590,902 |
| Events in quadrant D | 3,382,185 | 576,875 |
| Mode SS | |||
|---|---|---|---|
| Quadrant | BADHDUFLAG | Total packets | Discarded packets |
| A | 0 | 138 | 0 |
| B | 0 | 138 | 0 |
| C | 0 | 138 | 0 |
| D | 0 | 138 | 0 |
| Mode M9 | |||
|---|---|---|---|
| Quadrant | BADHDUFLAG | Total packets | Discarded packets |
| A | 0 | 15 | 0 |
| B | 0 | 16 | 0 |
| C | 0 | 16 | 0 |
| D | 0 | 16 | 0 |
| Mode M0 | |||
|---|---|---|---|
| Quadrant | BADHDUFLAG | Total packets | Discarded packets |
| A | 0 | 35878 | 2 |
| B | 0 | 14222 | 2 |
| C | 0 | 14206 | 2 |
| D | 0 | 14636 | 2 |
| Quadrant | Total seconds | Saturated seconds | Saturation percentage |
|---|---|---|---|
| A | 6757 | 2639 | 39.055794% |
| B | 6757 | 77 | 1.139559% |
| C | 6757 | 93 | 1.376350% |
| D | 6757 | 47 | 0.695575% |
Noise dominated data is calculated using 1-second bins in cleaned event files. If a bin has >2000 counts, and if more than 50% of those come from <1% of pixels, then it is considered to be noise-dominated and hence unusable.
| Quadrant | # 1 sec bins | Bins with >0 counts | Bins with >2000 counts | High rate bins dominated by noise | Noise dominated (total time) | Noise dominated (detector-on time) | Marked lightcurve |
|---|---|---|---|---|---|---|---|
| A | 7637 | 6758 | 2160 | 2160 | 28.28% | 31.96% | 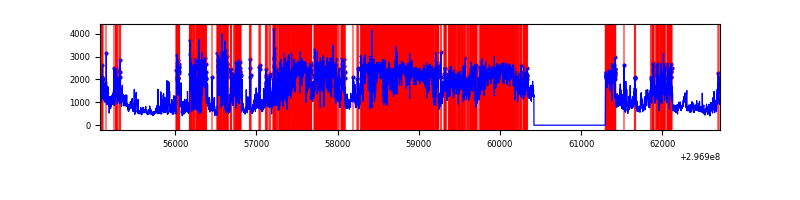 |
| B | 7637 | 6758 | 0 | 0 | 0.00% | 0.00% | 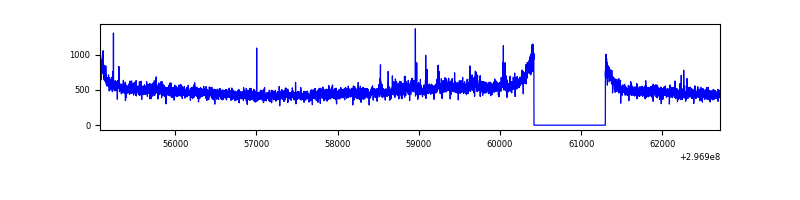 |
| C | 7637 | 6758 | 0 | 0 | 0.00% | 0.00% |  |
| D | 7637 | 6758 | 11 | 11 | 0.14% | 0.16% | 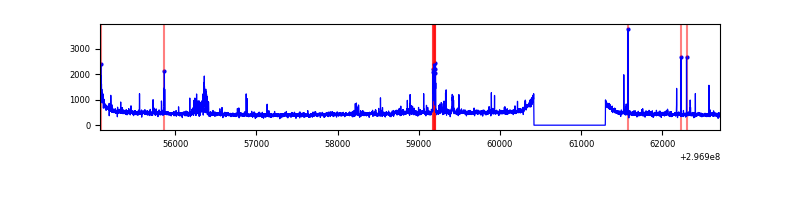 |
Top three noisy pixels from each quadrant. If the there are fewer than three noisy pixels in the level2.evt file, extra rows are filled as -1
| Pixel properties | Quadrant properties | ||||||
|---|---|---|---|---|---|---|---|
| Quadrant | DetID | PixID | Counts | Sigma | Mean | Median | Sigma |
| A | 14 | 238 | 7496020 | 53635.04 | 691 | 677 | 139.7 |
| A | 14 | 254 | 315029 | 2249.43 | 691 | 677 | 139.7 |
| A | 5 | 16 | 8972 | 59.36 | 691 | 677 | 139.7 |
| B | 0 | 214 | 20061 | 119.14 | 842 | 820 | 161.5 |
| B | 12 | 111 | 19463 | 115.44 | 842 | 820 | 161.5 |
| B | 11 | 111 | 17404 | 102.69 | 842 | 820 | 161.5 |
| C | 14 | 238 | 125493 | 647.28 | 817 | 823 | 192.6 |
| C | 9 | 221 | 67771 | 347.59 | 817 | 823 | 192.6 |
| C | 3 | 233 | 7782 | 36.13 | 817 | 823 | 192.6 |
| D | 1 | 52 | 229682 | 1132.08 | 825 | 803 | 202.2 |
| D | 7 | 96 | 38291 | 185.42 | 825 | 803 | 202.2 |
| D | 2 | 234 | 25762 | 123.45 | 825 | 803 | 202.2 |
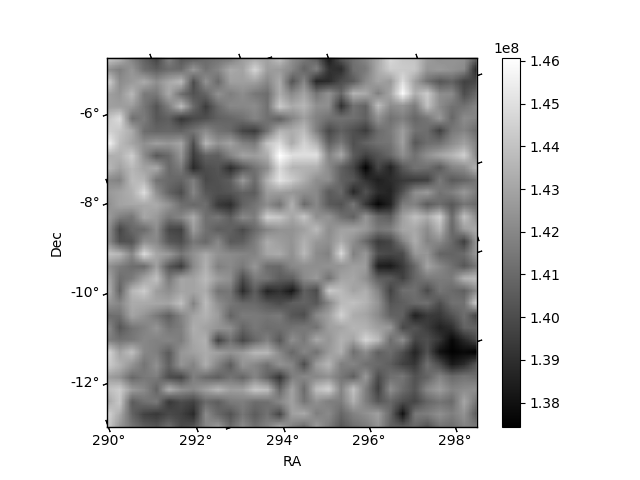
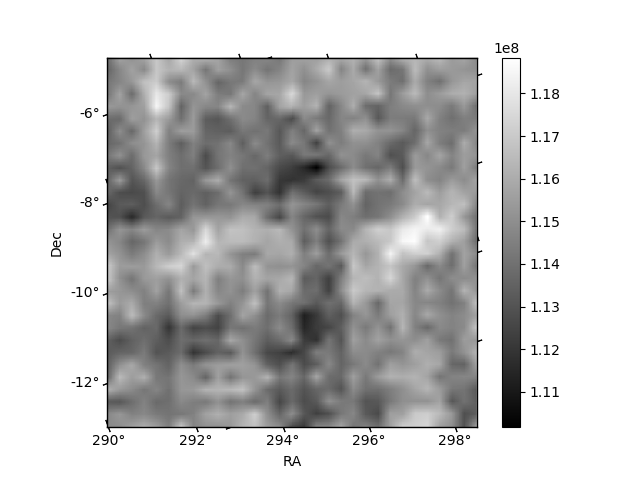
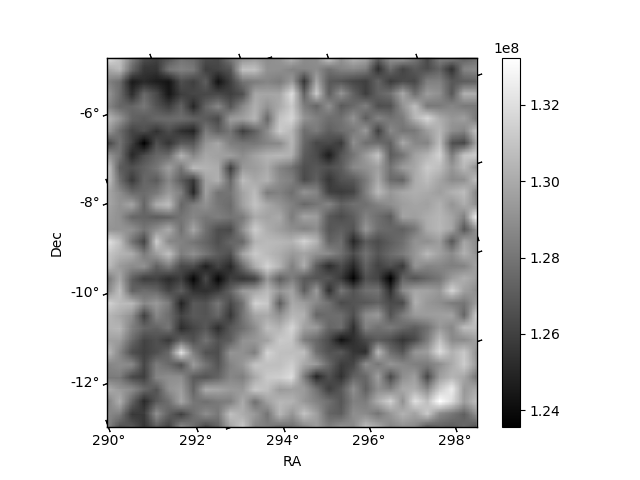
Histogram calculated using DETX and DETY for each event in the final _common_clean file
| Quadrant A |  |
 |
Quadrant B |
|---|---|---|---|
| Quadrant D | 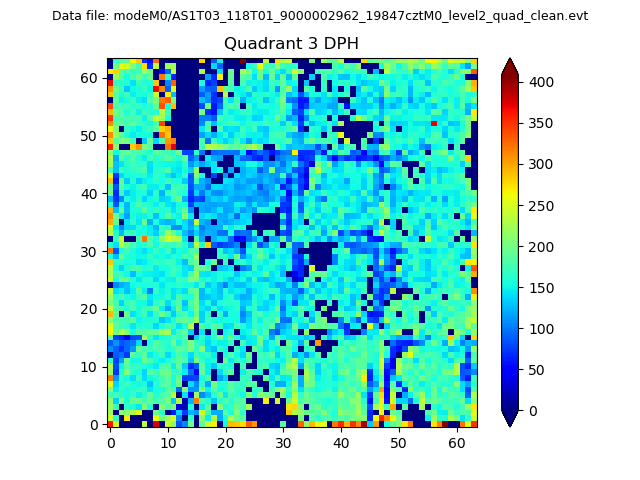 |
 |
Quadrant C |
| Plot type | Count rate plots | Images |
|---|---|---|
| Comparison with Poisson distribution Blue bars denote a histogram of data divided into 1 sec bins. Red curve is a Poisson curve with rate = median count rate of data. |
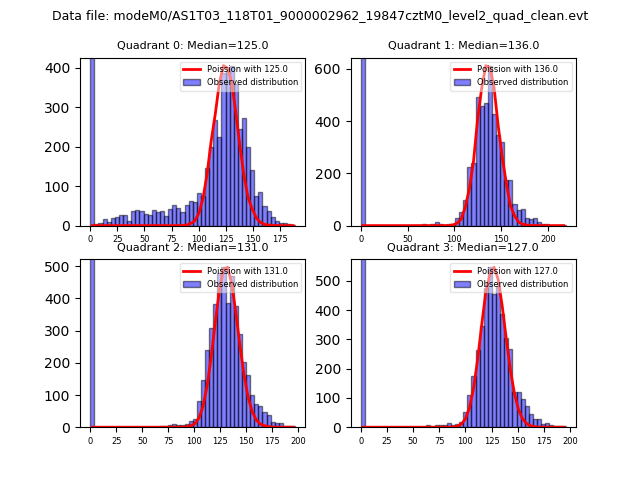 |
 |
| Quadrant-wise count rates Data is divided into 100 sec bins |
 |
|
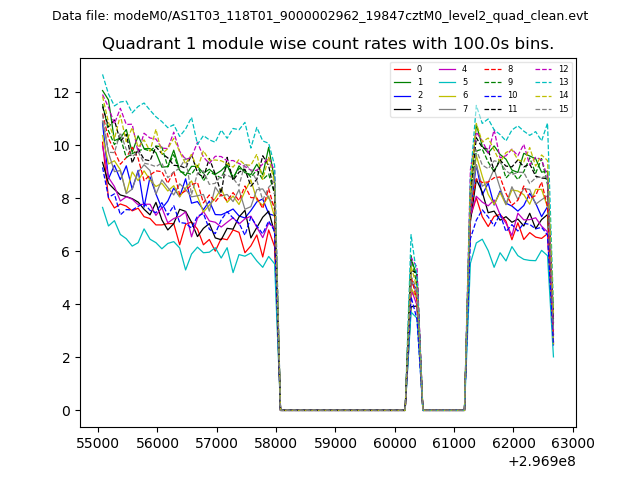
| Module-wise count rates for Quadrant A Data is divided into 100 sec bins |
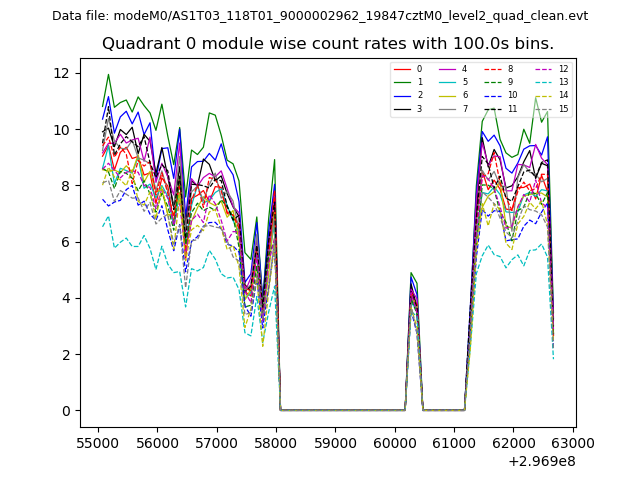 |
 |
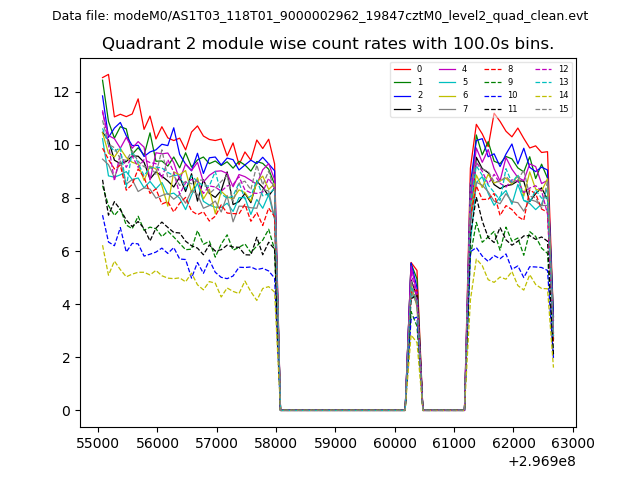
| Module-wise count rates for Quadrant B Data is divided into 100 sec bins |
 |
 |
| Module-wise count rates for Quadrant C Data is divided into 100 sec bins |
 |
 |
| Module-wise count rates for Quadrant D Data is divided into 100 sec bins |
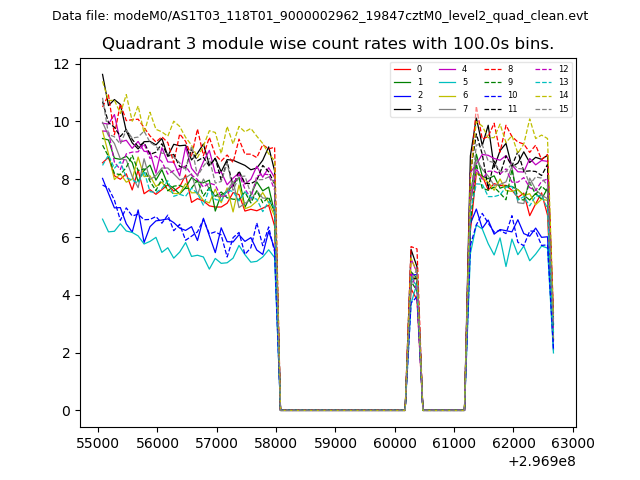 |
 |
| Parameter | Plot |
|---|---|
| CZT HV Monitor |  |
| D_VDD | 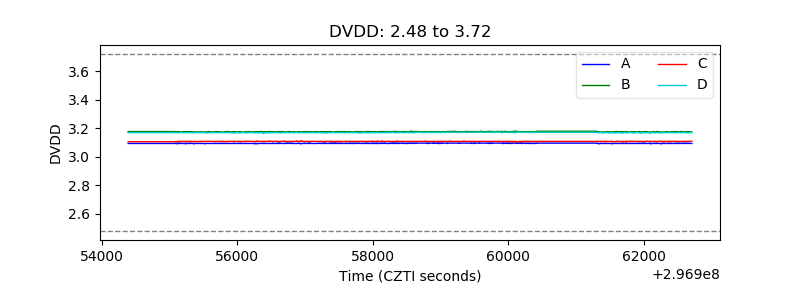 |
| Temperature 1 | 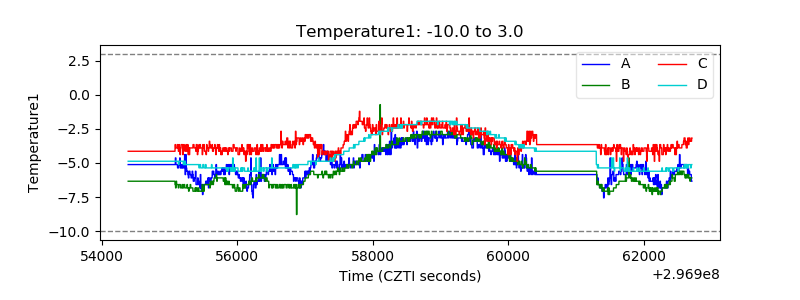 |
| Veto HV Monitor | 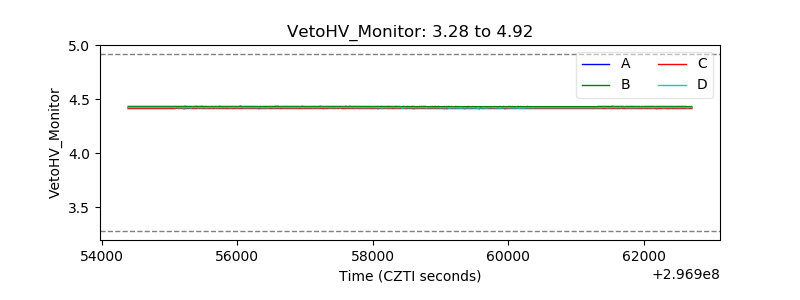 |
| Veto LLD | 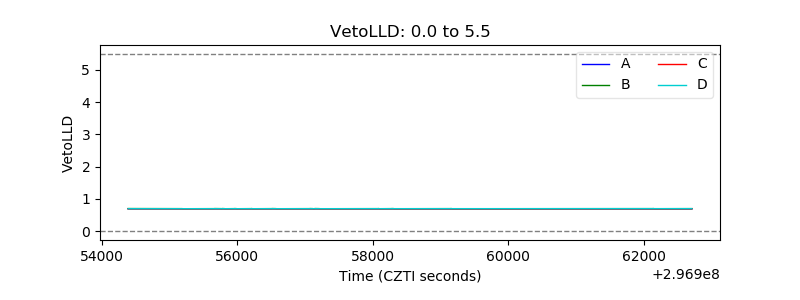 |
| Alpha Counter | 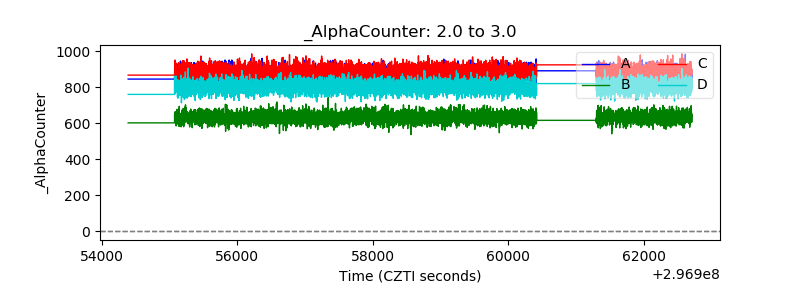 |
| _CPM_Rate | 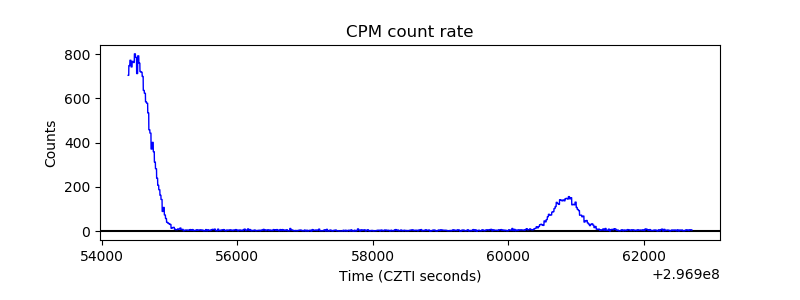 |
| CZT Counter | 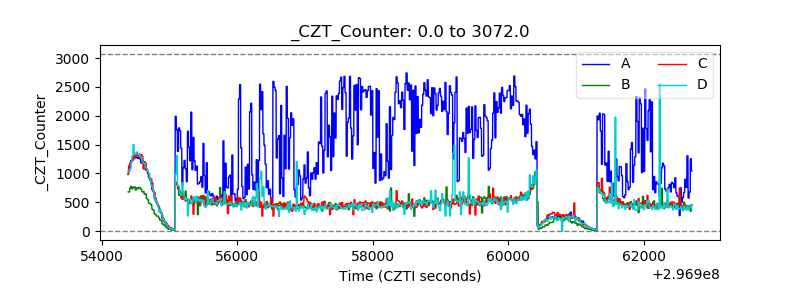 |
| +2.5 Volts monitor |  |
| +5 Volts monitor |  |
| _ROLL_ROT | 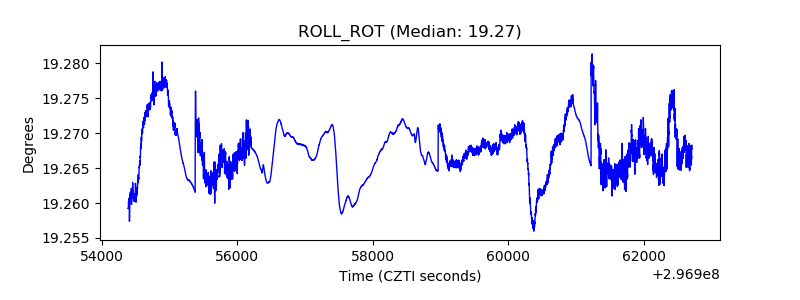 |
| _Roll_DEC | 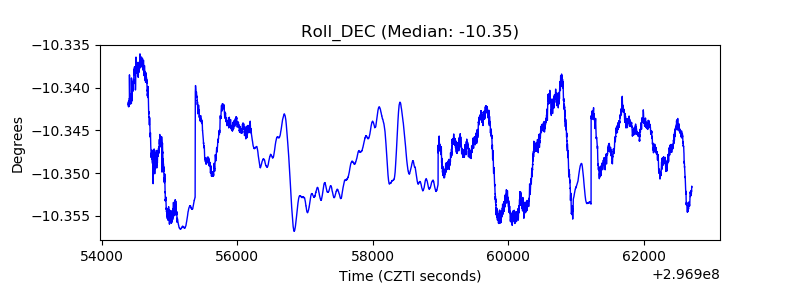 |
| _Roll_RA | 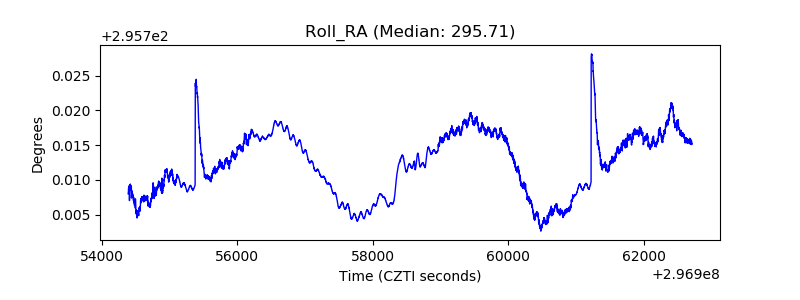 |
| Veto Counter | 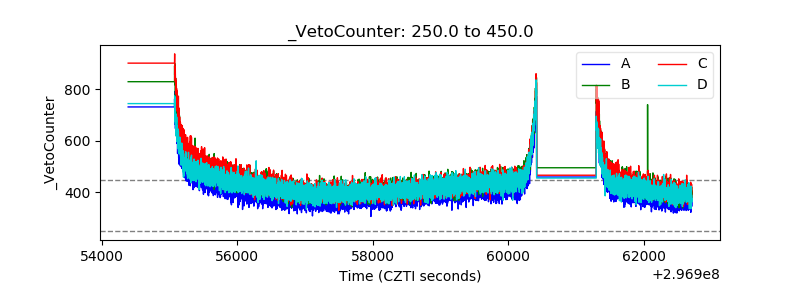 |