| Param | Original file | Final file |
|---|---|---|
| Filename | modeM0/AS1T03_118T01_9000002962_19849cztM0_level2.evt | modeM0/AS1T03_118T01_9000002962_19849cztM0_level2_quad_clean.evt |
| Size (bytes) | 854,979,840 | 104,160,960 |
| Size | 815.4 MB | 99.3 MB |
| Events in quadrant A | 12,311,911 | 579,799 |
| Events in quadrant B | 3,665,147 | 710,106 |
| Events in quadrant C | 3,667,628 | 681,015 |
| Events in quadrant D | 5,726,038 | 644,885 |
| Mode SS | |||
|---|---|---|---|
| Quadrant | BADHDUFLAG | Total packets | Discarded packets |
| A | 0 | 158 | 0 |
| B | 0 | 158 | 0 |
| C | 0 | 158 | 0 |
| D | 0 | 158 | 0 |
| Mode M9 | |||
|---|---|---|---|
| Quadrant | BADHDUFLAG | Total packets | Discarded packets |
| A | 0 | 2 | 0 |
| B | 0 | 2 | 0 |
| C | 0 | 2 | 0 |
| D | 0 | 2 | 0 |
| Mode M0 | |||
|---|---|---|---|
| Quadrant | BADHDUFLAG | Total packets | Discarded packets |
| A | 0 | 41860 | 1 |
| B | 0 | 15957 | 1 |
| C | 0 | 15897 | 2 |
| D | 0 | 22370 | 1 |
| Quadrant | Total seconds | Saturated seconds | Saturation percentage |
|---|---|---|---|
| A | 7729 | 3613 | 46.746021% |
| B | 7729 | 207 | 2.678225% |
| C | 7728 | 212 | 2.743271% |
| D | 7729 | 572 | 7.400699% |
Noise dominated data is calculated using 1-second bins in cleaned event files. If a bin has >2000 counts, and if more than 50% of those come from <1% of pixels, then it is considered to be noise-dominated and hence unusable.
| Quadrant | # 1 sec bins | Bins with >0 counts | Bins with >2000 counts | High rate bins dominated by noise | Noise dominated (total time) | Noise dominated (detector-on time) | Marked lightcurve |
|---|---|---|---|---|---|---|---|
| A | 7859 | 7729 | 3157 | 3157 | 40.17% | 40.85% | 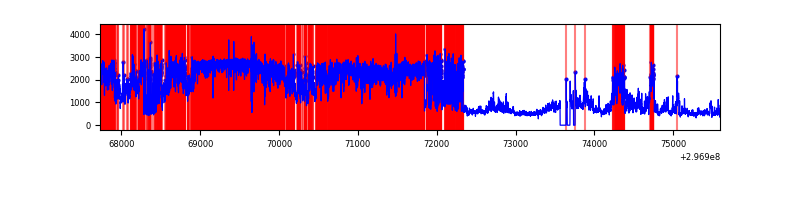 |
| B | 7859 | 7730 | 0 | 0 | 0.00% | 0.00% | 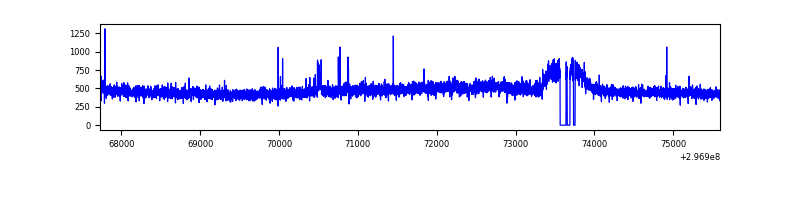 |
| C | 7858 | 7730 | 0 | 0 | 0.00% | 0.00% | 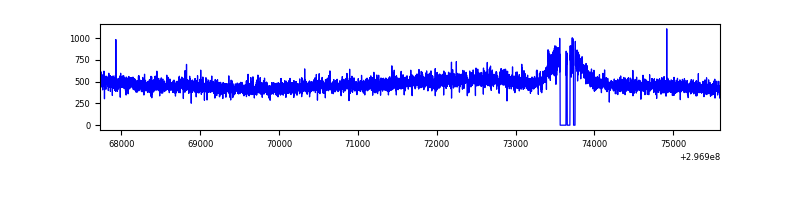 |
| D | 7859 | 7730 | 383 | 383 | 4.87% | 4.95% | 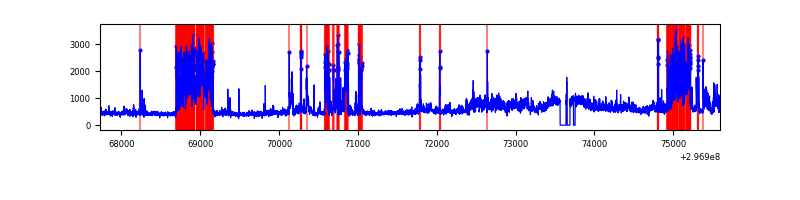 |
Top three noisy pixels from each quadrant. If the there are fewer than three noisy pixels in the level2.evt file, extra rows are filled as -1
| Pixel properties | Quadrant properties | ||||||
|---|---|---|---|---|---|---|---|
| Quadrant | DetID | PixID | Counts | Sigma | Mean | Median | Sigma |
| A | 14 | 238 | 8627552 | 55702.12 | 764 | 747 | 154.9 |
| A | 14 | 254 | 728421 | 4698.49 | 764 | 747 | 154.9 |
| A | 5 | 16 | 12271 | 74.41 | 764 | 747 | 154.9 |
| B | 12 | 111 | 22128 | 119.11 | 926 | 902 | 178.2 |
| B | 4 | 216 | 21375 | 114.89 | 926 | 902 | 178.2 |
| B | 11 | 111 | 19777 | 105.92 | 926 | 902 | 178.2 |
| C | 14 | 238 | 139436 | 652.3 | 899 | 904 | 212.4 |
| C | 9 | 221 | 16453 | 73.21 | 899 | 904 | 212.4 |
| C | 13 | 61 | 6078 | 24.36 | 899 | 904 | 212.4 |
| D | 2 | 184 | 1651301 | 7513.79 | 900 | 870 | 219.7 |
| D | 1 | 52 | 664877 | 3022.97 | 900 | 870 | 219.7 |
| D | 2 | 234 | 30662 | 135.63 | 900 | 870 | 219.7 |
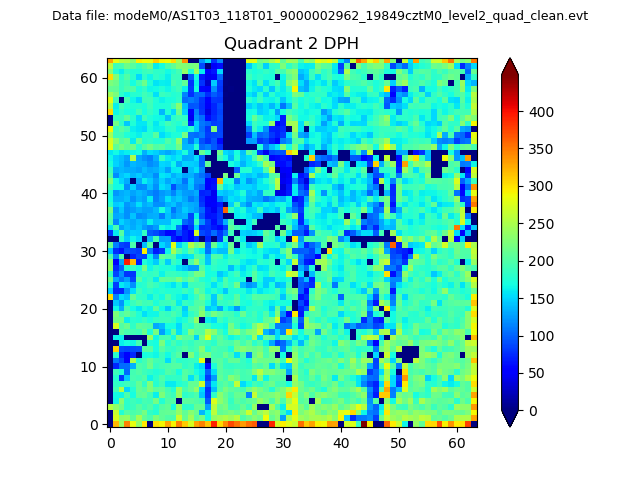
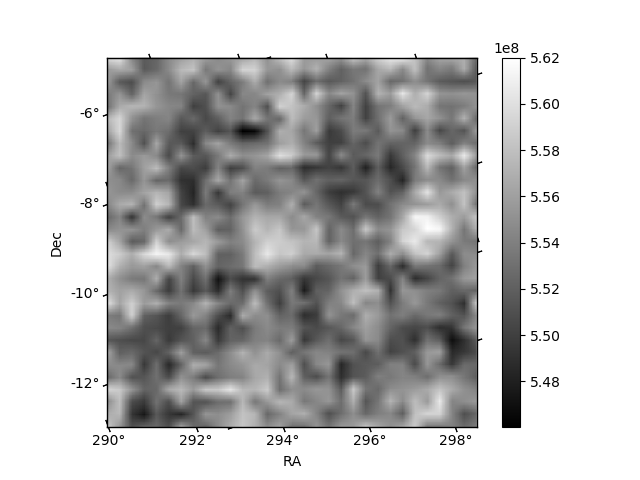
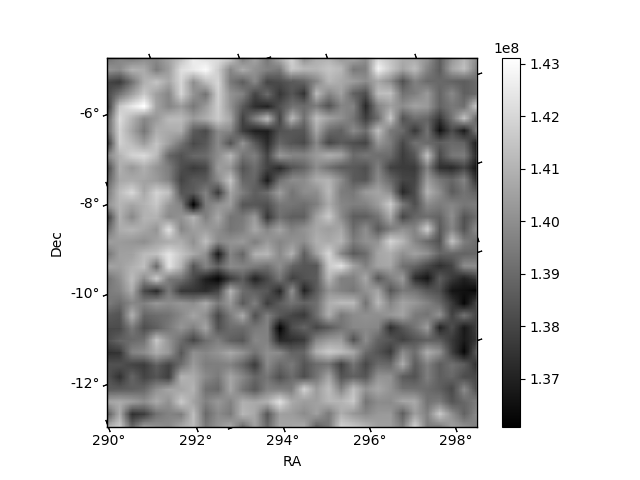
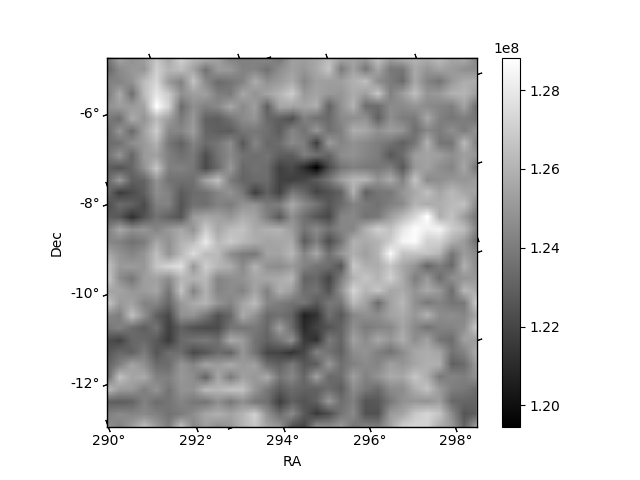
Histogram calculated using DETX and DETY for each event in the final _common_clean file
| Quadrant A | 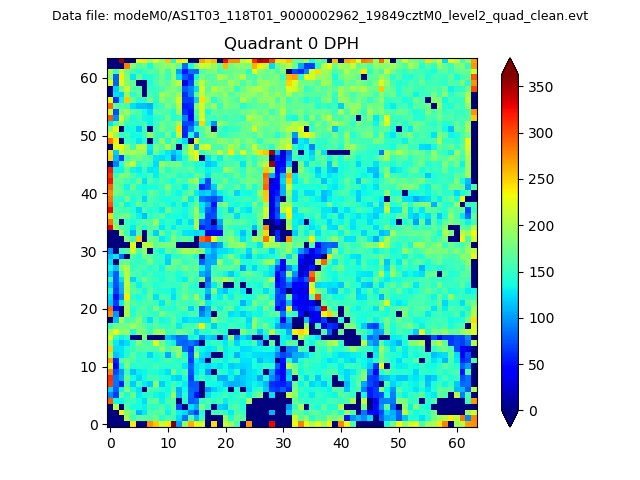 |
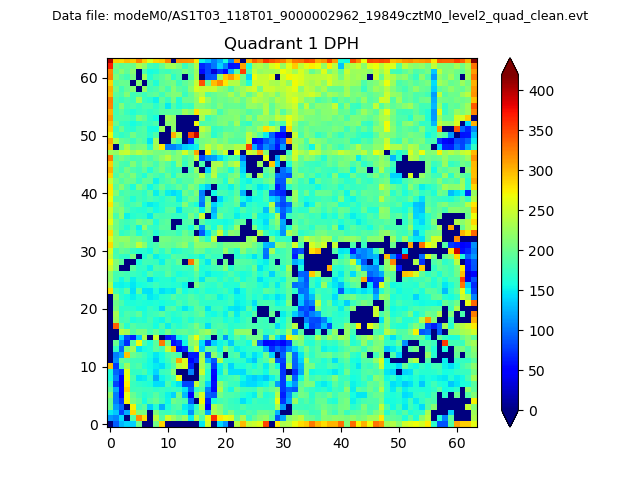 |
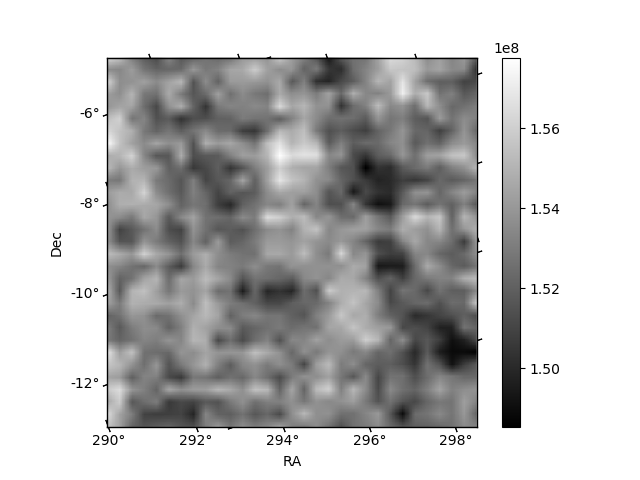
Quadrant B |
|---|---|---|---|
| Quadrant D | 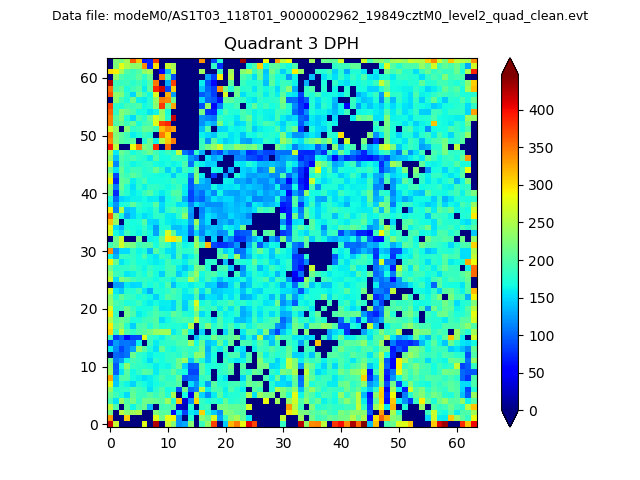 |
 |
Quadrant C |
| Plot type | Count rate plots | Images |
|---|---|---|
| Comparison with Poisson distribution Blue bars denote a histogram of data divided into 1 sec bins. Red curve is a Poisson curve with rate = median count rate of data. |
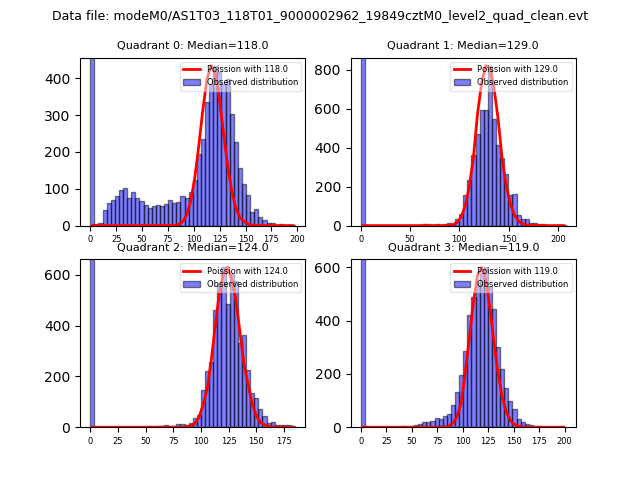 |
 |
| Quadrant-wise count rates Data is divided into 100 sec bins |
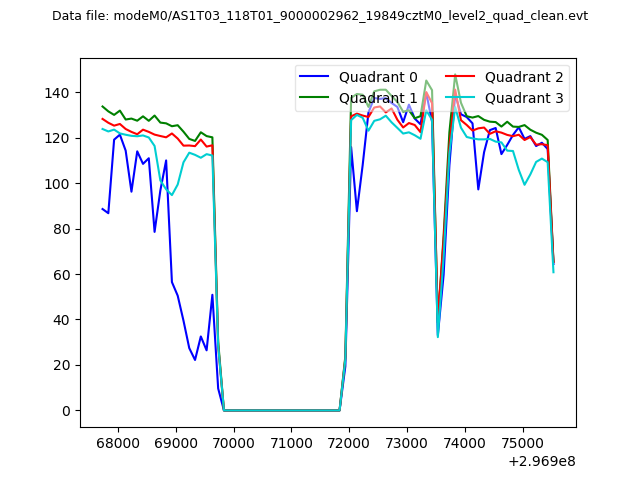 |
|
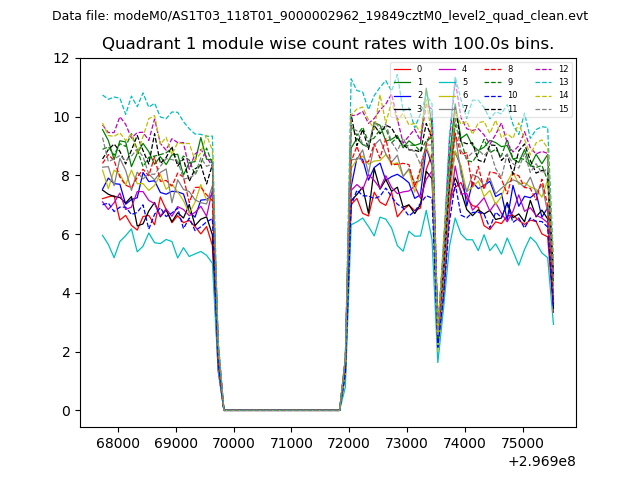
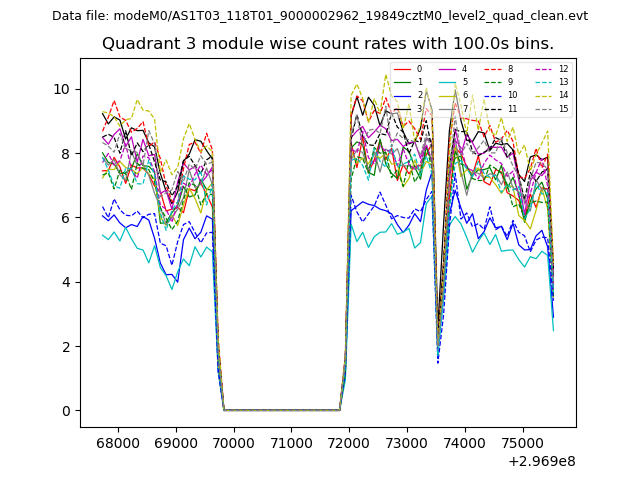
| Module-wise count rates for Quadrant A Data is divided into 100 sec bins |
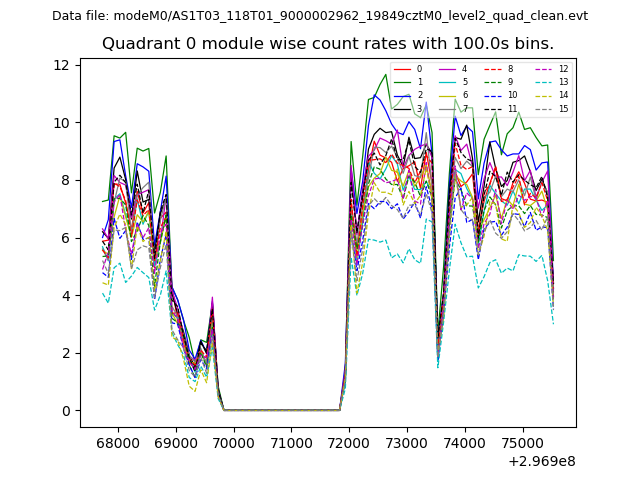 |
 |
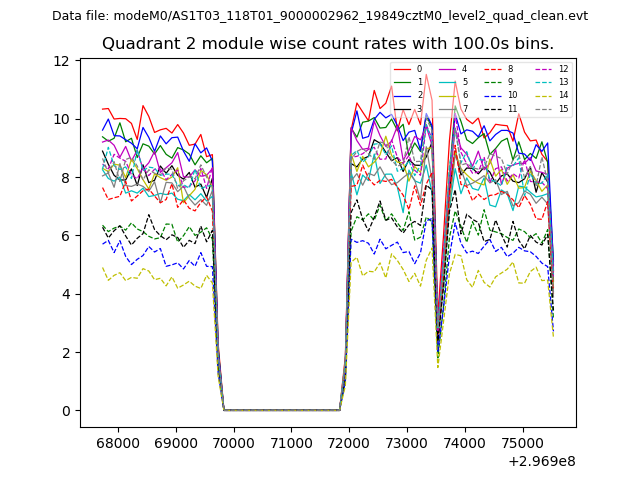
| Module-wise count rates for Quadrant B Data is divided into 100 sec bins |
 |
 |
| Module-wise count rates for Quadrant C Data is divided into 100 sec bins |
 |
 |
| Module-wise count rates for Quadrant D Data is divided into 100 sec bins |
 |
 |
| Parameter | Plot |
|---|---|
| CZT HV Monitor | 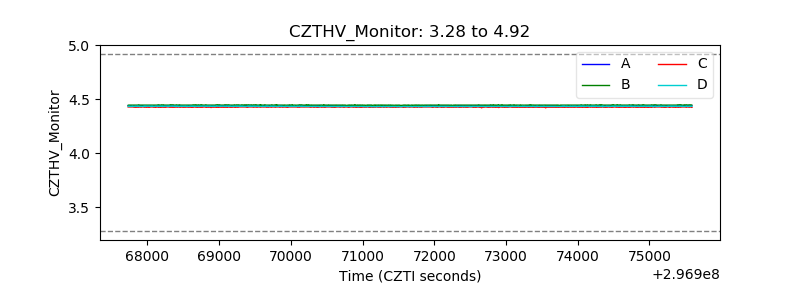 |
| D_VDD | 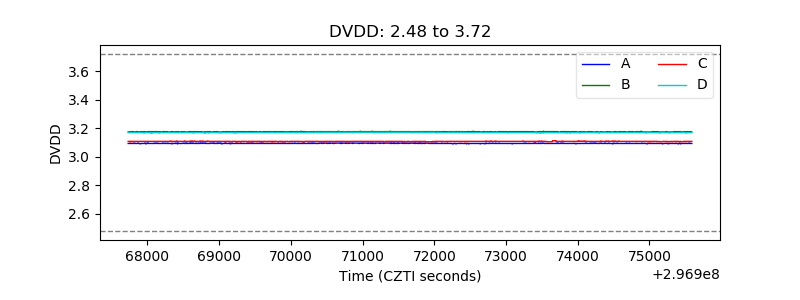 |
| Temperature 1 | 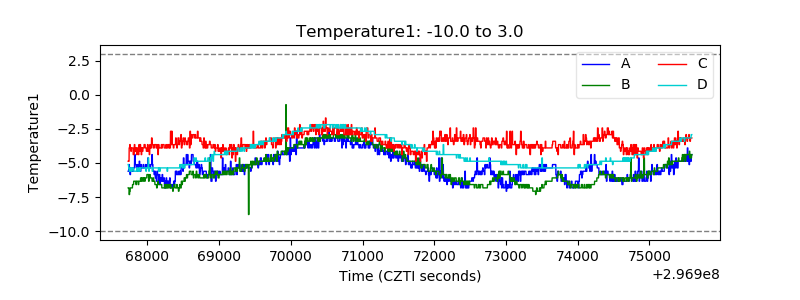 |
| Veto HV Monitor | 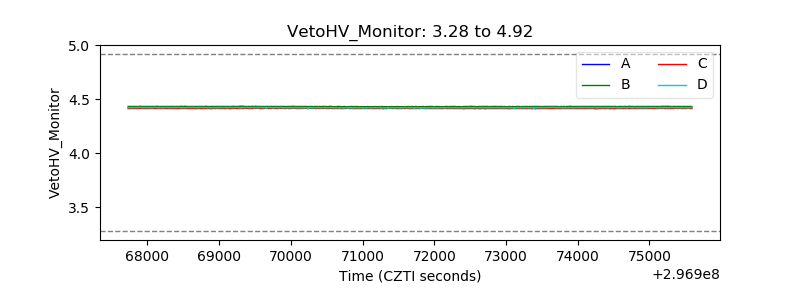 |
| Veto LLD | 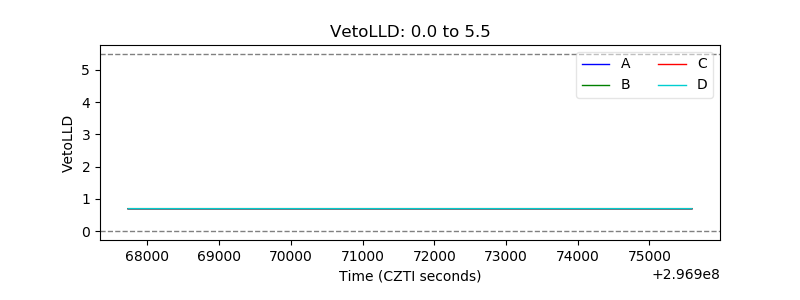 |
| Alpha Counter | 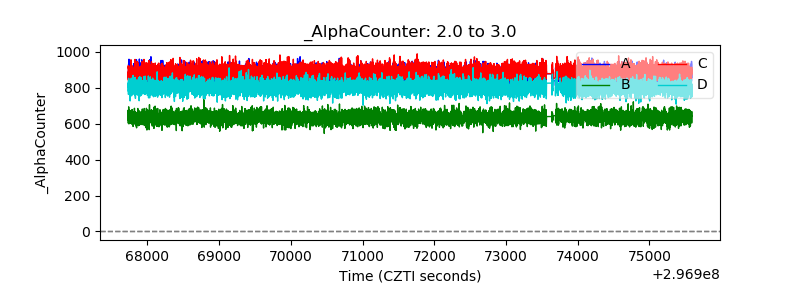 |
| _CPM_Rate | 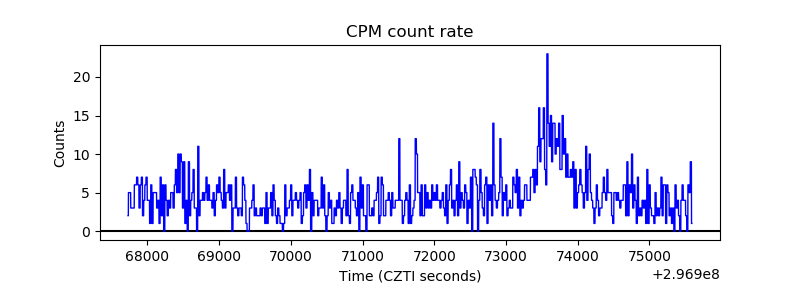 |
| CZT Counter | 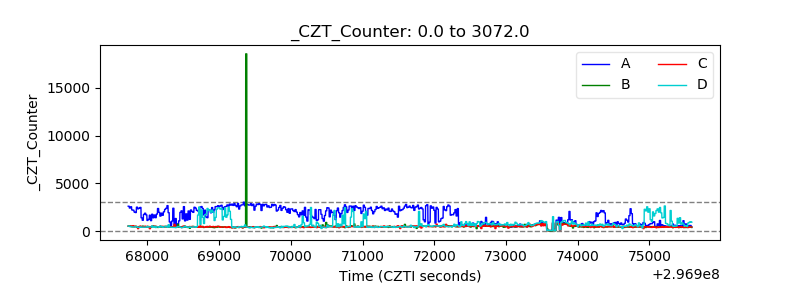 |
| +2.5 Volts monitor |  |
| +5 Volts monitor |  |
| _ROLL_ROT | 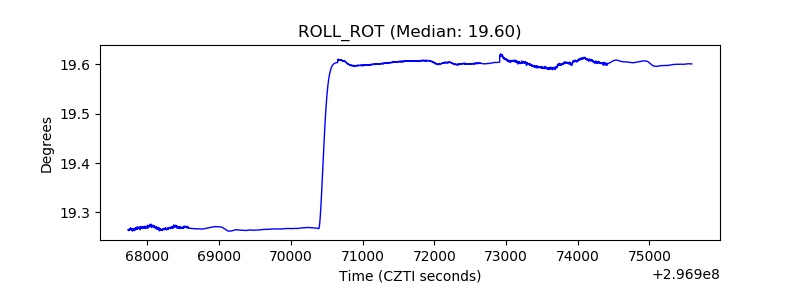 |
| _Roll_DEC | 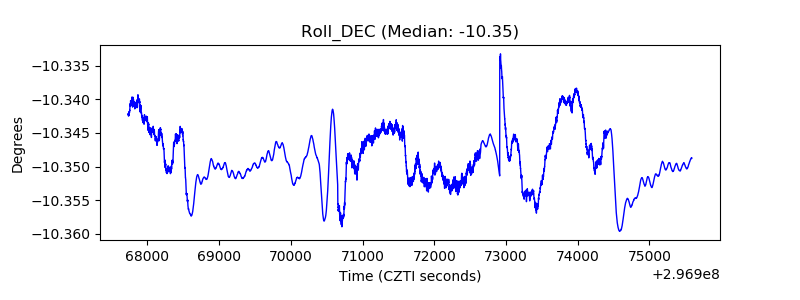 |
| _Roll_RA | 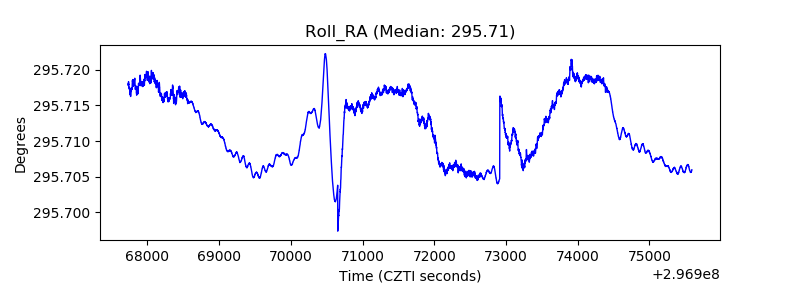 |
| Veto Counter | 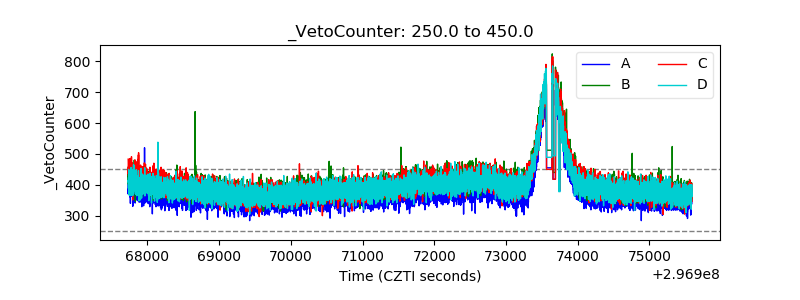 |