| Param | Original file | Final file |
|---|---|---|
| Filename | modeM0/AS1T03_118T01_9000002962_19853cztM0_level2.evt | modeM0/AS1T03_118T01_9000002962_19853cztM0_level2_quad_clean.evt |
| Size (bytes) | 3,881,289,600 | 407,960,640 |
| Size | 3.6 GB | 389.1 MB |
| Events in quadrant A | 55,908,305 | 2,126,681 |
| Events in quadrant B | 17,253,339 | 2,701,753 |
| Events in quadrant C | 17,047,828 | 2,582,707 |
| Events in quadrant D | 24,931,475 | 2,484,549 |
| Mode SS | |||
|---|---|---|---|
| Quadrant | BADHDUFLAG | Total packets | Discarded packets |
| A | 0 | 728 | 0 |
| B | 0 | 728 | 0 |
| C | 0 | 728 | 0 |
| D | 0 | 728 | 0 |
| Mode M9 | |||
|---|---|---|---|
| Quadrant | BADHDUFLAG | Total packets | Discarded packets |
| A | 0 | 29 | 0 |
| B | 0 | 29 | 0 |
| C | 0 | 29 | 0 |
| D | 0 | 29 | 0 |
| Mode M0 | |||
|---|---|---|---|
| Quadrant | BADHDUFLAG | Total packets | Discarded packets |
| A | 0 | 191096 | 6 |
| B | 0 | 73866 | 6 |
| C | 0 | 73354 | 6 |
| D | 0 | 98815 | 6 |
| Quadrant | Total seconds | Saturated seconds | Saturation percentage |
|---|---|---|---|
| A | 35762 | 15846 | 44.309602% |
| B | 35762 | 644 | 1.800794% |
| C | 35763 | 672 | 1.879037% |
| D | 35763 | 1440 | 4.026508% |
Noise dominated data is calculated using 1-second bins in cleaned event files. If a bin has >2000 counts, and if more than 50% of those come from <1% of pixels, then it is considered to be noise-dominated and hence unusable.
| Quadrant | # 1 sec bins | Bins with >0 counts | Bins with >2000 counts | High rate bins dominated by noise | Noise dominated (total time) | Noise dominated (detector-on time) | Marked lightcurve |
|---|---|---|---|---|---|---|---|
| A | 38622 | 35759 | 13146 | 13146 | 34.04% | 36.76% | 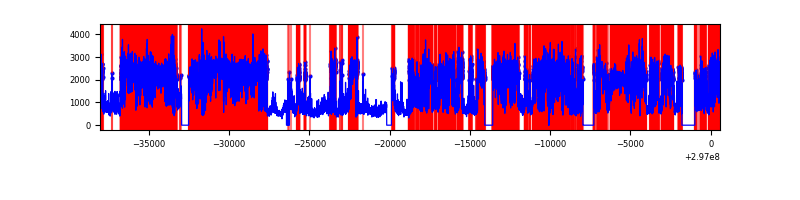 |
| B | 38623 | 35764 | 24 | 24 | 0.06% | 0.07% | 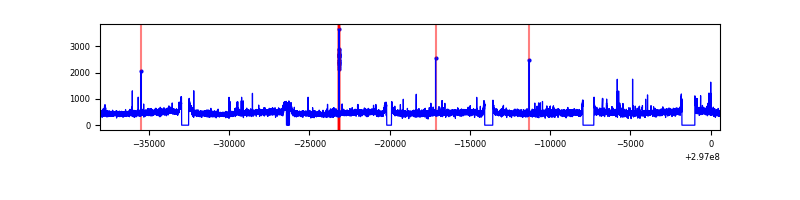 |
| C | 38624 | 35766 | 0 | 0 | 0.00% | 0.00% | 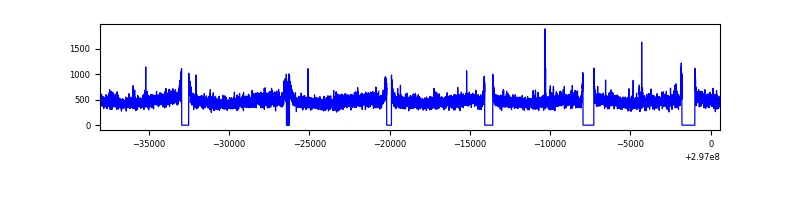 |
| D | 38624 | 35765 | 852 | 852 | 2.21% | 2.38% | 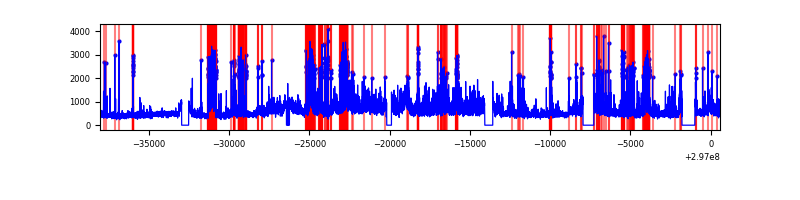 |
Top three noisy pixels from each quadrant. If the there are fewer than three noisy pixels in the level2.evt file, extra rows are filled as -1
| Pixel properties | Quadrant properties | ||||||
|---|---|---|---|---|---|---|---|
| Quadrant | DetID | PixID | Counts | Sigma | Mean | Median | Sigma |
| A | 14 | 238 | 39716504 | 56929.75 | 3484 | 3406 | 697.6 |
| A | 14 | 254 | 2702492 | 3869.21 | 3484 | 3406 | 697.6 |
| A | 9 | 143 | 46986 | 62.47 | 3484 | 3406 | 697.6 |
| B | 0 | 198 | 106135 | 123.98 | 4315 | 4204 | 822.2 |
| B | 12 | 111 | 103338 | 120.58 | 4315 | 4204 | 822.2 |
| B | 3 | 64 | 92966 | 107.96 | 4315 | 4204 | 822.2 |
| C | 14 | 238 | 643751 | 655.16 | 4173 | 4203 | 976.2 |
| C | 9 | 221 | 83484 | 81.22 | 4173 | 4203 | 976.2 |
| C | 13 | 61 | 28859 | 25.26 | 4173 | 4203 | 976.2 |
| D | 2 | 184 | 5602108 | 5475.35 | 4212 | 4087 | 1022.4 |
| D | 1 | 52 | 2610090 | 2548.9 | 4212 | 4087 | 1022.4 |
| D | 7 | 238 | 545065 | 529.12 | 4212 | 4087 | 1022.4 |
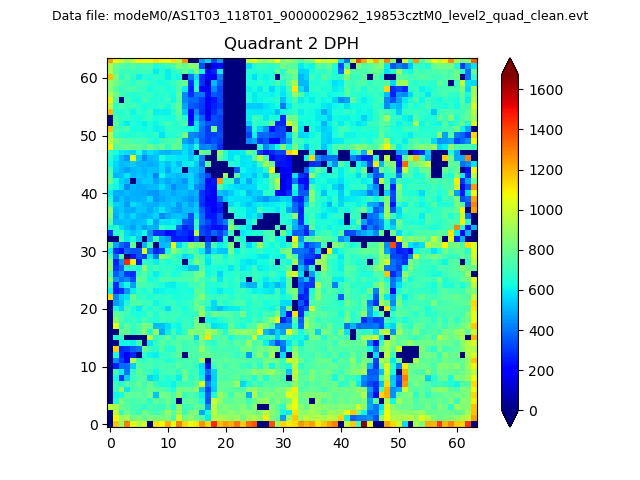
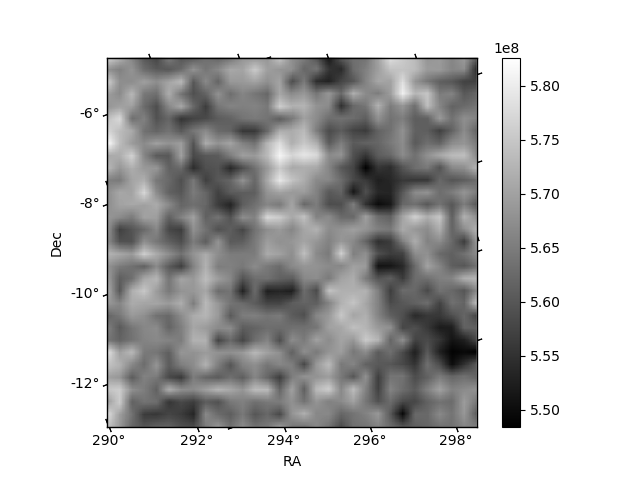
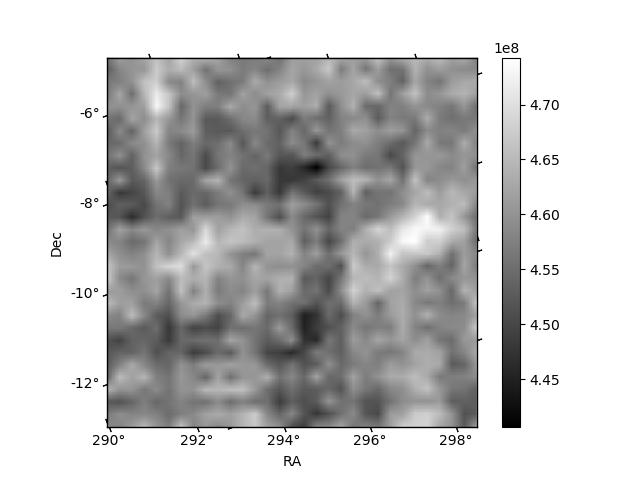
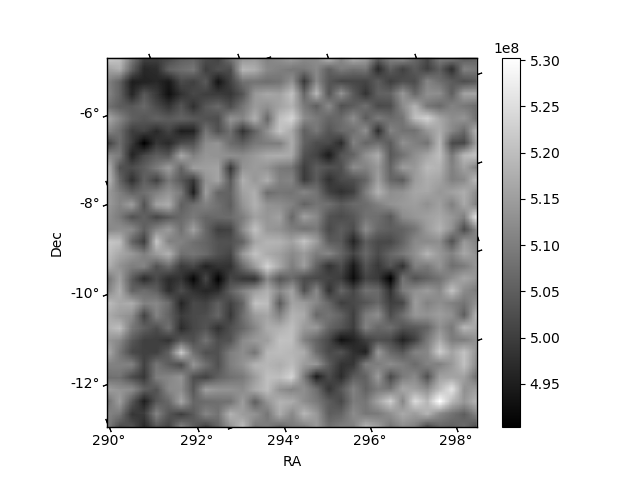
Histogram calculated using DETX and DETY for each event in the final _common_clean file
| Quadrant A | 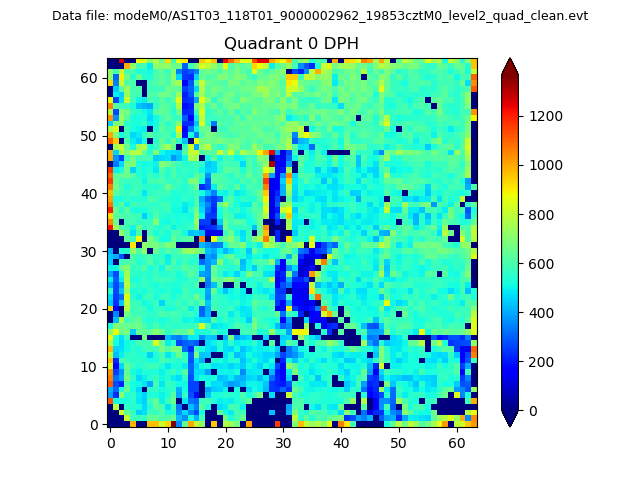 |
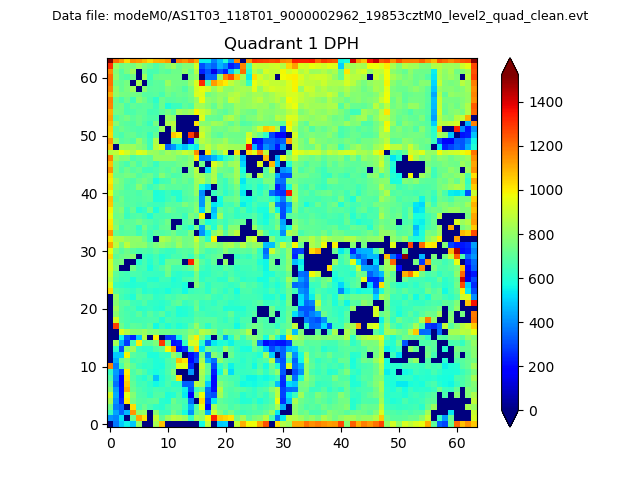 |
Quadrant B |
|---|---|---|---|
| Quadrant D | 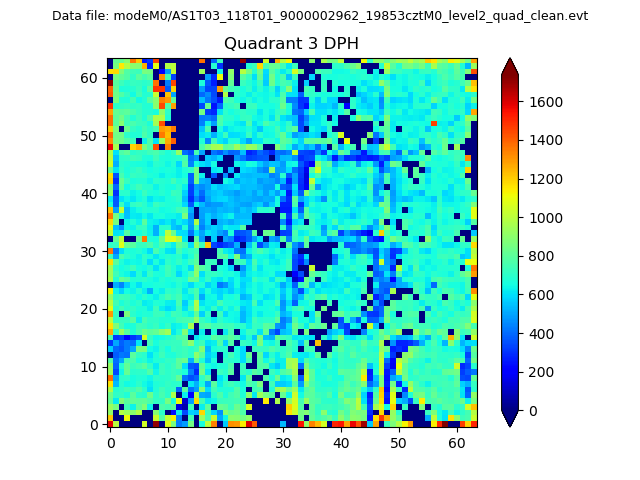 |
 |
Quadrant C |
| Plot type | Count rate plots | Images |
|---|---|---|
| Comparison with Poisson distribution Blue bars denote a histogram of data divided into 1 sec bins. Red curve is a Poisson curve with rate = median count rate of data. |
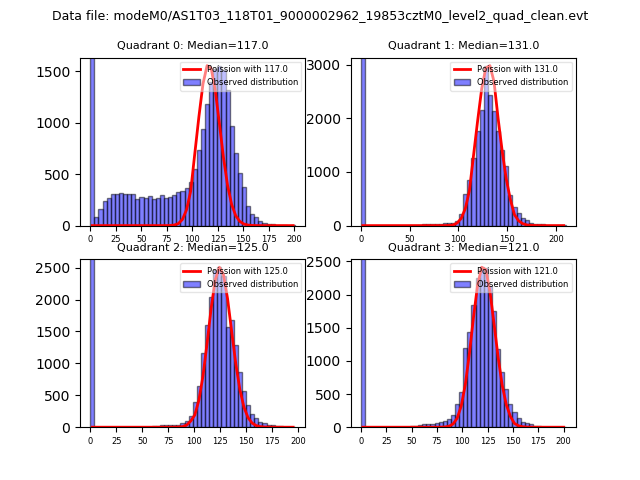 |
 |
| Quadrant-wise count rates Data is divided into 100 sec bins |
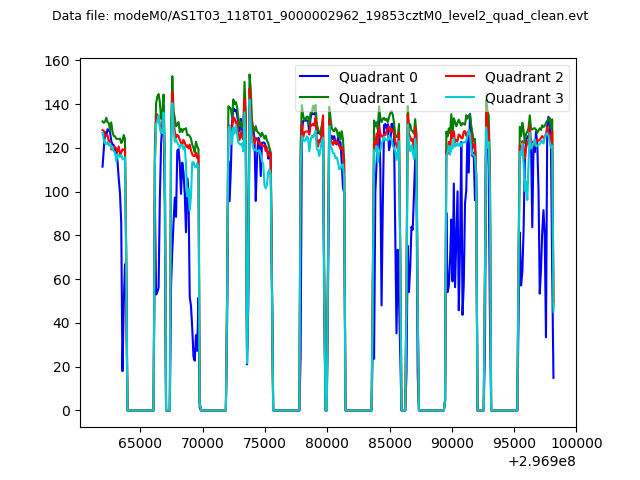 |
|
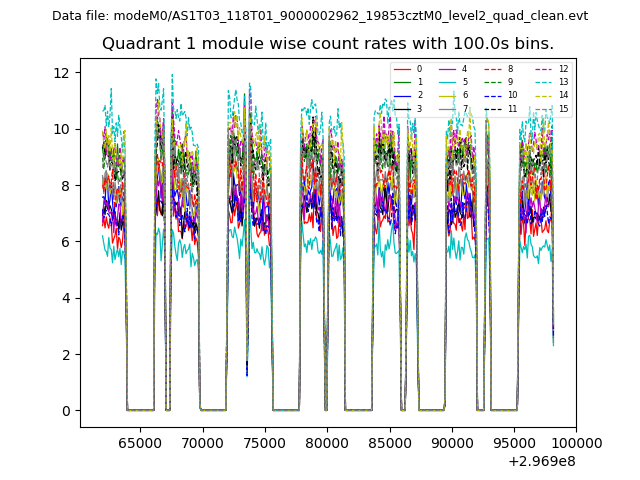
| Module-wise count rates for Quadrant A Data is divided into 100 sec bins |
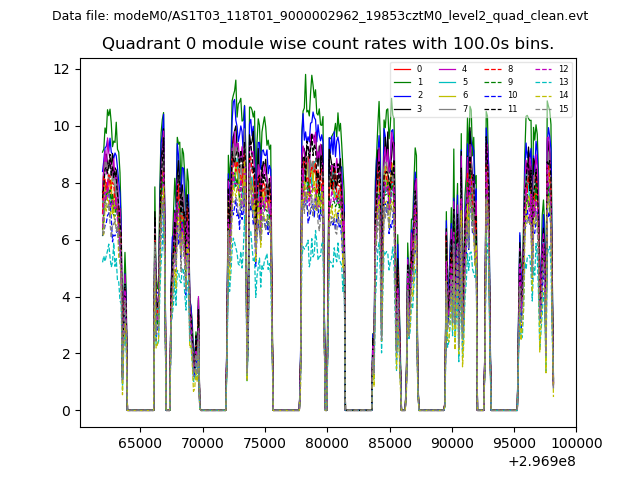 |
 |
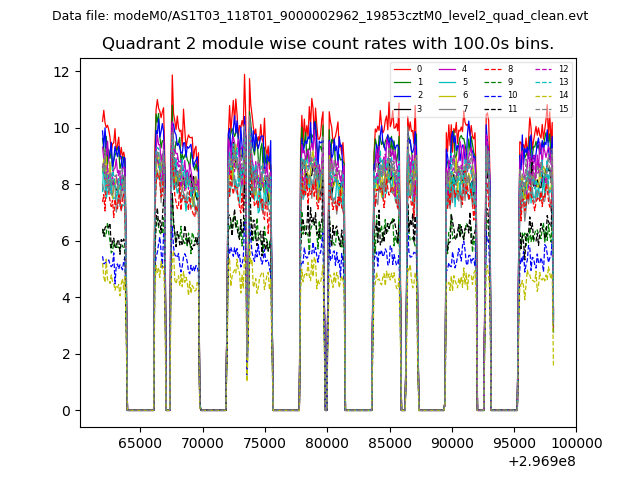
| Module-wise count rates for Quadrant B Data is divided into 100 sec bins |
 |
 |
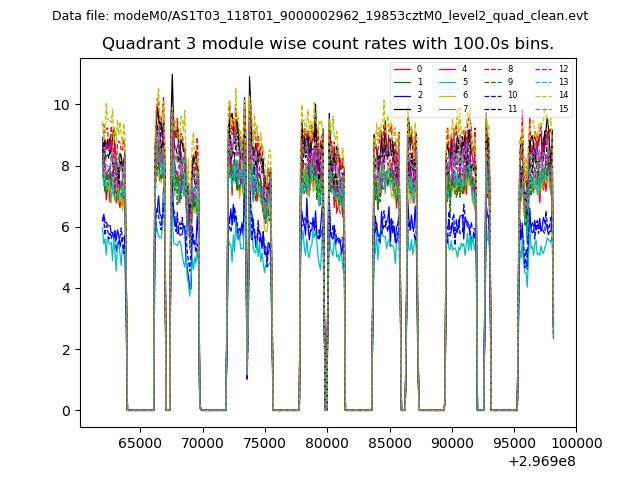
| Module-wise count rates for Quadrant C Data is divided into 100 sec bins |
 |
 |
| Module-wise count rates for Quadrant D Data is divided into 100 sec bins |
 |
 |
| Parameter | Plot |
|---|---|
| CZT HV Monitor | 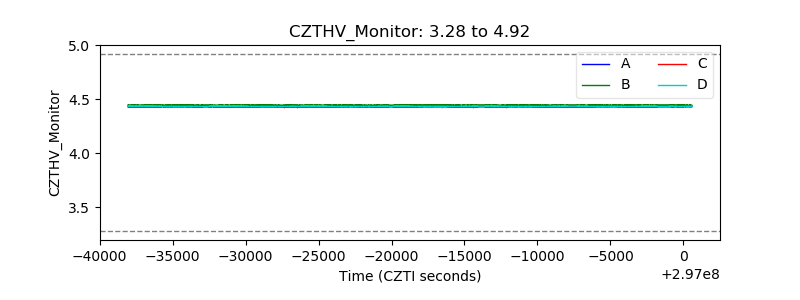 |
| D_VDD | 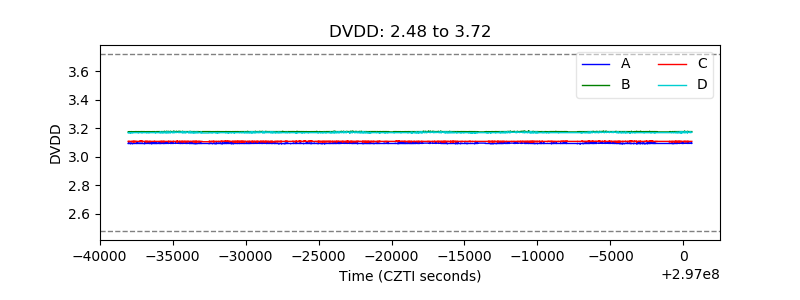 |
| Temperature 1 | 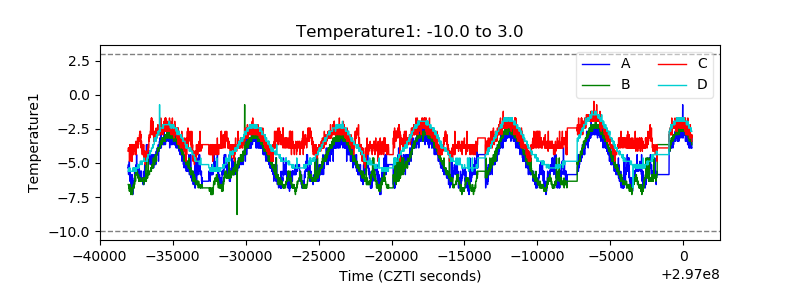 |
| Veto HV Monitor | 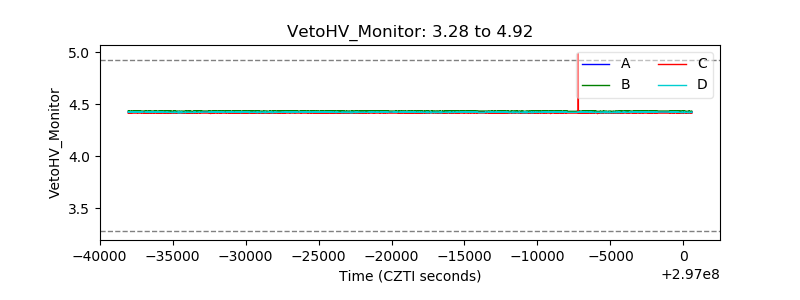 |
| Veto LLD | 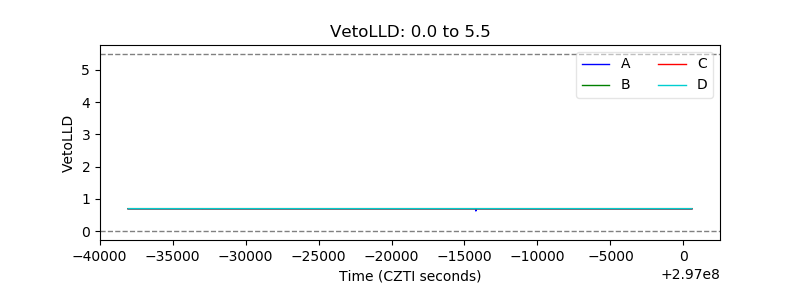 |
| Alpha Counter | 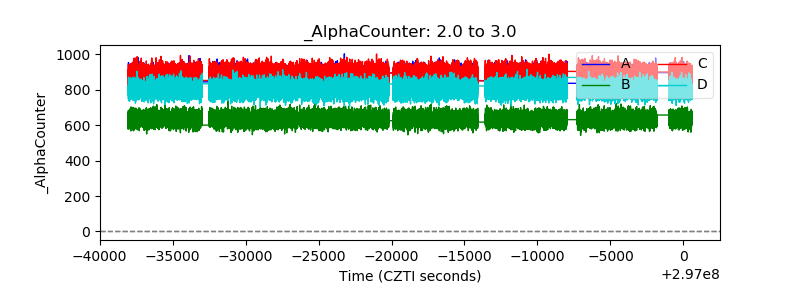 |
| _CPM_Rate | 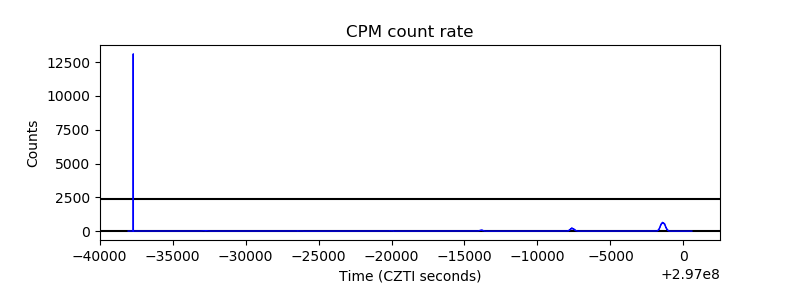 |
| CZT Counter | 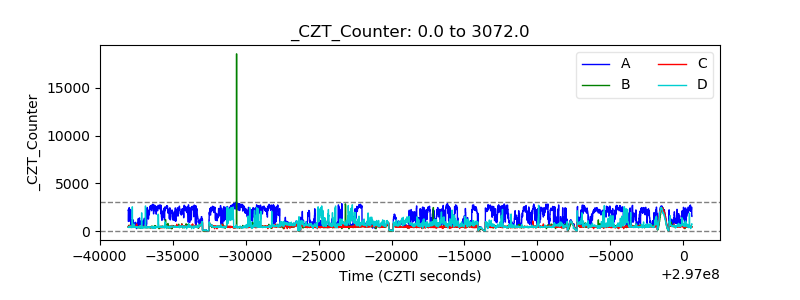 |
| +2.5 Volts monitor |  |
| +5 Volts monitor |  |
| _ROLL_ROT | 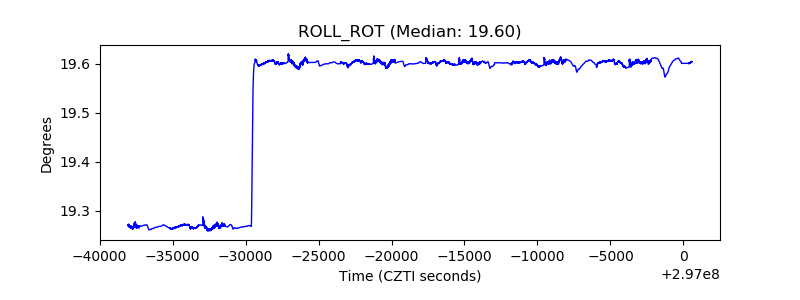 |
| _Roll_DEC | 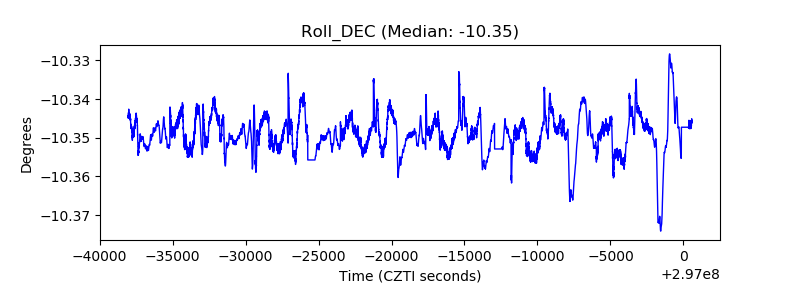 |
| _Roll_RA |  |
| Veto Counter | 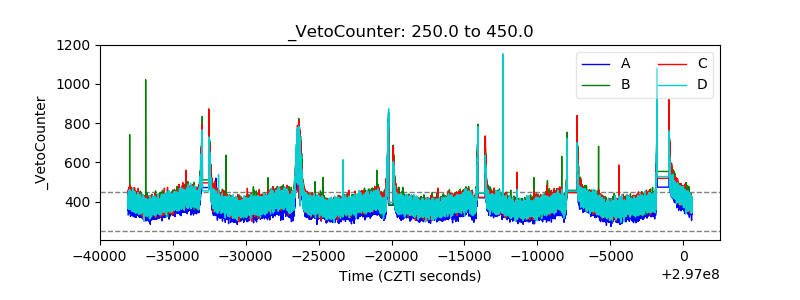 |