| Param | Original file | Final file |
|---|---|---|
| Filename | modeM0/AS1T03_118T01_9000002962_19856cztM0_level2.evt | modeM0/AS1T03_118T01_9000002962_19856cztM0_level2_quad_clean.evt |
| Size (bytes) | 766,218,240 | 65,848,320 |
| Size | 730.7 MB | 62.8 MB |
| Events in quadrant A | 12,385,453 | 260,832 |
| Events in quadrant B | 3,296,667 | 450,087 |
| Events in quadrant C | 3,140,088 | 428,810 |
| Events in quadrant D | 3,963,455 | 420,895 |
| Mode SS | |||
|---|---|---|---|
| Quadrant | BADHDUFLAG | Total packets | Discarded packets |
| A | 0 | 128 | 6 |
| B | 0 | 128 | 4 |
| C | 0 | 128 | 2 |
| D | 0 | 128 | 2 |
| Mode M9 | |||
|---|---|---|---|
| Quadrant | BADHDUFLAG | Total packets | Discarded packets |
| A | 0 | 12 | 0 |
| B | 0 | 12 | 0 |
| C | 0 | 12 | 0 |
| D | 0 | 12 | 0 |
| Mode M0 | |||
|---|---|---|---|
| Quadrant | BADHDUFLAG | Total packets | Discarded packets |
| A | 0 | 42518 | 1522 |
| B | 0 | 14154 | 341 |
| C | 0 | 13515 | 308 |
| D | 0 | 16390 | 397 |
| Quadrant | Total seconds | Saturated seconds | Saturation percentage |
|---|---|---|---|
| A | 6131 | 4560 | 74.376121% |
| B | 6217 | 74 | 1.190285% |
| C | 6219 | 63 | 1.013025% |
| D | 6210 | 113 | 1.819646% |
Noise dominated data is calculated using 1-second bins in cleaned event files. If a bin has >2000 counts, and if more than 50% of those come from <1% of pixels, then it is considered to be noise-dominated and hence unusable.
| Quadrant | # 1 sec bins | Bins with >0 counts | Bins with >2000 counts | High rate bins dominated by noise | Noise dominated (total time) | Noise dominated (detector-on time) | Marked lightcurve |
|---|---|---|---|---|---|---|---|
| A | 7504 | 6157 | 3916 | 3916 | 52.19% | 63.60% | 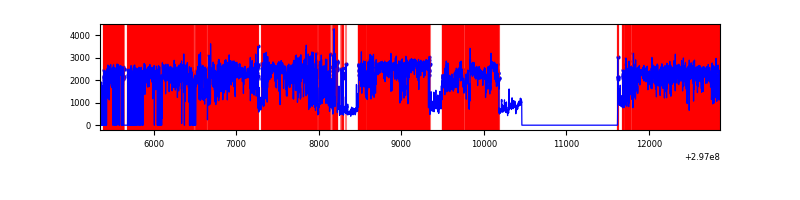 |
| B | 7503 | 6289 | 19 | 19 | 0.25% | 0.30% | 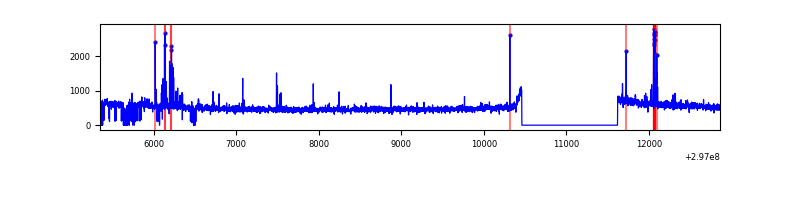 |
| C | 7511 | 6292 | 0 | 0 | 0.00% | 0.00% | 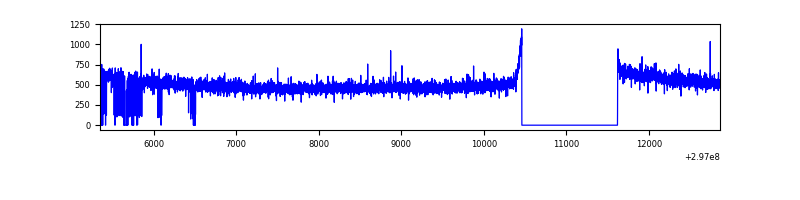 |
| D | 7511 | 6285 | 76 | 76 | 1.01% | 1.21% | 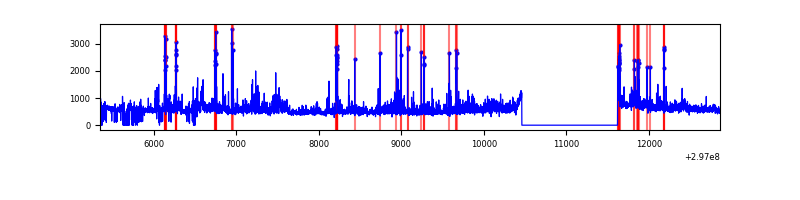 |
Top three noisy pixels from each quadrant. If the there are fewer than three noisy pixels in the level2.evt file, extra rows are filled as -1
| Pixel properties | Quadrant properties | ||||||
|---|---|---|---|---|---|---|---|
| Quadrant | DetID | PixID | Counts | Sigma | Mean | Median | Sigma |
| A | 14 | 238 | 10070855 | 106048.16 | 471 | 462 | 95.0 |
| A | 14 | 254 | 490620 | 5161.7 | 471 | 462 | 95.0 |
| A | 5 | 16 | 9794 | 98.27 | 471 | 462 | 95.0 |
| B | 3 | 64 | 68429 | 448.05 | 797 | 778 | 151.0 |
| B | 7 | 220 | 39327 | 255.31 | 797 | 778 | 151.0 |
| B | 4 | 216 | 29660 | 191.28 | 797 | 778 | 151.0 |
| C | 14 | 238 | 120163 | 663.21 | 770 | 776 | 180.0 |
| C | 9 | 221 | 7837 | 39.22 | 770 | 776 | 180.0 |
| C | 3 | 233 | 7327 | 36.39 | 770 | 776 | 180.0 |
| D | 2 | 184 | 591767 | 3170.95 | 772 | 750 | 186.4 |
| D | 1 | 52 | 345194 | 1848.03 | 772 | 750 | 186.4 |
| D | 12 | 218 | 51970 | 274.81 | 772 | 750 | 186.4 |
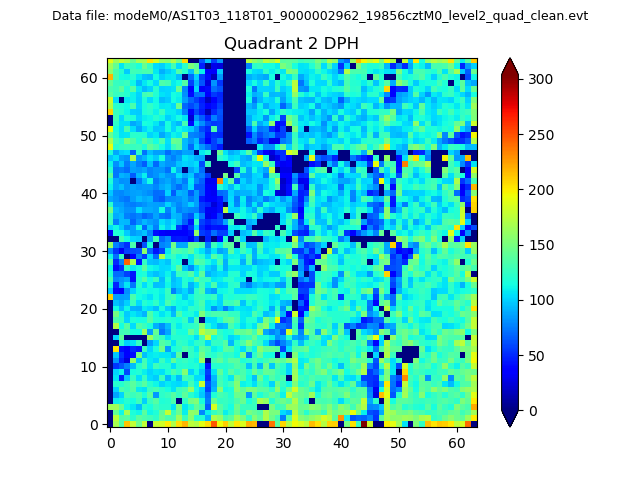
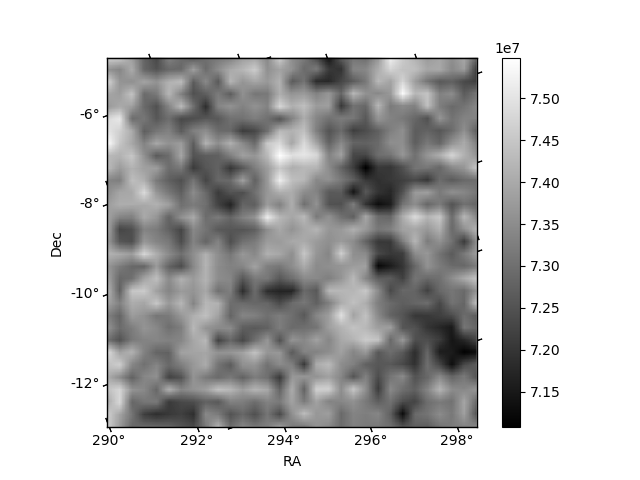
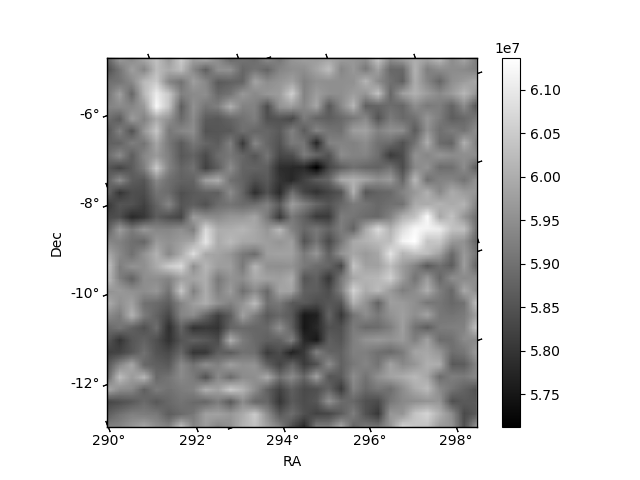
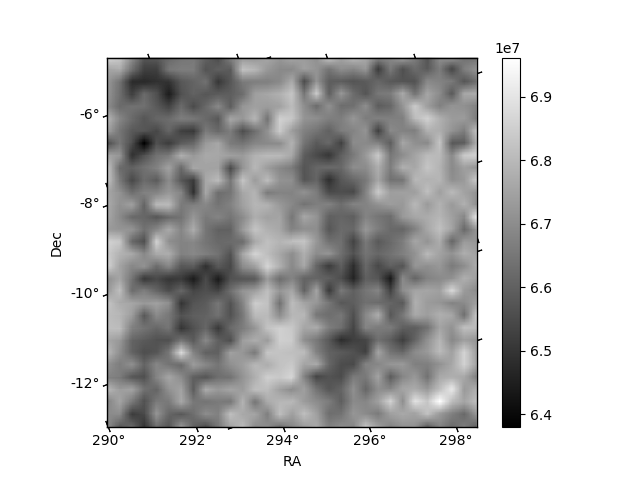
Histogram calculated using DETX and DETY for each event in the final _common_clean file
| Quadrant A | 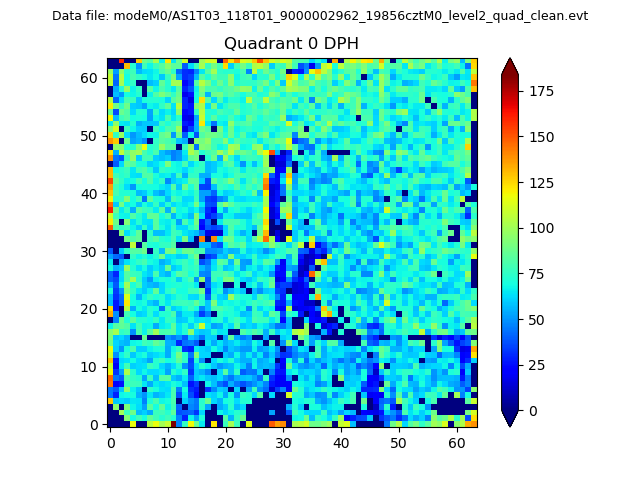 |
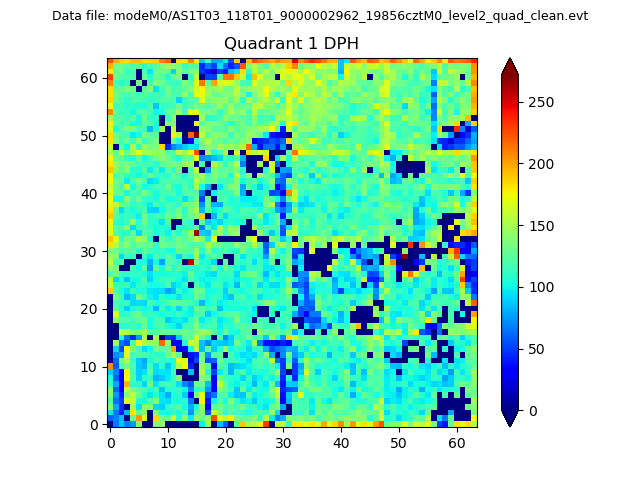 |
Quadrant B |
|---|---|---|---|
| Quadrant D | 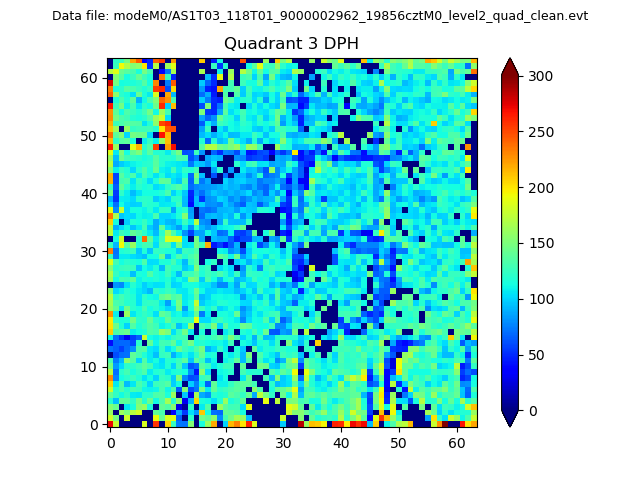 |
 |
Quadrant C |
| Plot type | Count rate plots | Images |
|---|---|---|
| Comparison with Poisson distribution Blue bars denote a histogram of data divided into 1 sec bins. Red curve is a Poisson curve with rate = median count rate of data. |
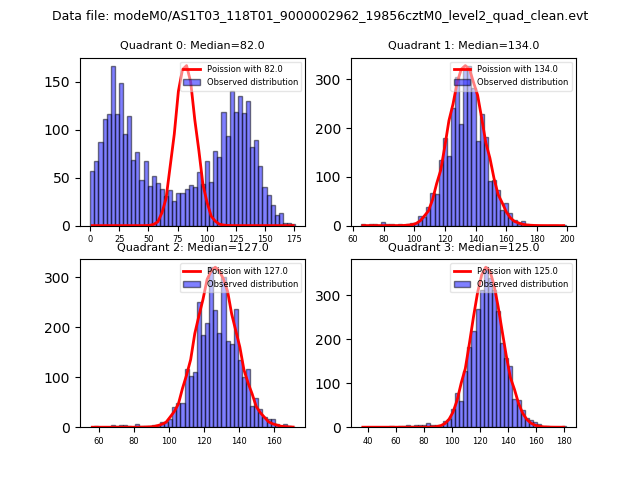 |
 |
| Quadrant-wise count rates Data is divided into 100 sec bins |
 |
|
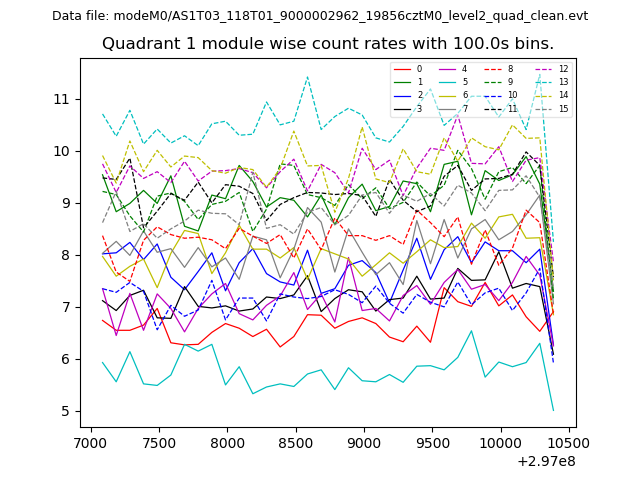
| Module-wise count rates for Quadrant A Data is divided into 100 sec bins |
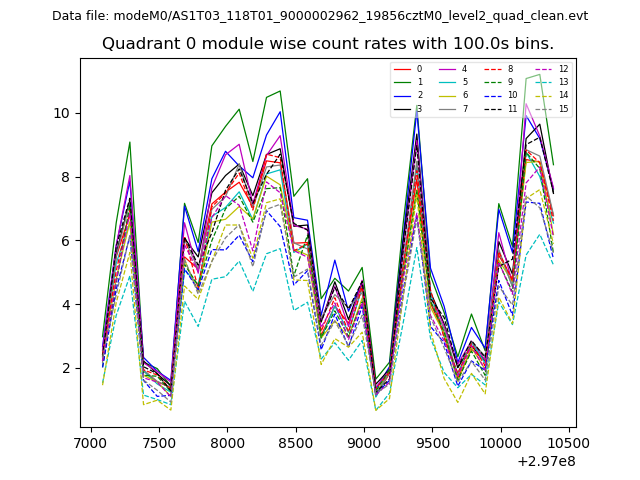 |
 |
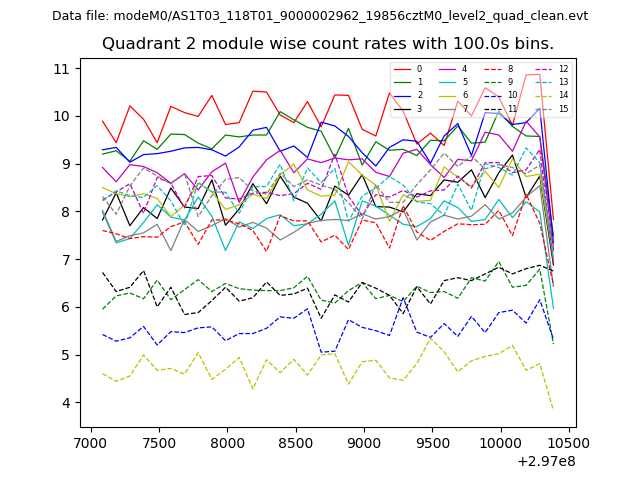
| Module-wise count rates for Quadrant B Data is divided into 100 sec bins |
 |
 |
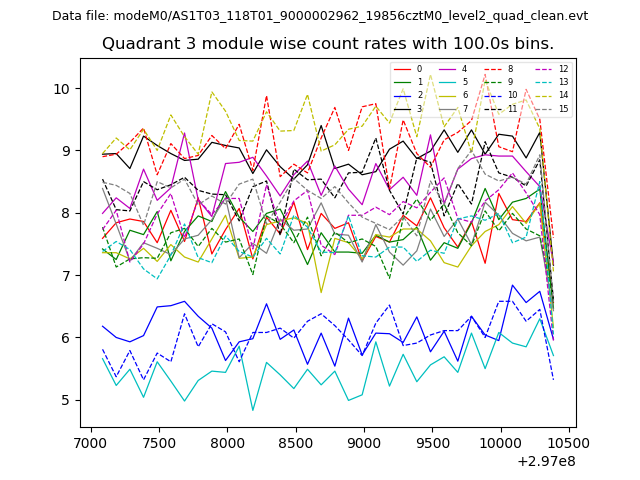
| Module-wise count rates for Quadrant C Data is divided into 100 sec bins |
 |
 |
| Module-wise count rates for Quadrant D Data is divided into 100 sec bins |
 |
 |
| Parameter | Plot |
|---|---|
| CZT HV Monitor | 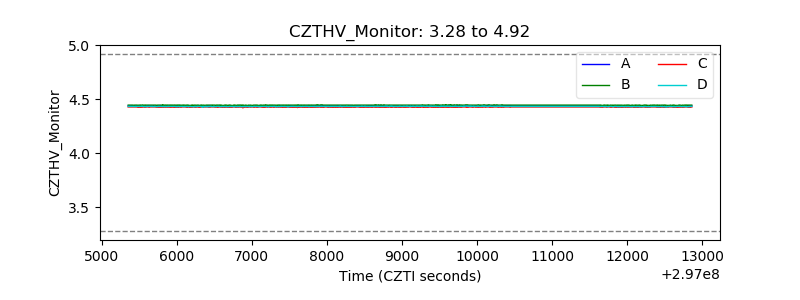 |
| D_VDD | 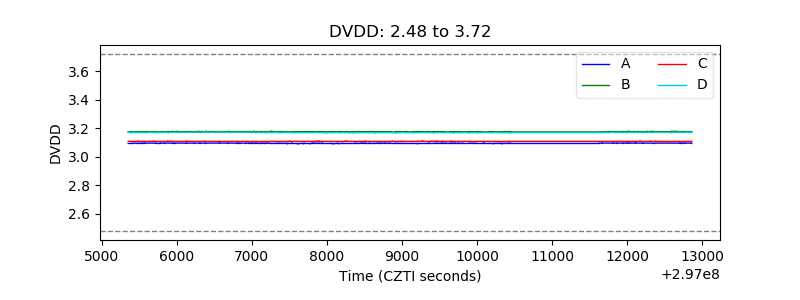 |
| Temperature 1 |  |
| Veto HV Monitor | 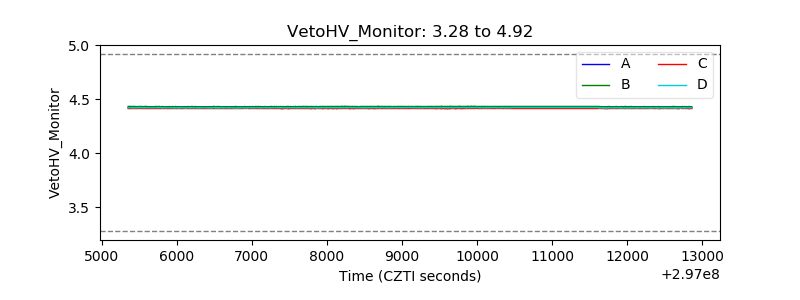 |
| Veto LLD | 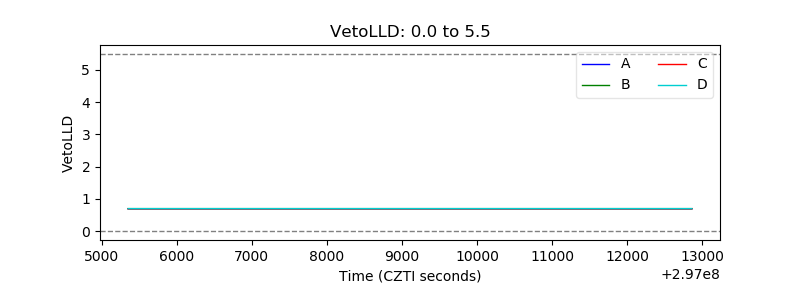 |
| Alpha Counter | 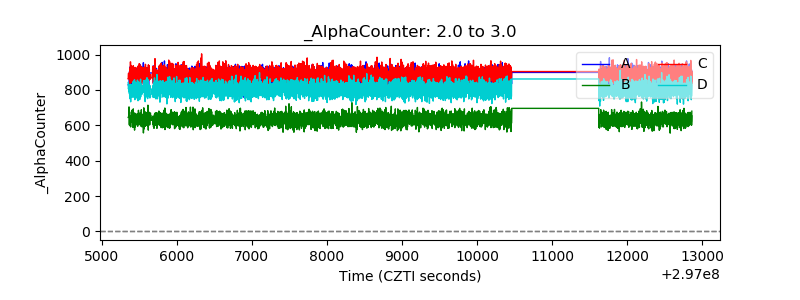 |
| _CPM_Rate | 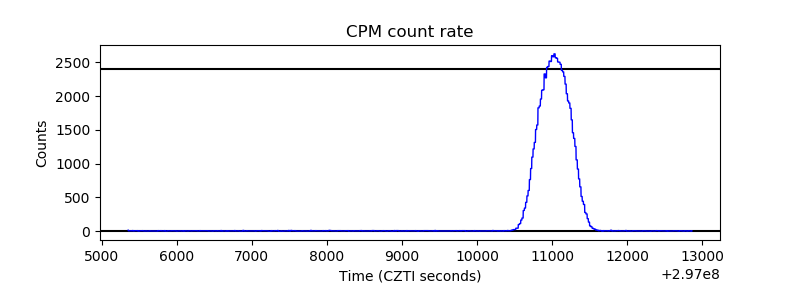 |
| CZT Counter |  |
| +2.5 Volts monitor |  |
| +5 Volts monitor |  |
| _ROLL_ROT | 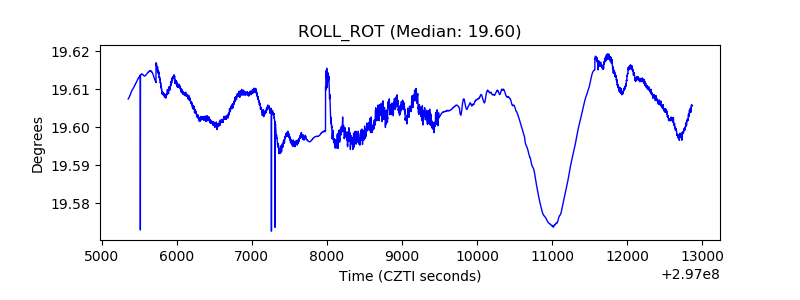 |
| _Roll_DEC | 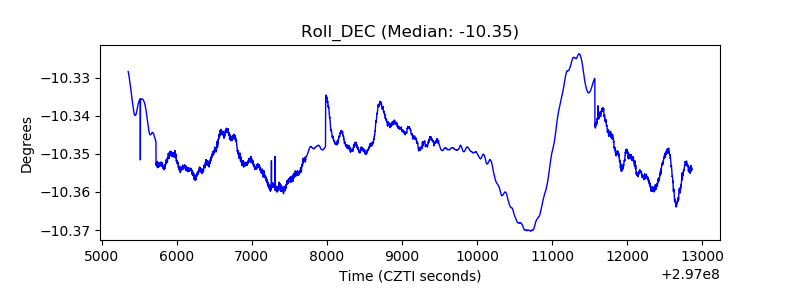 |
| _Roll_RA | 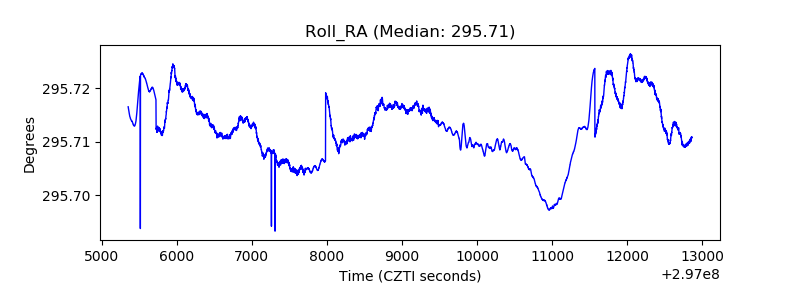 |
| Veto Counter | 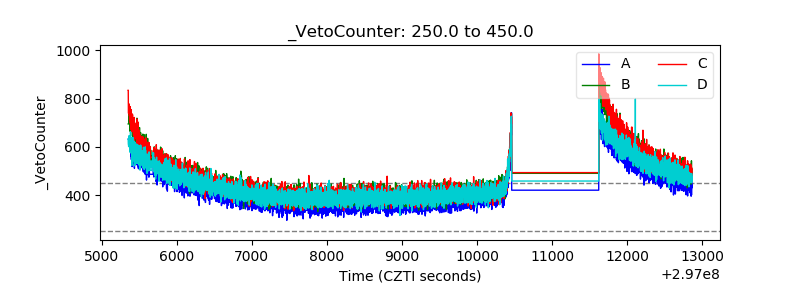 |