| Param | Original file | Final file |
|---|---|---|
| Filename | modeM0/AS1T03_118T01_9000002962_19857cztM0_level2.evt | modeM0/AS1T03_118T01_9000002962_19857cztM0_level2_quad_clean.evt |
| Size (bytes) | 1,215,043,200 | 142,502,400 |
| Size | 1.1 GB | 135.9 MB |
| Events in quadrant A | 18,989,756 | 650,850 |
| Events in quadrant B | 5,361,182 | 1,023,931 |
| Events in quadrant C | 5,298,401 | 974,276 |
| Events in quadrant D | 6,449,326 | 947,132 |
| Mode SS | |||
|---|---|---|---|
| Quadrant | BADHDUFLAG | Total packets | Discarded packets |
| A | 0 | 212 | 0 |
| B | 0 | 212 | 0 |
| C | 0 | 212 | 0 |
| D | 0 | 212 | 0 |
| Mode M9 | |||
|---|---|---|---|
| Quadrant | BADHDUFLAG | Total packets | Discarded packets |
| A | 0 | 24 | 0 |
| B | 0 | 24 | 0 |
| C | 0 | 24 | 0 |
| D | 0 | 24 | 0 |
| Mode M0 | |||
|---|---|---|---|
| Quadrant | BADHDUFLAG | Total packets | Discarded packets |
| A | 0 | 63521 | 2 |
| B | 0 | 22557 | 3 |
| C | 0 | 22192 | 2 |
| D | 0 | 26176 | 2 |
| Quadrant | Total seconds | Saturated seconds | Saturation percentage |
|---|---|---|---|
| A | 10360 | 6200 | 59.845560% |
| B | 10360 | 130 | 1.254826% |
| C | 10360 | 130 | 1.254826% |
| D | 10360 | 210 | 2.027027% |
Noise dominated data is calculated using 1-second bins in cleaned event files. If a bin has >2000 counts, and if more than 50% of those come from <1% of pixels, then it is considered to be noise-dominated and hence unusable.
| Quadrant | # 1 sec bins | Bins with >0 counts | Bins with >2000 counts | High rate bins dominated by noise | Noise dominated (total time) | Noise dominated (detector-on time) | Marked lightcurve |
|---|---|---|---|---|---|---|---|
| A | 12735 | 10360 | 5356 | 5356 | 42.06% | 51.70% | 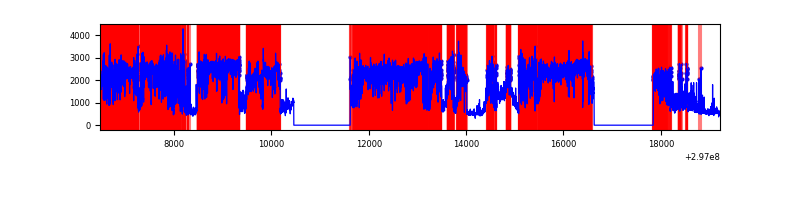 |
| B | 12735 | 10360 | 16 | 16 | 0.13% | 0.15% | 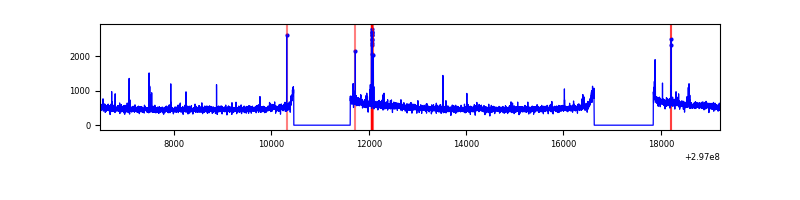 |
| C | 12735 | 10360 | 0 | 0 | 0.00% | 0.00% | 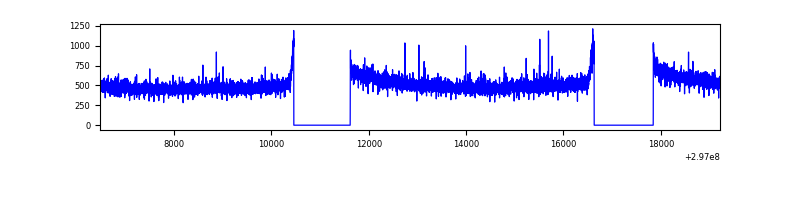 |
| D | 12735 | 10361 | 126 | 126 | 0.99% | 1.22% | 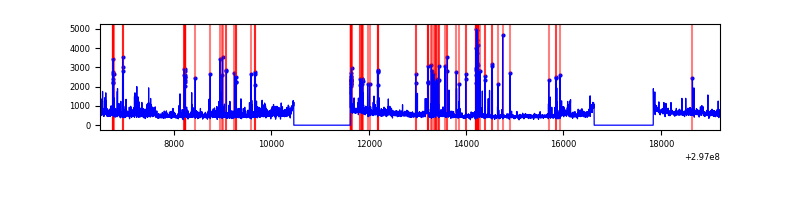 |
Top three noisy pixels from each quadrant. If the there are fewer than three noisy pixels in the level2.evt file, extra rows are filled as -1
| Pixel properties | Quadrant properties | ||||||
|---|---|---|---|---|---|---|---|
| Quadrant | DetID | PixID | Counts | Sigma | Mean | Median | Sigma |
| A | 14 | 238 | 14748596 | 82270.9 | 903 | 886 | 179.3 |
| A | 14 | 254 | 758969 | 4229.01 | 903 | 886 | 179.3 |
| A | 5 | 16 | 10865 | 55.67 | 903 | 886 | 179.3 |
| B | 3 | 64 | 61436 | 241.8 | 1330 | 1297 | 248.7 |
| B | 12 | 111 | 29510 | 113.44 | 1330 | 1297 | 248.7 |
| B | 0 | 214 | 29445 | 113.18 | 1330 | 1297 | 248.7 |
| C | 14 | 238 | 199498 | 661.64 | 1290 | 1302 | 299.6 |
| C | 9 | 221 | 59042 | 192.75 | 1290 | 1302 | 299.6 |
| C | 3 | 233 | 10561 | 30.91 | 1290 | 1302 | 299.6 |
| D | 1 | 52 | 730410 | 2324.12 | 1294 | 1258 | 313.7 |
| D | 2 | 184 | 690366 | 2196.48 | 1294 | 1258 | 313.7 |
| D | 12 | 218 | 56323 | 175.52 | 1294 | 1258 | 313.7 |
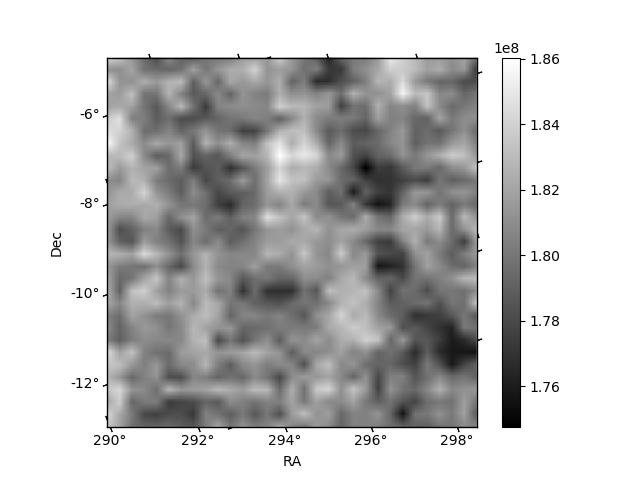
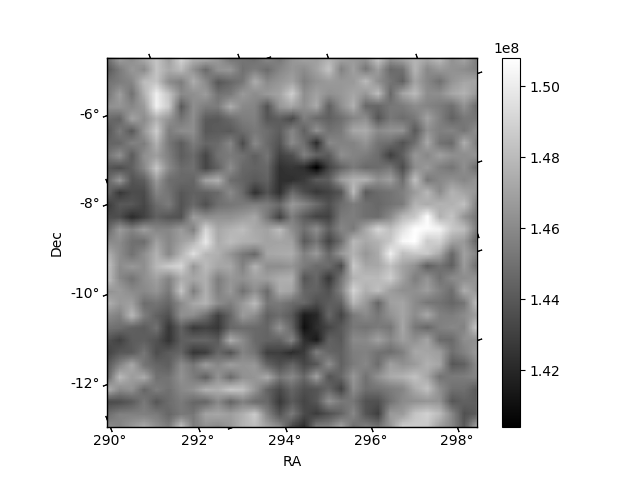
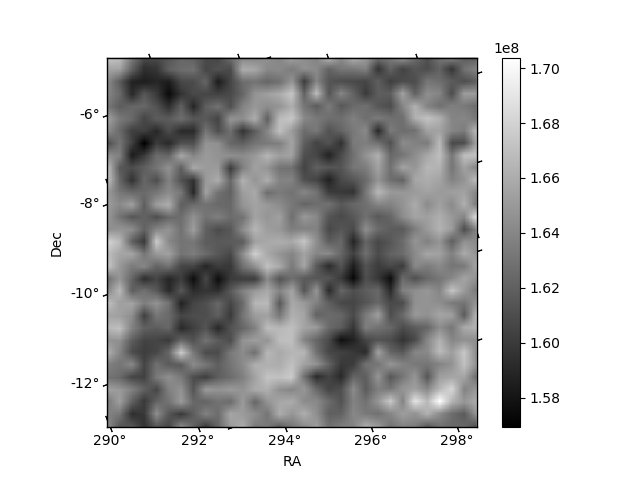
Histogram calculated using DETX and DETY for each event in the final _common_clean file
| Quadrant A | 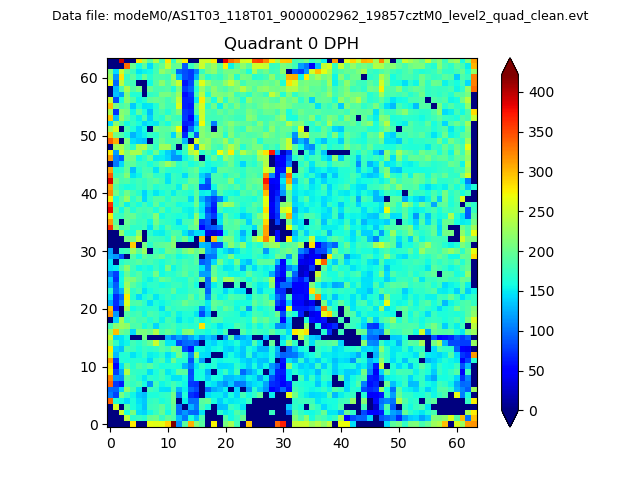 |
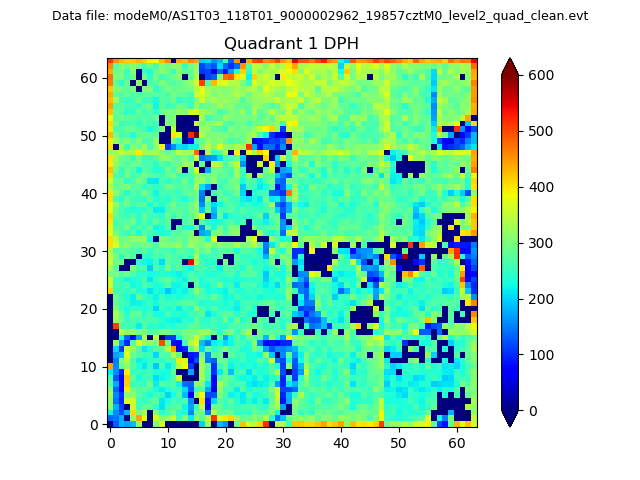 |
Quadrant B |
|---|---|---|---|
| Quadrant D | 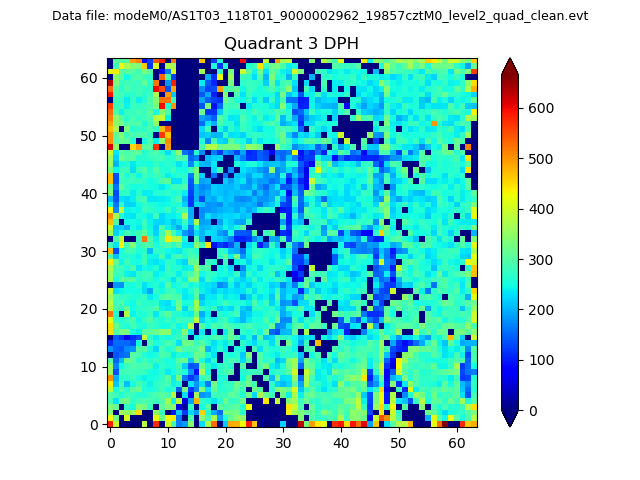 |
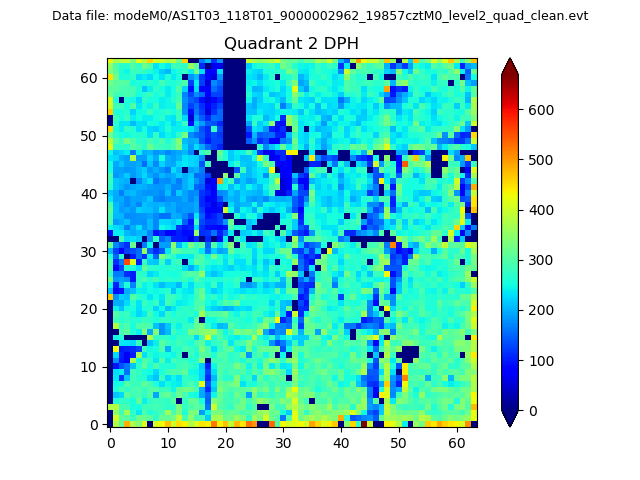 |
Quadrant C |
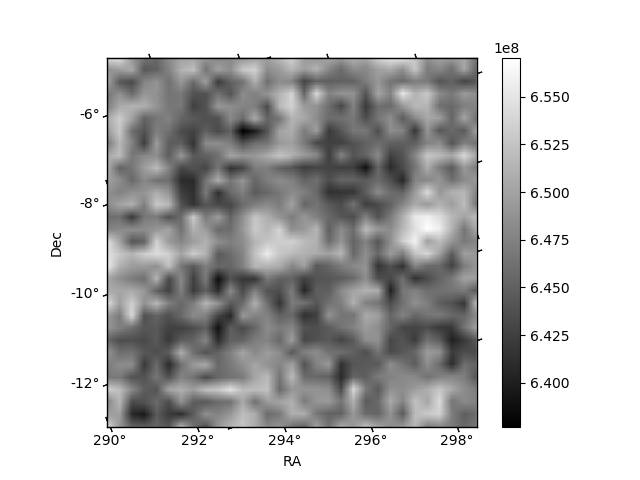
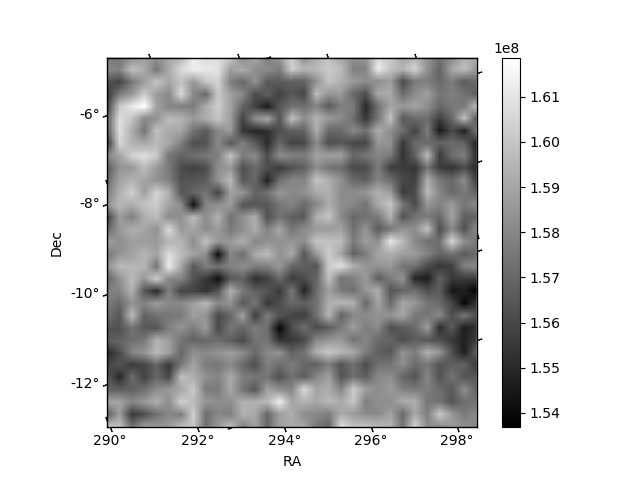
| Plot type | Count rate plots | Images |
|---|---|---|
| Comparison with Poisson distribution Blue bars denote a histogram of data divided into 1 sec bins. Red curve is a Poisson curve with rate = median count rate of data. |
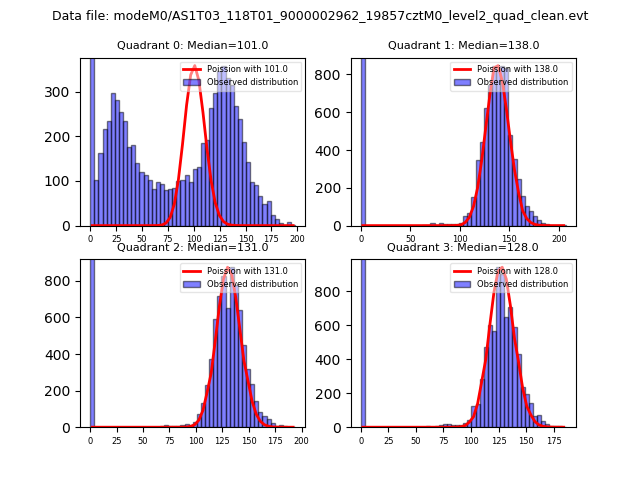 |
 |
| Quadrant-wise count rates Data is divided into 100 sec bins |
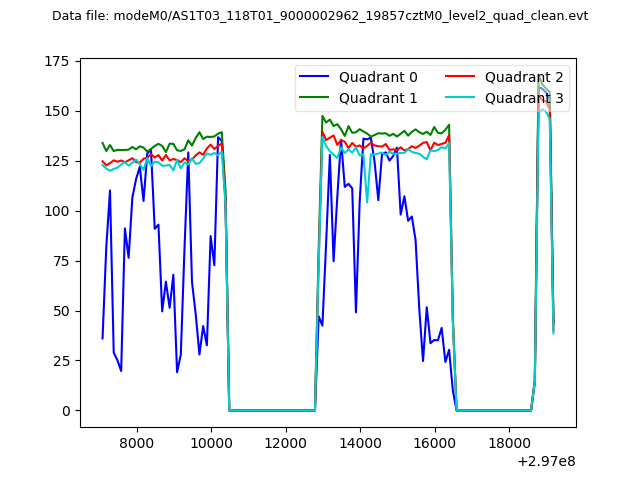 |
|
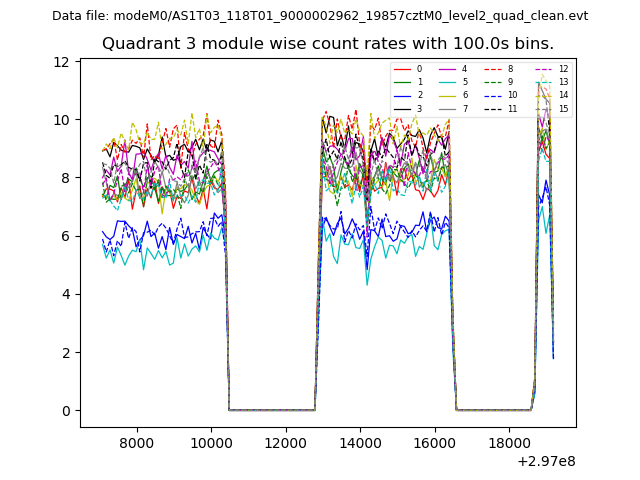
| Module-wise count rates for Quadrant A Data is divided into 100 sec bins |
 |
 |
| Module-wise count rates for Quadrant B Data is divided into 100 sec bins |
 |
 |
| Module-wise count rates for Quadrant C Data is divided into 100 sec bins |
 |
 |
| Module-wise count rates for Quadrant D Data is divided into 100 sec bins |
 |
 |
| Parameter | Plot |
|---|---|
| CZT HV Monitor |  |
| D_VDD | 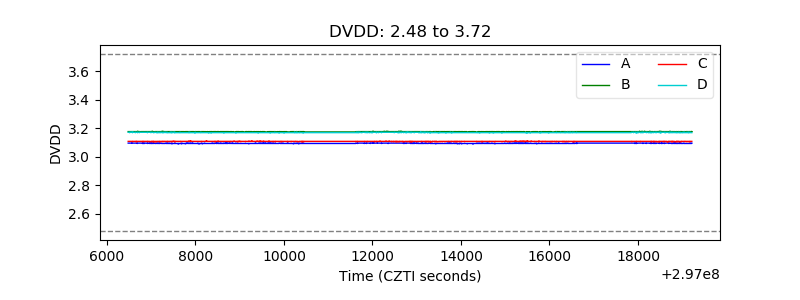 |
| Temperature 1 | 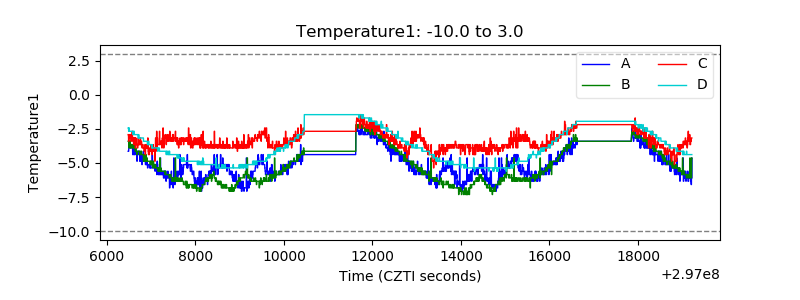 |
| Veto HV Monitor | 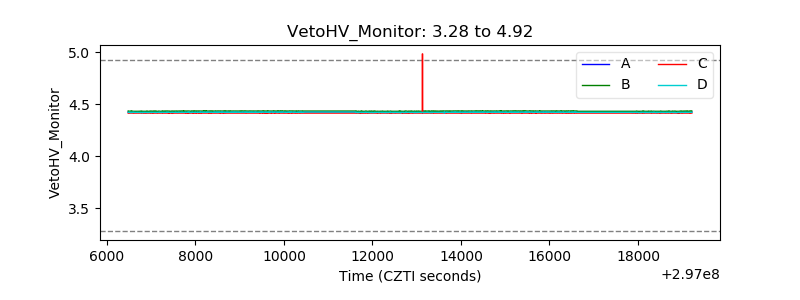 |
| Veto LLD | 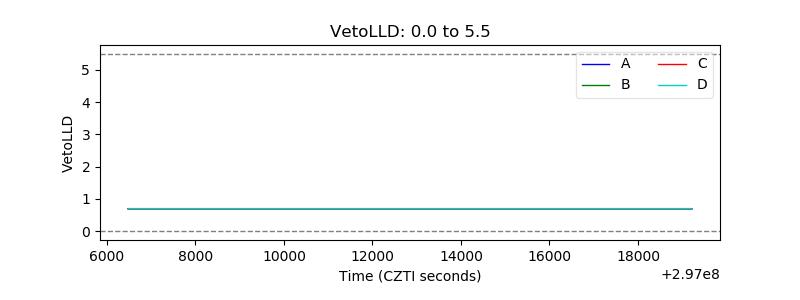 |
| Alpha Counter | 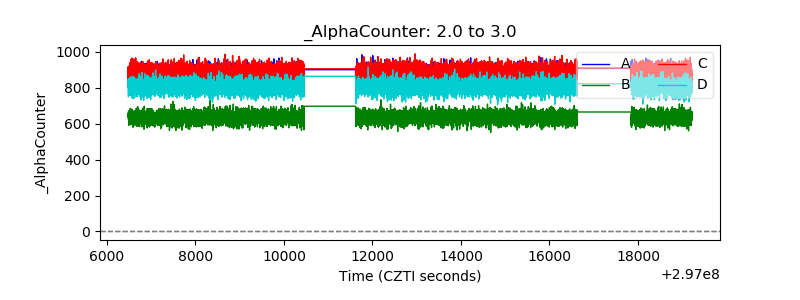 |
| _CPM_Rate | 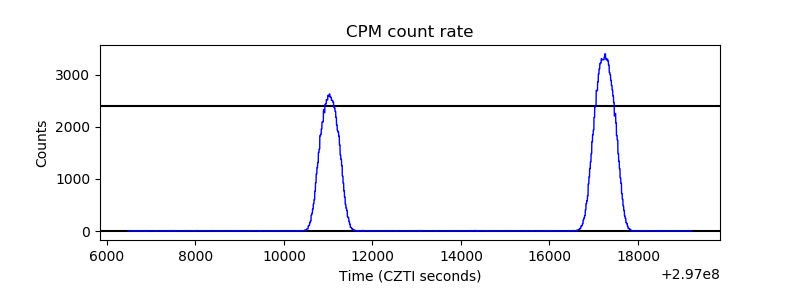 |
| CZT Counter | 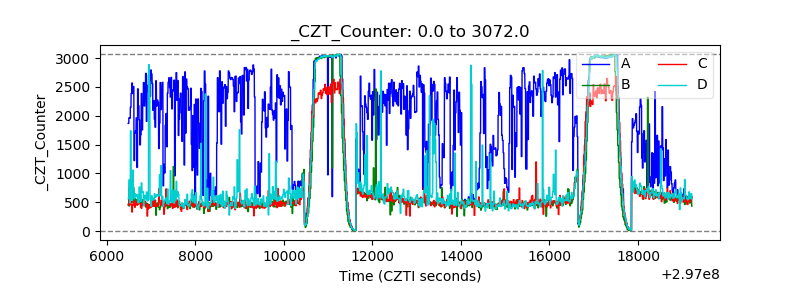 |
| +2.5 Volts monitor | 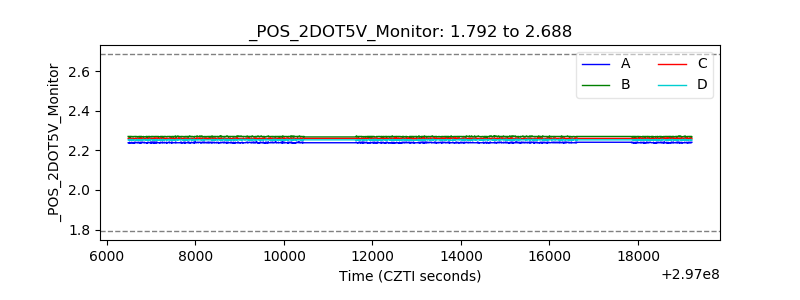 |
| +5 Volts monitor |  |
| _ROLL_ROT | 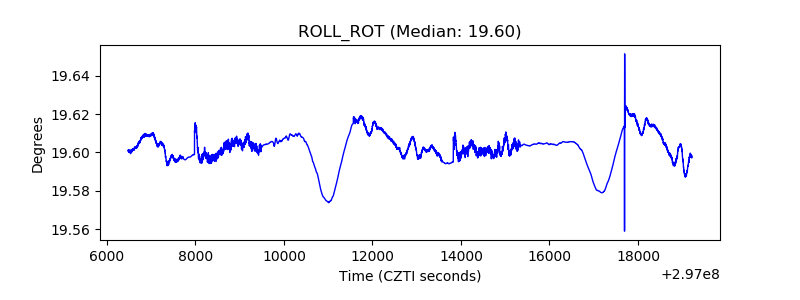 |
| _Roll_DEC | 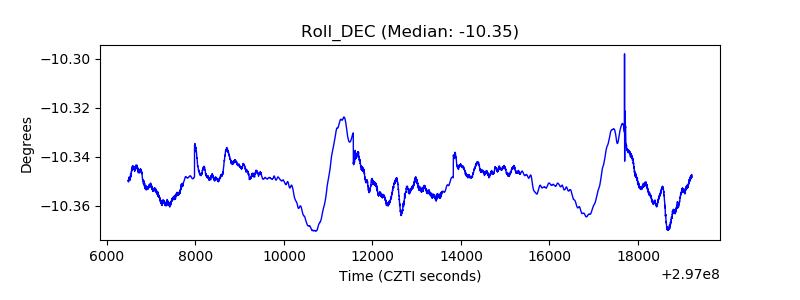 |
| _Roll_RA | 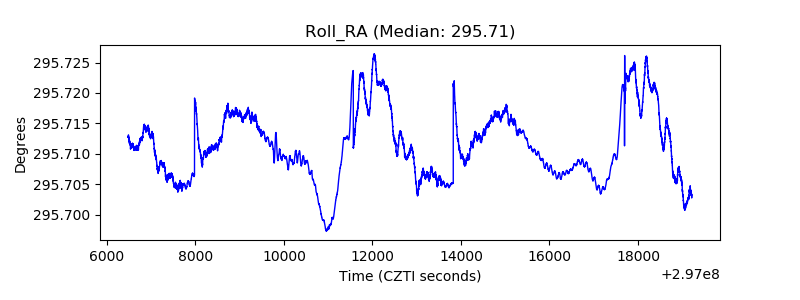 |
| Veto Counter |  |