| Param | Original file | Final file |
|---|---|---|
| Filename | modeM0/AS1T03_118T01_9000002962_19858cztM0_level2.evt | modeM0/AS1T03_118T01_9000002962_19858cztM0_level2_quad_clean.evt |
| Size (bytes) | 598,507,200 | 95,224,320 |
| Size | 570.8 MB | 90.8 MB |
| Events in quadrant A | 6,803,844 | 596,787 |
| Events in quadrant B | 3,440,466 | 643,698 |
| Events in quadrant C | 3,705,514 | 612,430 |
| Events in quadrant D | 3,753,798 | 595,575 |
| Mode SS | |||
|---|---|---|---|
| Quadrant | BADHDUFLAG | Total packets | Discarded packets |
| A | 0 | 130 | 0 |
| B | 0 | 130 | 0 |
| C | 0 | 130 | 0 |
| D | 0 | 130 | 0 |
| Mode M9 | |||
|---|---|---|---|
| Quadrant | BADHDUFLAG | Total packets | Discarded packets |
| A | 0 | 25 | 0 |
| B | 0 | 25 | 0 |
| C | 0 | 25 | 0 |
| D | 0 | 25 | 0 |
| Mode M0 | |||
|---|---|---|---|
| Quadrant | BADHDUFLAG | Total packets | Discarded packets |
| A | 0 | 24523 | 2 |
| B | 0 | 14191 | 2 |
| C | 0 | 14953 | 2 |
| D | 0 | 15195 | 2 |
| Quadrant | Total seconds | Saturated seconds | Saturation percentage |
|---|---|---|---|
| A | 6228 | 1088 | 17.469493% |
| B | 6229 | 137 | 2.199390% |
| C | 6229 | 156 | 2.504415% |
| D | 6229 | 132 | 2.119120% |
Noise dominated data is calculated using 1-second bins in cleaned event files. If a bin has >2000 counts, and if more than 50% of those come from <1% of pixels, then it is considered to be noise-dominated and hence unusable.
| Quadrant | # 1 sec bins | Bins with >0 counts | Bins with >2000 counts | High rate bins dominated by noise | Noise dominated (total time) | Noise dominated (detector-on time) | Marked lightcurve |
|---|---|---|---|---|---|---|---|
| A | 8763 | 6228 | 774 | 774 | 8.83% | 12.43% | 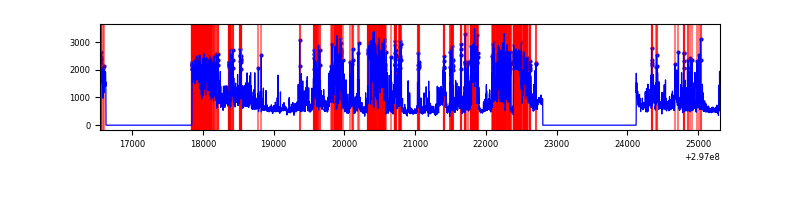 |
| B | 8764 | 6229 | 6 | 6 | 0.07% | 0.10% | 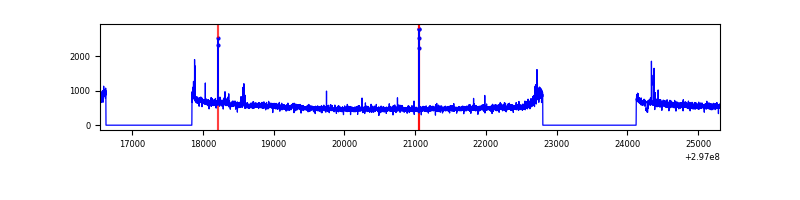 |
| C | 8764 | 6229 | 5 | 5 | 0.06% | 0.08% | 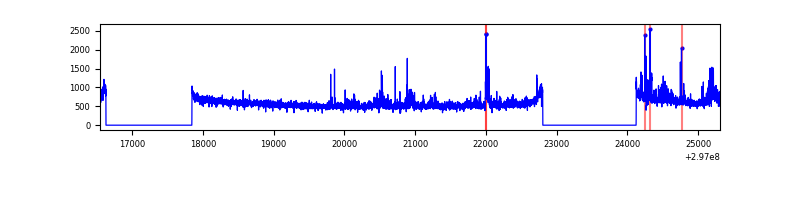 |
| D | 8764 | 6229 | 43 | 43 | 0.49% | 0.69% | 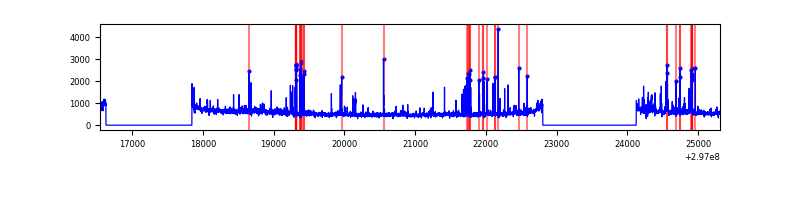 |
Top three noisy pixels from each quadrant. If the there are fewer than three noisy pixels in the level2.evt file, extra rows are filled as -1
| Pixel properties | Quadrant properties | ||||||
|---|---|---|---|---|---|---|---|
| Quadrant | DetID | PixID | Counts | Sigma | Mean | Median | Sigma |
| A | 14 | 238 | 3681992 | 22792.84 | 805 | 789 | 161.5 |
| A | 14 | 254 | 29767 | 179.42 | 805 | 789 | 161.5 |
| A | 0 | 226 | 6737 | 36.83 | 805 | 789 | 161.5 |
| B | 4 | 216 | 23687 | 141.79 | 860 | 842 | 161.1 |
| B | 12 | 111 | 18830 | 111.64 | 860 | 842 | 161.1 |
| B | 11 | 111 | 16568 | 97.6 | 860 | 842 | 161.1 |
| C | 9 | 221 | 305376 | 1570.11 | 836 | 845 | 194.0 |
| C | 14 | 238 | 131048 | 671.3 | 836 | 845 | 194.0 |
| C | 3 | 233 | 11017 | 52.45 | 836 | 845 | 194.0 |
| D | 1 | 52 | 384536 | 1893.83 | 840 | 818 | 202.6 |
| D | 2 | 184 | 130893 | 641.98 | 840 | 818 | 202.6 |
| D | 13 | 138 | 56308 | 273.87 | 840 | 818 | 202.6 |
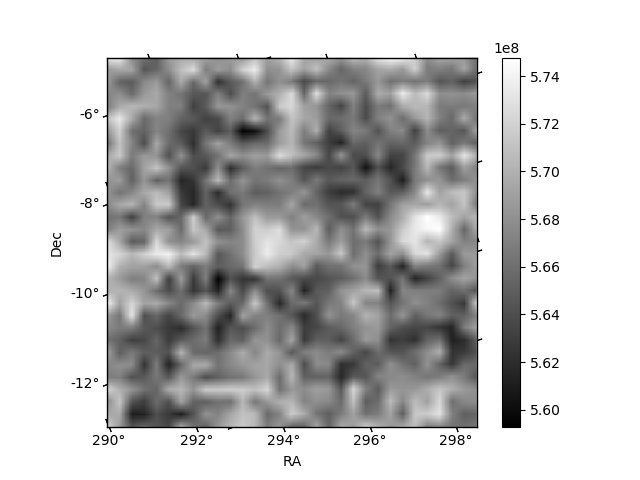
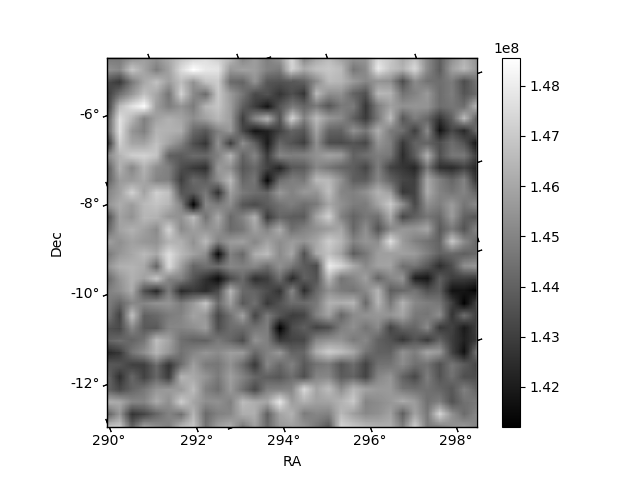
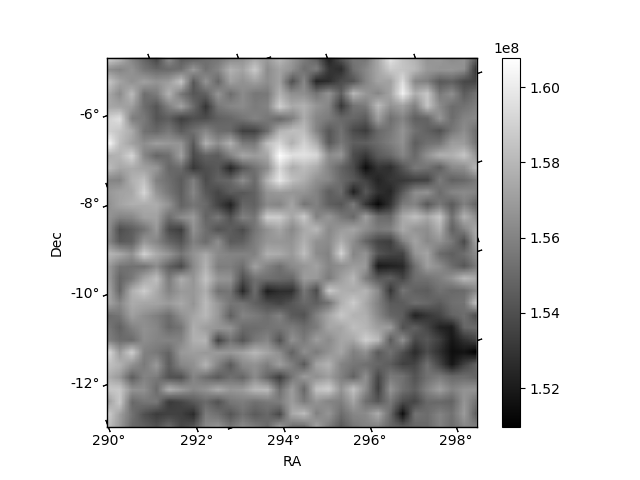
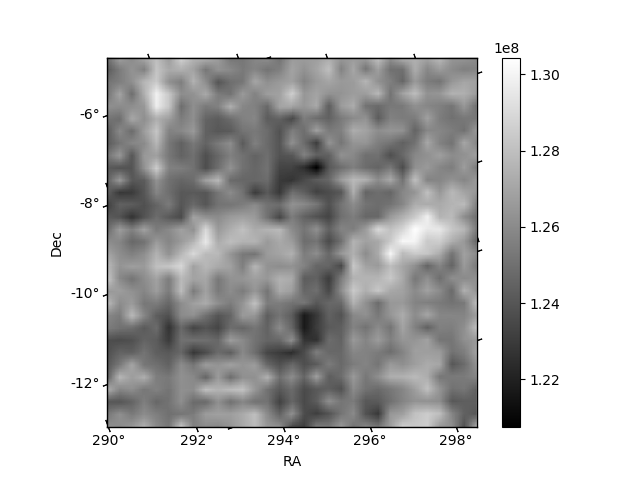
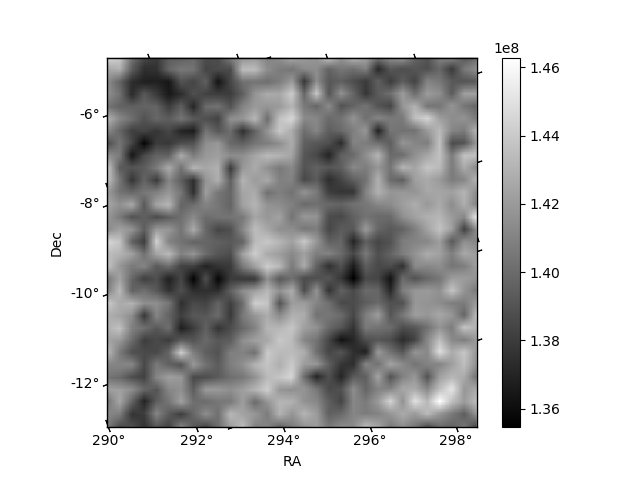
Histogram calculated using DETX and DETY for each event in the final _common_clean file
| Quadrant A | 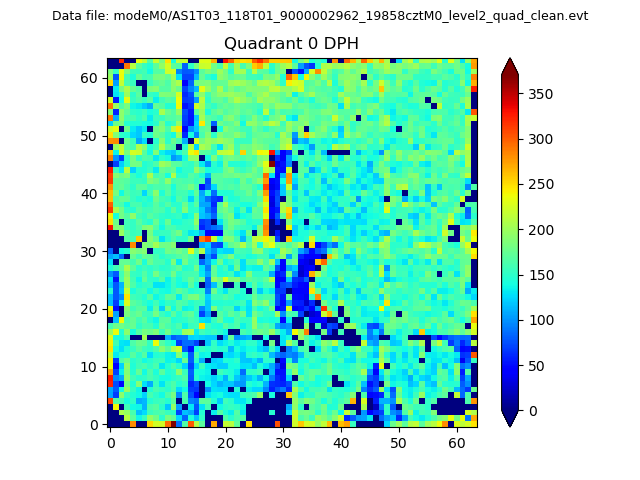 |
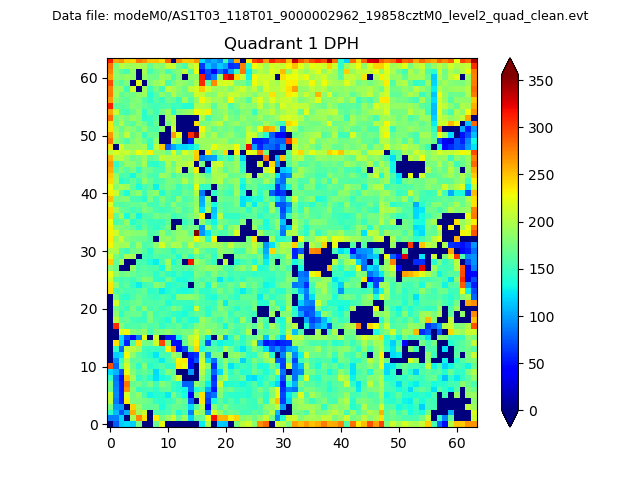 |
Quadrant B |
|---|---|---|---|
| Quadrant D | 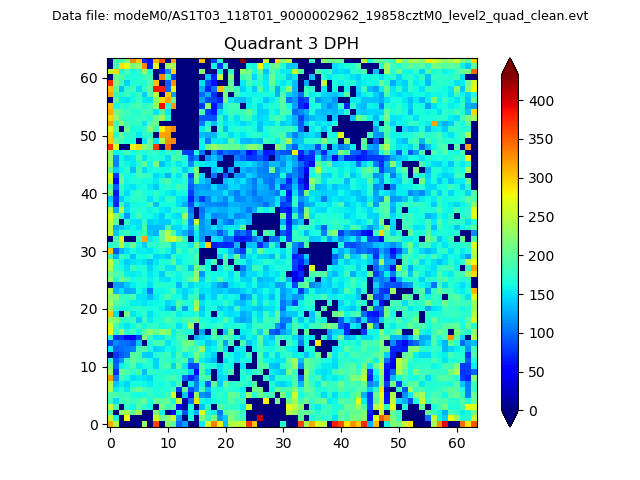 |
 |
Quadrant C |
| Plot type | Count rate plots | Images |
|---|---|---|
| Comparison with Poisson distribution Blue bars denote a histogram of data divided into 1 sec bins. Red curve is a Poisson curve with rate = median count rate of data. |
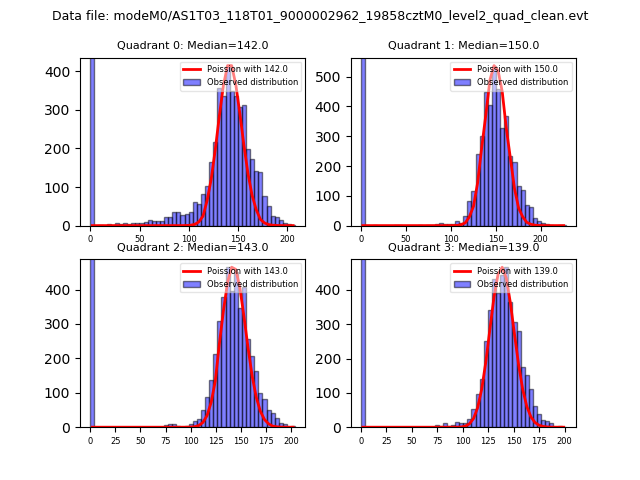 |
 |
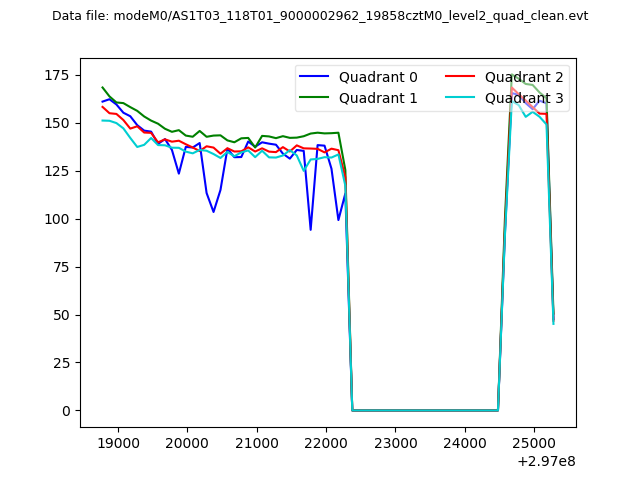
| Quadrant-wise count rates Data is divided into 100 sec bins |
 |
|
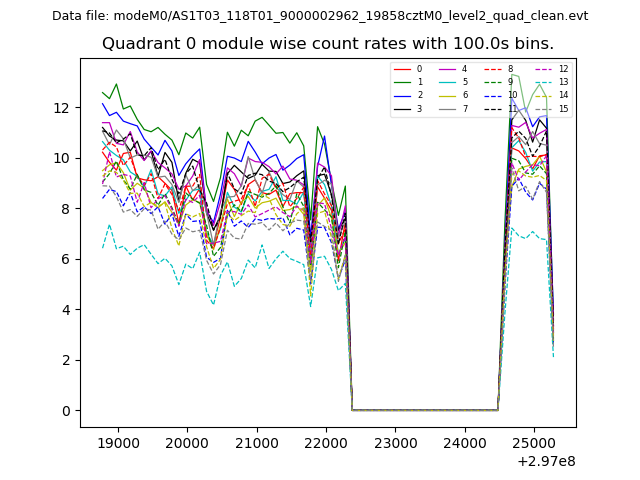
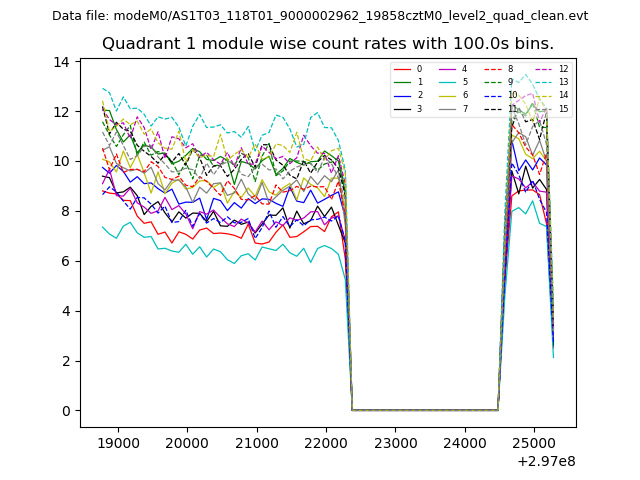
| Module-wise count rates for Quadrant A Data is divided into 100 sec bins |
 |
 |
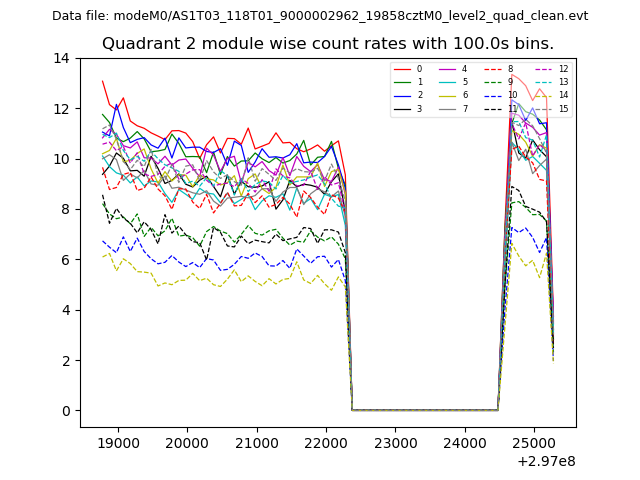
| Module-wise count rates for Quadrant B Data is divided into 100 sec bins |
 |
 |
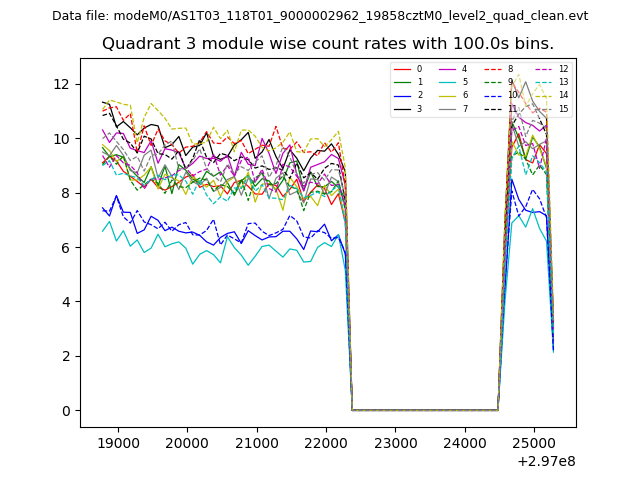
| Module-wise count rates for Quadrant C Data is divided into 100 sec bins |
 |
 |
| Module-wise count rates for Quadrant D Data is divided into 100 sec bins |
 |
 |
| Parameter | Plot |
|---|---|
| CZT HV Monitor | 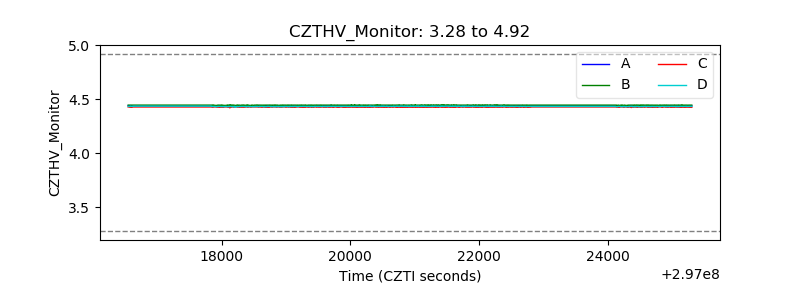 |
| D_VDD | 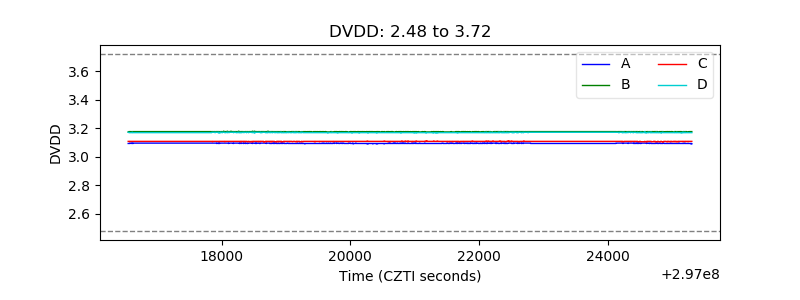 |
| Temperature 1 | 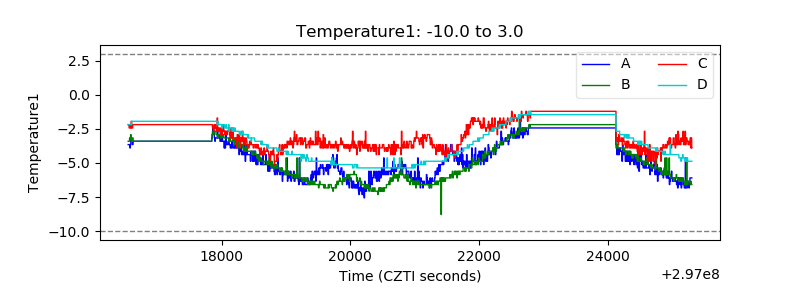 |
| Veto HV Monitor | 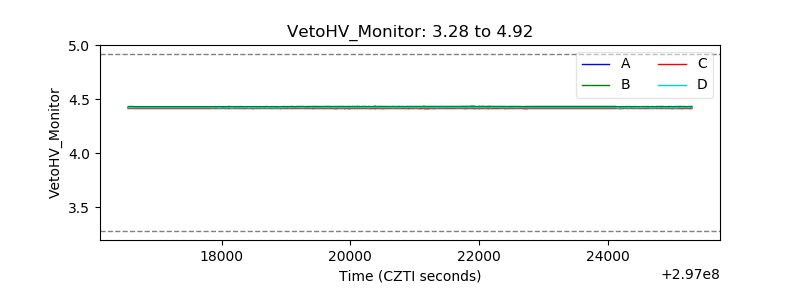 |
| Veto LLD | 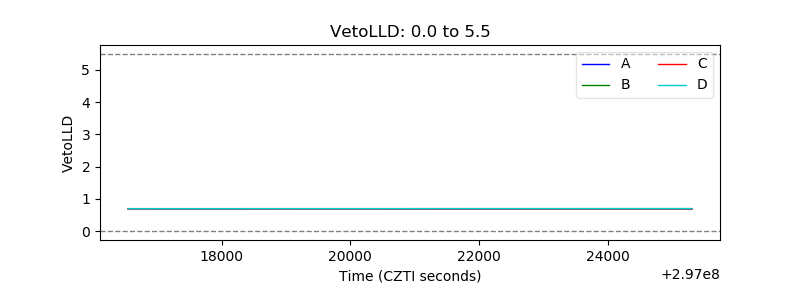 |
| Alpha Counter | 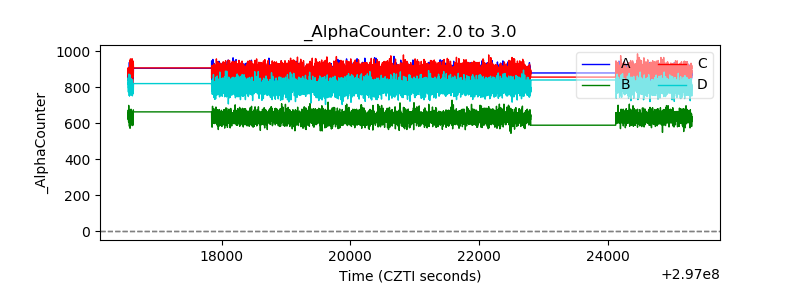 |
| _CPM_Rate | 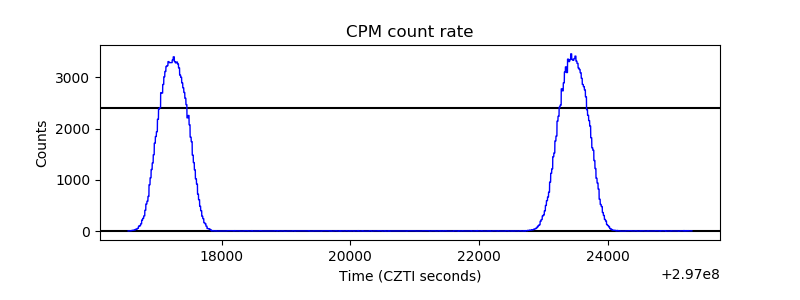 |
| CZT Counter | 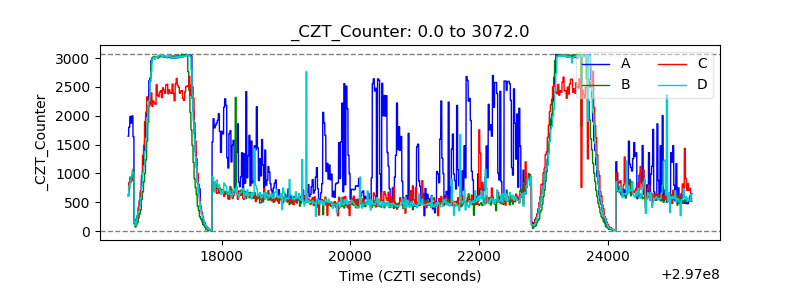 |
| +2.5 Volts monitor |  |
| +5 Volts monitor |  |
| _ROLL_ROT | 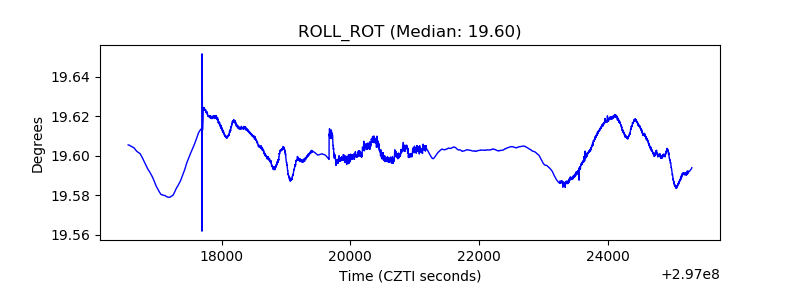 |
| _Roll_DEC | 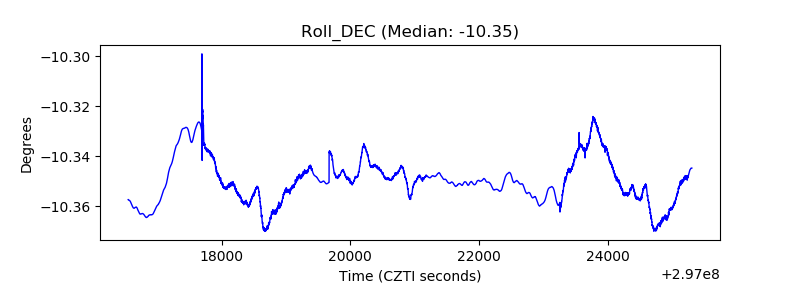 |
| _Roll_RA | 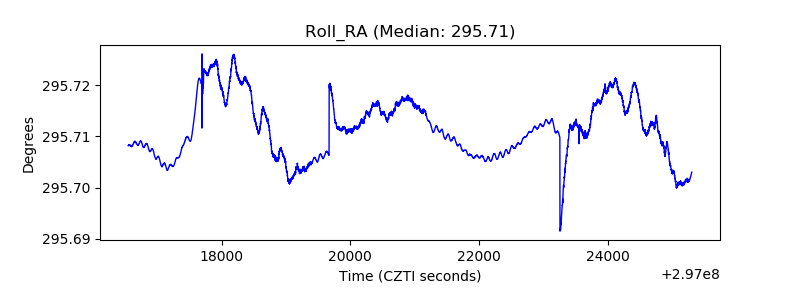 |
| Veto Counter | 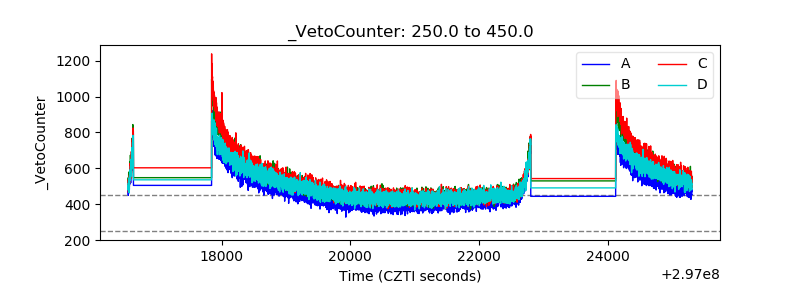 |