| Param | Original file | Final file |
|---|---|---|
| Filename | modeM0/AS1T03_118T01_9000002962_19860cztM0_level2.evt | modeM0/AS1T03_118T01_9000002962_19860cztM0_level2_quad_clean.evt |
| Size (bytes) | 539,412,480 | 106,660,800 |
| Size | 514.4 MB | 101.7 MB |
| Events in quadrant A | 4,572,013 | 689,338 |
| Events in quadrant B | 3,547,192 | 719,429 |
| Events in quadrant C | 4,076,483 | 687,028 |
| Events in quadrant D | 3,684,554 | 665,727 |
| Mode SS | |||
|---|---|---|---|
| Quadrant | BADHDUFLAG | Total packets | Discarded packets |
| A | 0 | 140 | 0 |
| B | 0 | 140 | 0 |
| C | 0 | 140 | 0 |
| D | 0 | 140 | 0 |
| Mode M9 | |||
|---|---|---|---|
| Quadrant | BADHDUFLAG | Total packets | Discarded packets |
| A | 0 | 26 | 0 |
| B | 0 | 26 | 0 |
| C | 0 | 26 | 0 |
| D | 0 | 26 | 0 |
| Mode M0 | |||
|---|---|---|---|
| Quadrant | BADHDUFLAG | Total packets | Discarded packets |
| A | 0 | 17873 | 2 |
| B | 0 | 14667 | 2 |
| C | 0 | 16392 | 2 |
| D | 0 | 15114 | 2 |
| Quadrant | Total seconds | Saturated seconds | Saturation percentage |
|---|---|---|---|
| A | 6718 | 307 | 4.569812% |
| B | 6718 | 84 | 1.250372% |
| C | 6719 | 145 | 2.158059% |
| D | 6719 | 125 | 1.860396% |
Noise dominated data is calculated using 1-second bins in cleaned event files. If a bin has >2000 counts, and if more than 50% of those come from <1% of pixels, then it is considered to be noise-dominated and hence unusable.
| Quadrant | # 1 sec bins | Bins with >0 counts | Bins with >2000 counts | High rate bins dominated by noise | Noise dominated (total time) | Noise dominated (detector-on time) | Marked lightcurve |
|---|---|---|---|---|---|---|---|
| A | 9373 | 6711 | 192 | 192 | 2.05% | 2.86% | 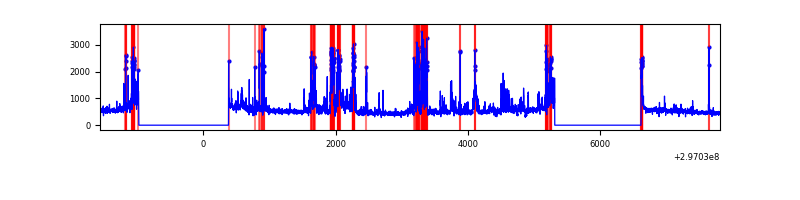 |
| B | 9373 | 6712 | 3 | 3 | 0.03% | 0.04% | 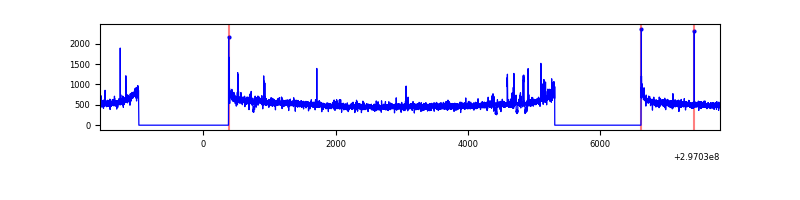 |
| C | 9374 | 6713 | 4 | 4 | 0.04% | 0.06% | 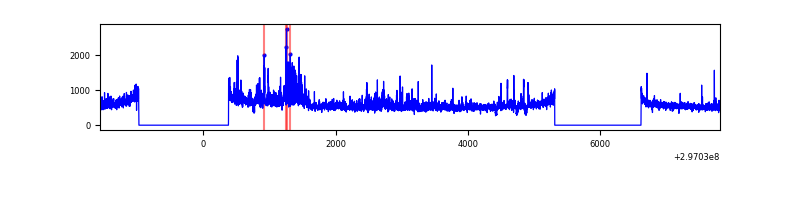 |
| D | 9374 | 6713 | 47 | 47 | 0.50% | 0.70% | 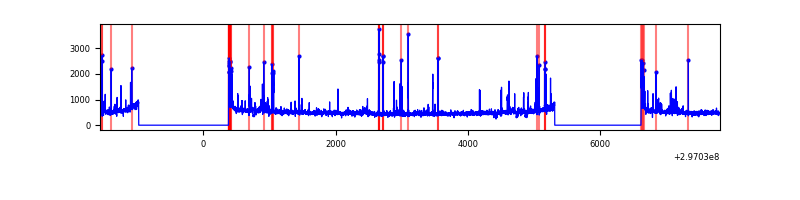 |
Top three noisy pixels from each quadrant. If the there are fewer than three noisy pixels in the level2.evt file, extra rows are filled as -1
| Pixel properties | Quadrant properties | ||||||
|---|---|---|---|---|---|---|---|
| Quadrant | DetID | PixID | Counts | Sigma | Mean | Median | Sigma |
| A | 14 | 238 | 1218466 | 6920.38 | 871 | 856 | 175.9 |
| A | 0 | 226 | 7190 | 36.0 | 871 | 856 | 175.9 |
| A | 3 | 137 | 6827 | 33.94 | 871 | 856 | 175.9 |
| B | 12 | 111 | 19868 | 113.16 | 887 | 863 | 167.9 |
| B | 11 | 111 | 17588 | 99.58 | 887 | 863 | 167.9 |
| B | 14 | 111 | 15734 | 88.55 | 887 | 863 | 167.9 |
| C | 9 | 221 | 565308 | 2790.2 | 865 | 873 | 202.3 |
| C | 14 | 238 | 133663 | 656.43 | 865 | 873 | 202.3 |
| C | 3 | 233 | 6167 | 26.17 | 865 | 873 | 202.3 |
| D | 1 | 52 | 257569 | 1234.99 | 866 | 844 | 207.9 |
| D | 12 | 218 | 110240 | 526.26 | 866 | 844 | 207.9 |
| D | 2 | 234 | 25829 | 120.19 | 866 | 844 | 207.9 |
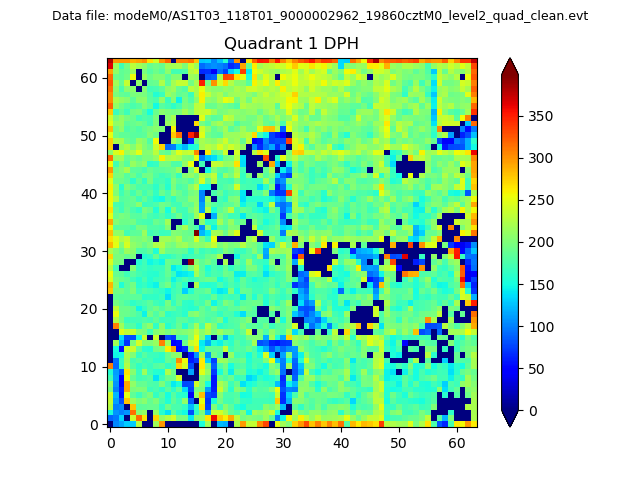
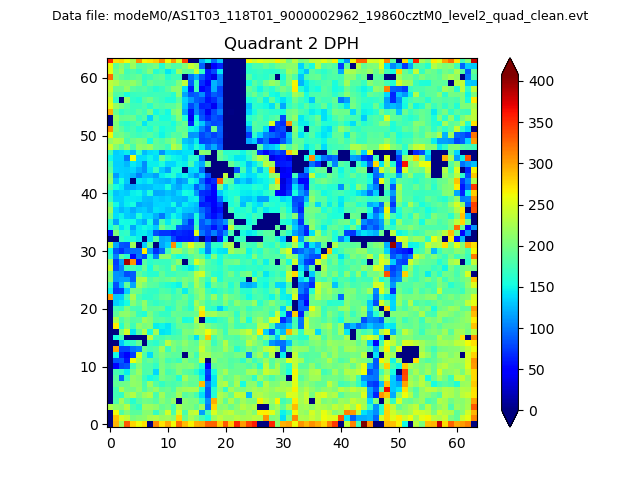
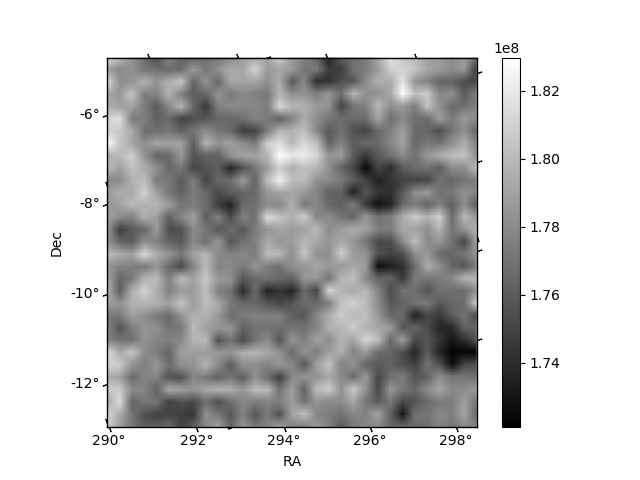
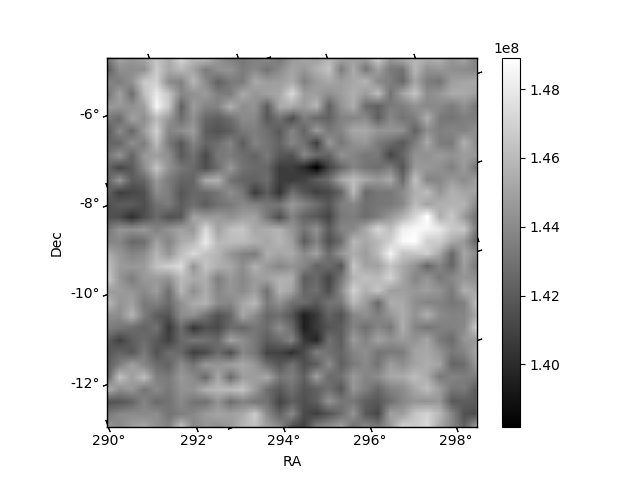
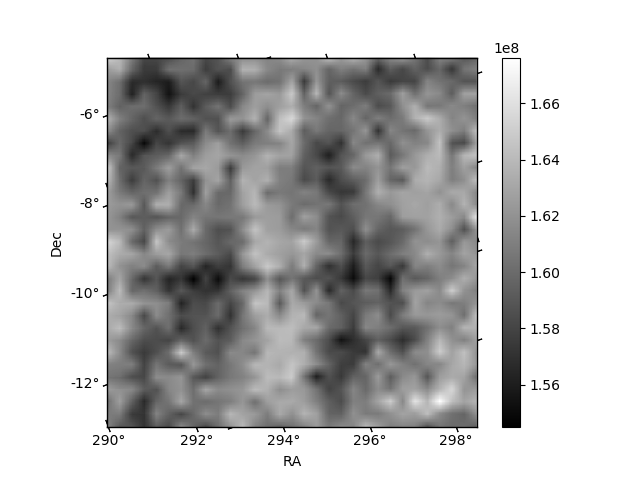
Histogram calculated using DETX and DETY for each event in the final _common_clean file
| Quadrant A |  |
 |
Quadrant B |
|---|---|---|---|
| Quadrant D |  |
 |
Quadrant C |
| Plot type | Count rate plots | Images |
|---|---|---|
| Comparison with Poisson distribution Blue bars denote a histogram of data divided into 1 sec bins. Red curve is a Poisson curve with rate = median count rate of data. |
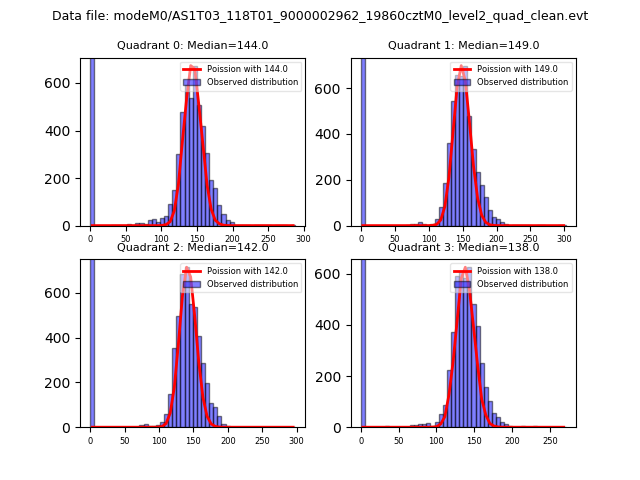 |
 |
| Quadrant-wise count rates Data is divided into 100 sec bins |
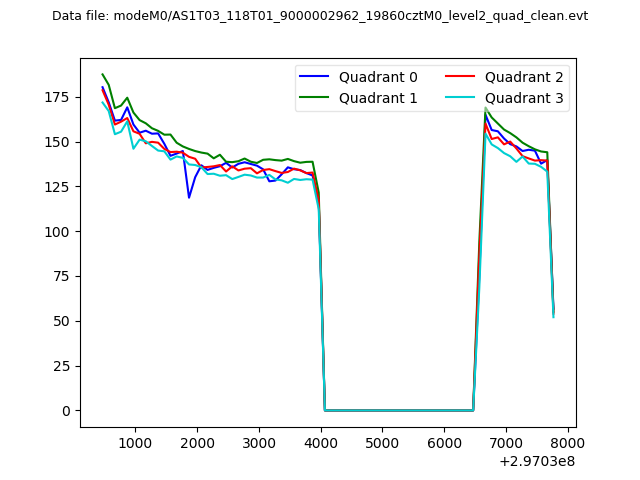 |
|
| Module-wise count rates for Quadrant A Data is divided into 100 sec bins |
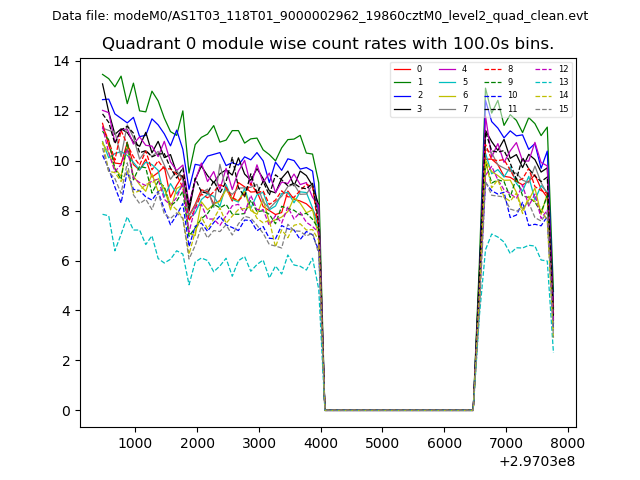 |
 |
| Module-wise count rates for Quadrant B Data is divided into 100 sec bins |
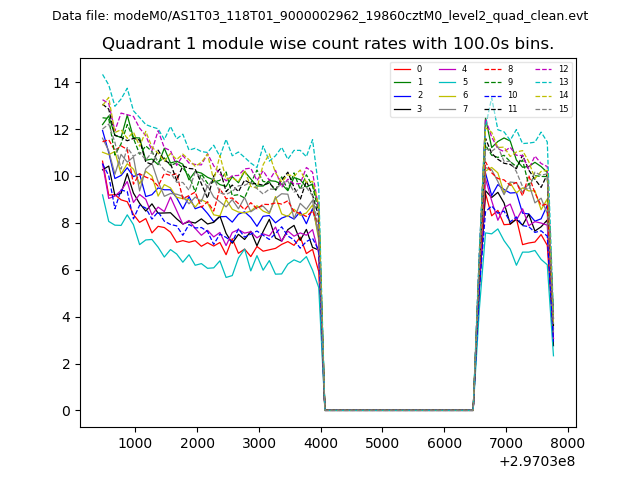 |
 |
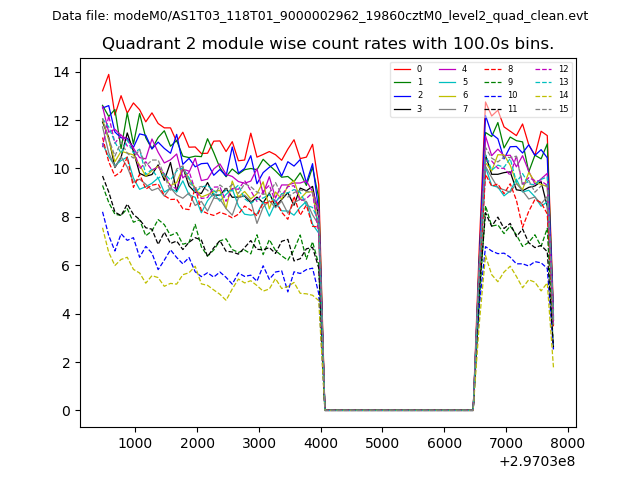
| Module-wise count rates for Quadrant C Data is divided into 100 sec bins |
 |
 |
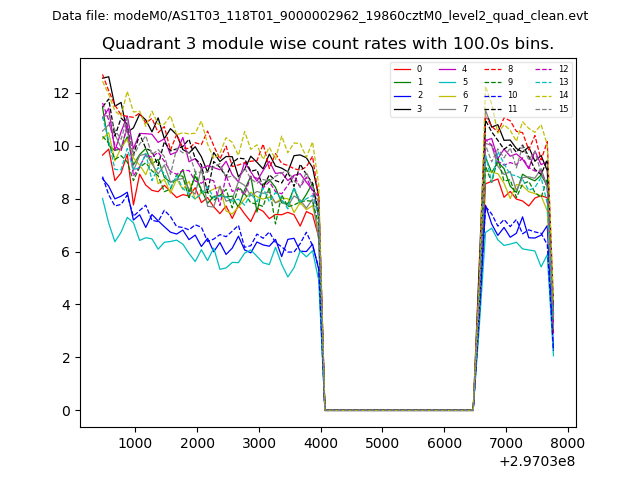
| Module-wise count rates for Quadrant D Data is divided into 100 sec bins |
 |
 |
| Parameter | Plot |
|---|---|
| CZT HV Monitor | 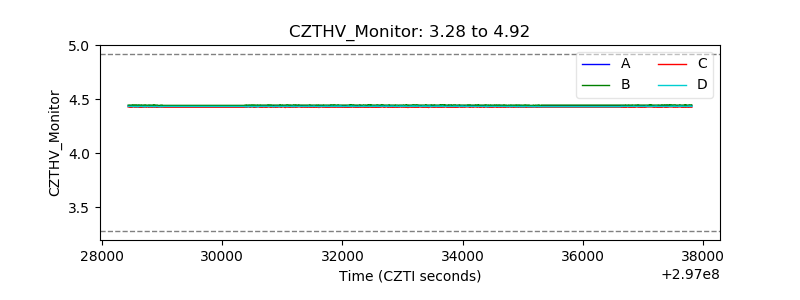 |
| D_VDD | 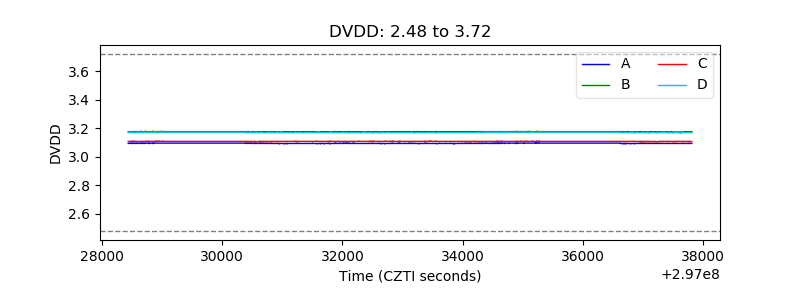 |
| Temperature 1 | 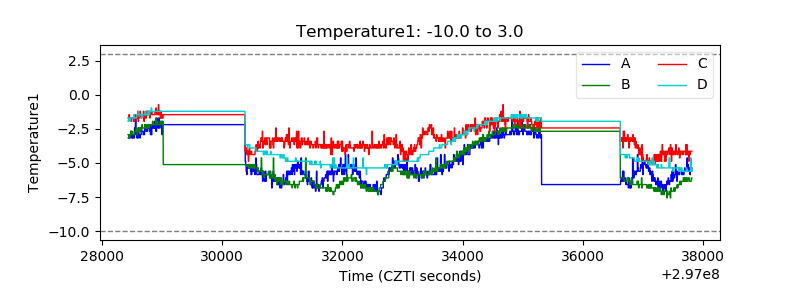 |
| Veto HV Monitor | 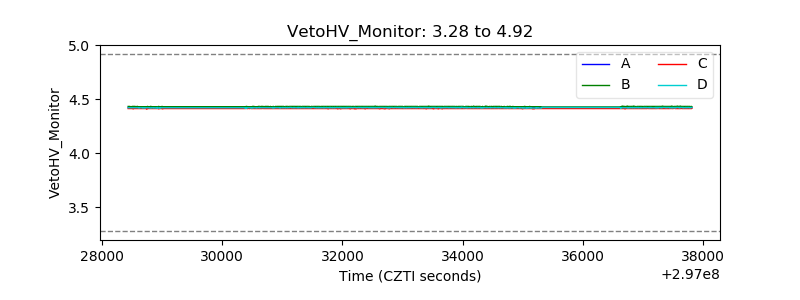 |
| Veto LLD | 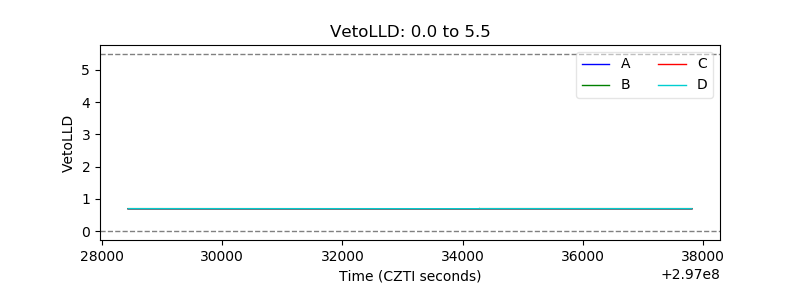 |
| Alpha Counter | 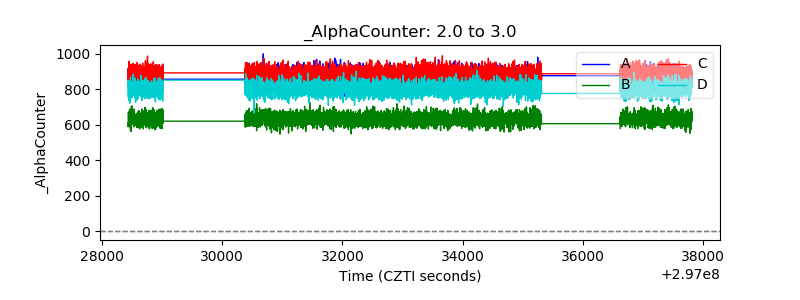 |
| _CPM_Rate | 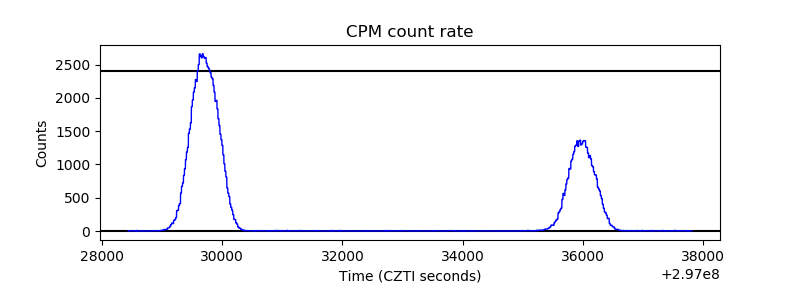 |
| CZT Counter | 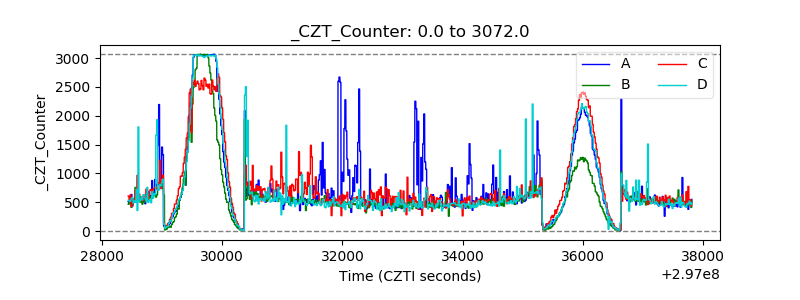 |
| +2.5 Volts monitor |  |
| +5 Volts monitor | 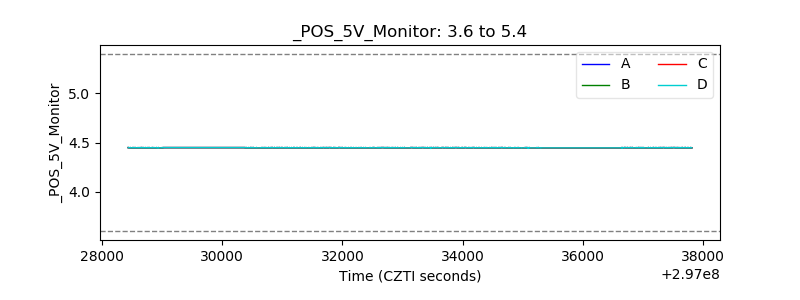 |
| _ROLL_ROT | 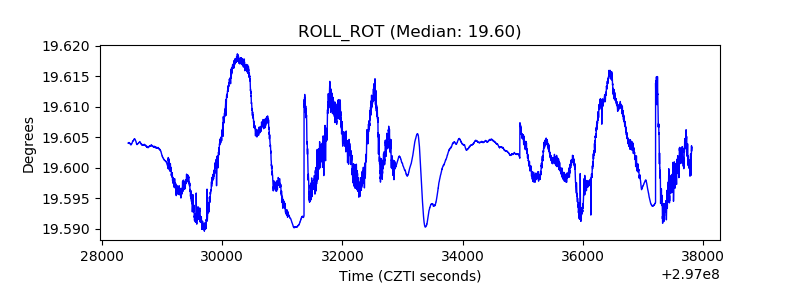 |
| _Roll_DEC | 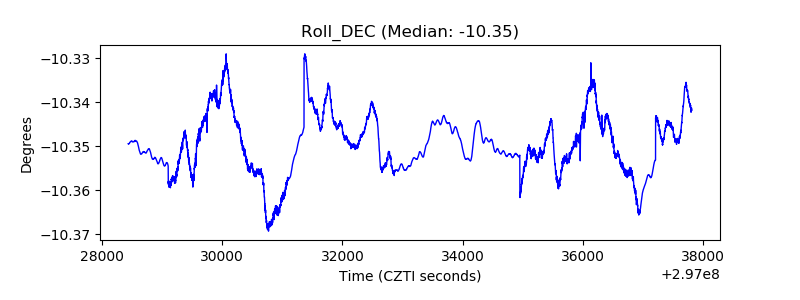 |
| _Roll_RA | 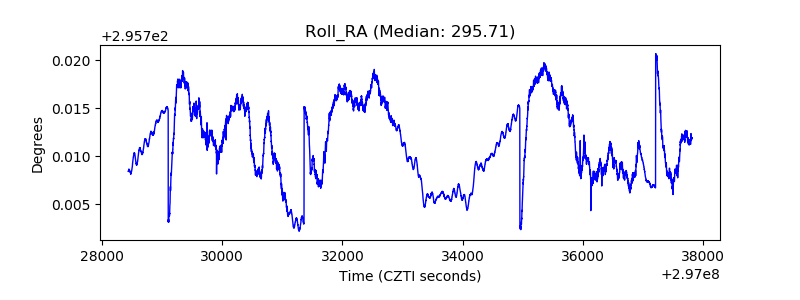 |
| Veto Counter | 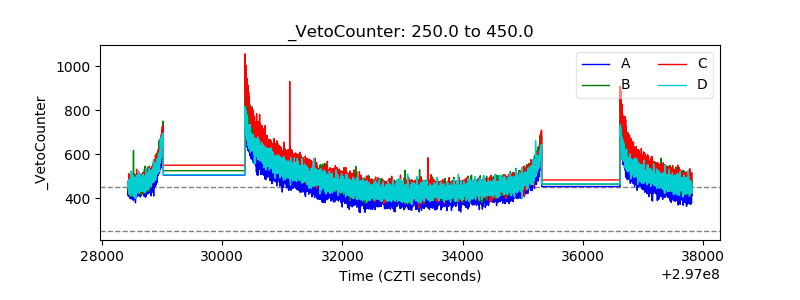 |