| Param | Original file | Final file |
|---|---|---|
| Filename | modeM0/AS1T03_118T01_9000002962_19864cztM0_level2.evt | modeM0/AS1T03_118T01_9000002962_19864cztM0_level2_quad_clean.evt |
| Size (bytes) | 983,704,320 | 179,838,720 |
| Size | 938.1 MB | 171.5 MB |
| Events in quadrant A | 7,168,264 | 1,147,064 |
| Events in quadrant B | 6,519,425 | 1,166,434 |
| Events in quadrant C | 7,767,866 | 1,109,362 |
| Events in quadrant D | 7,421,324 | 1,089,741 |
| Mode SS | |||
|---|---|---|---|
| Quadrant | BADHDUFLAG | Total packets | Discarded packets |
| A | 0 | 278 | 0 |
| B | 0 | 278 | 0 |
| C | 0 | 278 | 0 |
| D | 0 | 278 | 0 |
| Mode M9 | |||
|---|---|---|---|
| Quadrant | BADHDUFLAG | Total packets | Discarded packets |
| A | 0 | 5 | 0 |
| B | 0 | 5 | 0 |
| C | 0 | 5 | 0 |
| D | 0 | 5 | 0 |
| Mode M0 | |||
|---|---|---|---|
| Quadrant | BADHDUFLAG | Total packets | Discarded packets |
| A | 0 | 30092 | 2 |
| B | 0 | 28021 | 2 |
| C | 0 | 31725 | 2 |
| D | 0 | 31129 | 2 |
| Quadrant | Total seconds | Saturated seconds | Saturation percentage |
|---|---|---|---|
| A | 13512 | 379 | 2.804914% |
| B | 13512 | 275 | 2.035228% |
| C | 13512 | 445 | 3.293369% |
| D | 13513 | 423 | 3.130319% |
Noise dominated data is calculated using 1-second bins in cleaned event files. If a bin has >2000 counts, and if more than 50% of those come from <1% of pixels, then it is considered to be noise-dominated and hence unusable.
| Quadrant | # 1 sec bins | Bins with >0 counts | Bins with >2000 counts | High rate bins dominated by noise | Noise dominated (total time) | Noise dominated (detector-on time) | Marked lightcurve |
|---|---|---|---|---|---|---|---|
| A | 14027 | 13513 | 112 | 112 | 0.80% | 0.83% | 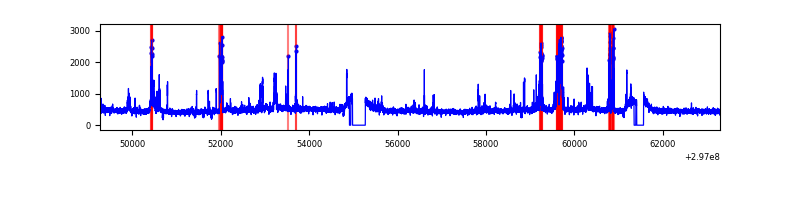 |
| B | 14027 | 13514 | 6 | 6 | 0.04% | 0.04% | 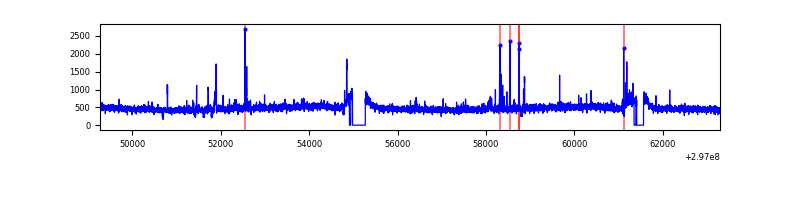 |
| C | 14027 | 13513 | 55 | 55 | 0.39% | 0.41% | 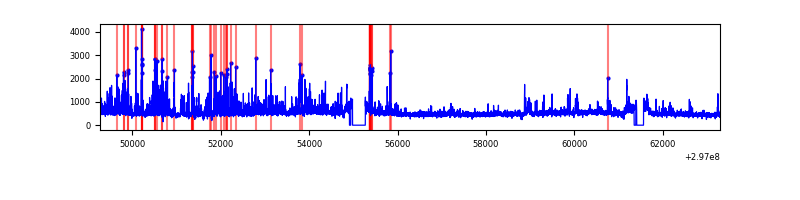 |
| D | 14028 | 13514 | 167 | 167 | 1.19% | 1.24% | 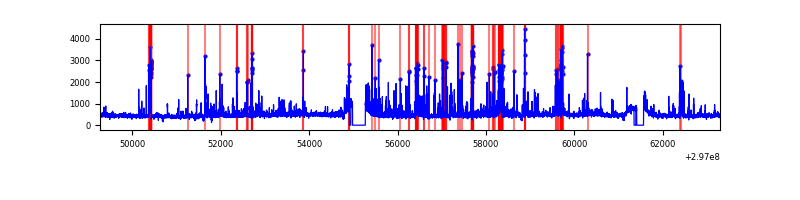 |
Top three noisy pixels from each quadrant. If the there are fewer than three noisy pixels in the level2.evt file, extra rows are filled as -1
| Pixel properties | Quadrant properties | ||||||
|---|---|---|---|---|---|---|---|
| Quadrant | DetID | PixID | Counts | Sigma | Mean | Median | Sigma |
| A | 14 | 238 | 900041 | 2700.53 | 1631 | 1595 | 332.7 |
| A | 0 | 226 | 13955 | 37.15 | 1631 | 1595 | 332.7 |
| A | 3 | 137 | 13579 | 36.02 | 1631 | 1595 | 332.7 |
| B | 4 | 216 | 44680 | 137.85 | 1625 | 1582 | 312.6 |
| B | 12 | 111 | 38524 | 118.16 | 1625 | 1582 | 312.6 |
| B | 11 | 111 | 35093 | 107.19 | 1625 | 1582 | 312.6 |
| C | 9 | 221 | 1404315 | 3821.6 | 1569 | 1581 | 367.1 |
| C | 14 | 238 | 242347 | 655.94 | 1569 | 1581 | 367.1 |
| C | 13 | 61 | 10726 | 24.91 | 1569 | 1581 | 367.1 |
| D | 1 | 52 | 1253470 | 3214.48 | 1592 | 1548 | 389.5 |
| D | 7 | 207 | 72083 | 181.11 | 1592 | 1548 | 389.5 |
| D | 12 | 218 | 55889 | 139.53 | 1592 | 1548 | 389.5 |
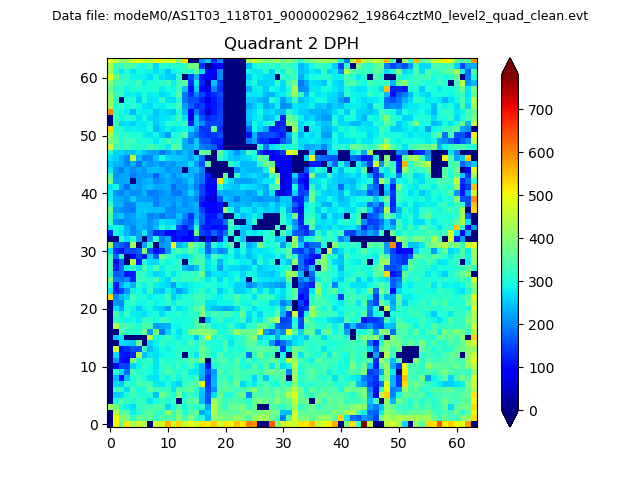
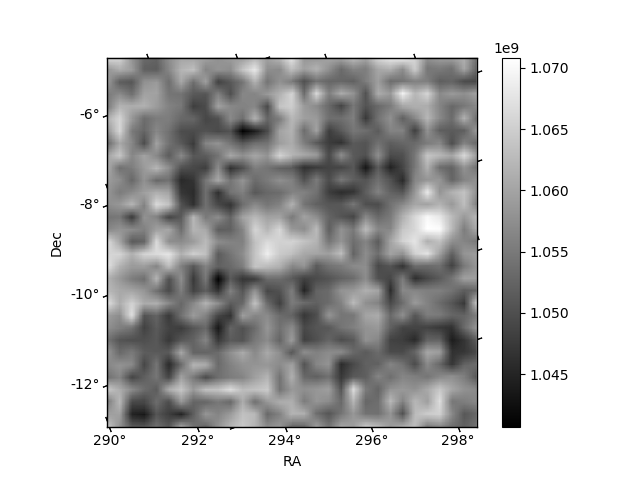
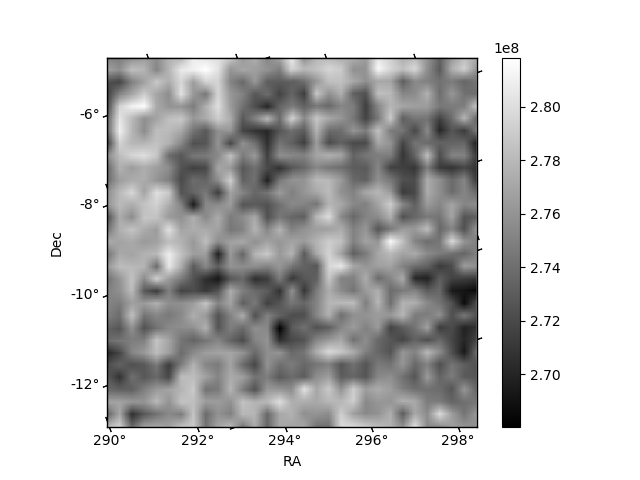
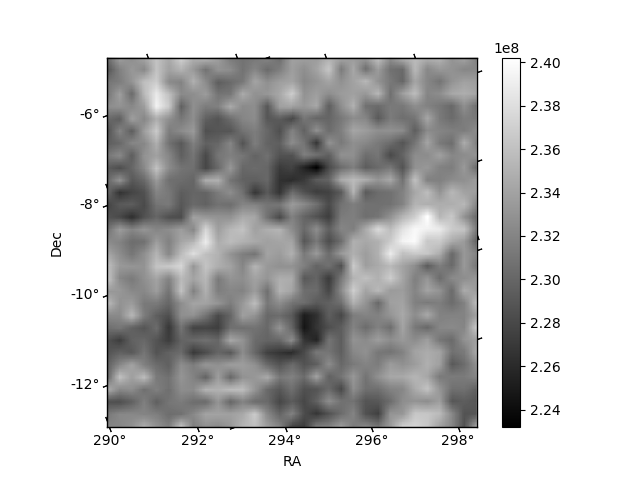
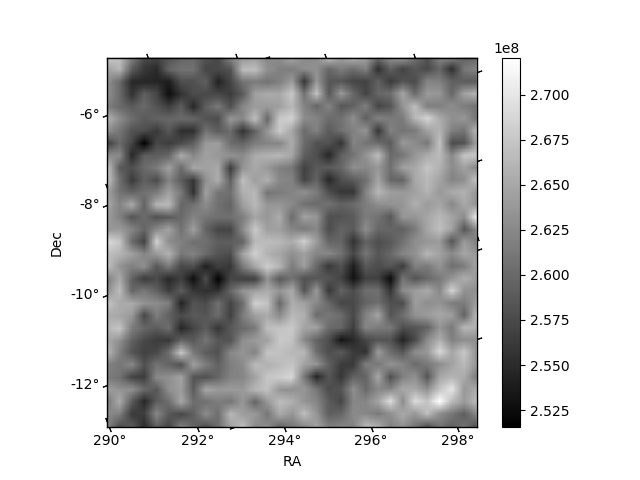
Histogram calculated using DETX and DETY for each event in the final _common_clean file
| Quadrant A | 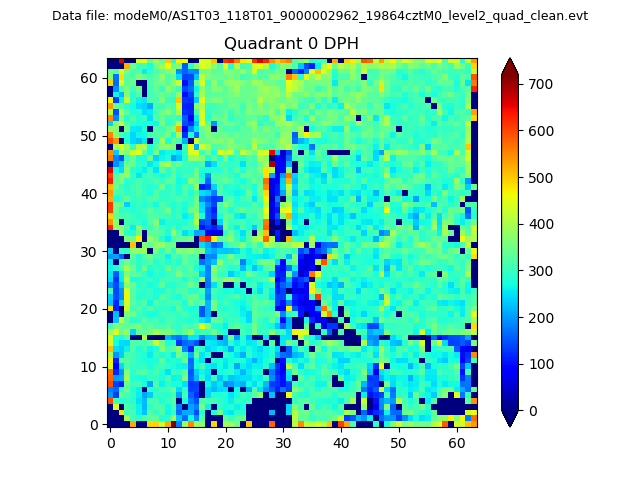 |
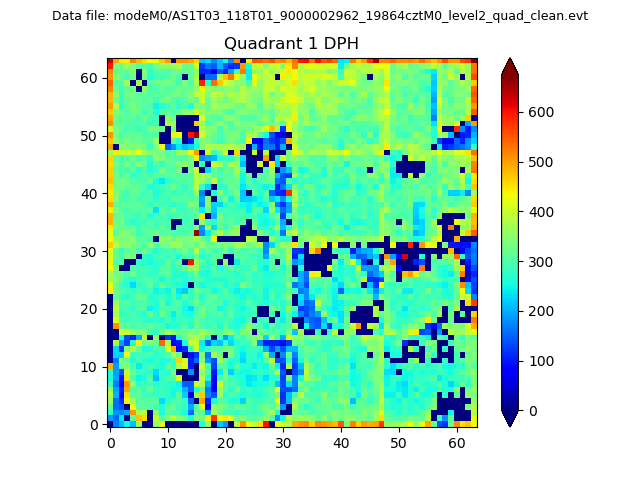 |
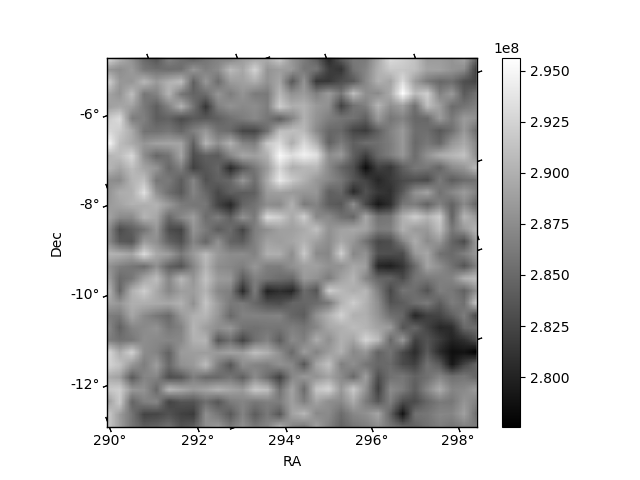
Quadrant B |
|---|---|---|---|
| Quadrant D | 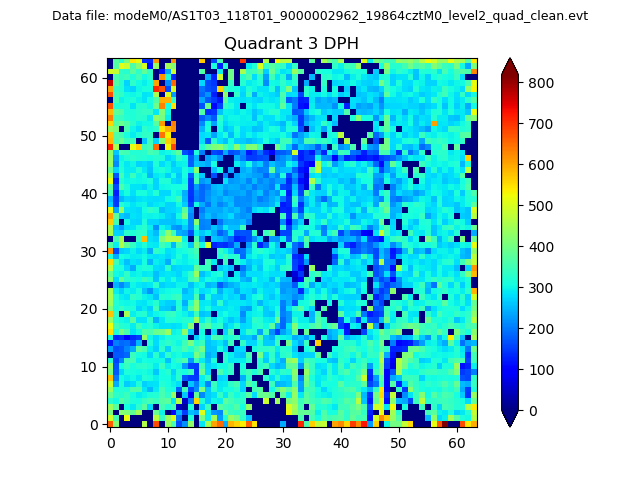 |
 |
Quadrant C |
| Plot type | Count rate plots | Images |
|---|---|---|
| Comparison with Poisson distribution Blue bars denote a histogram of data divided into 1 sec bins. Red curve is a Poisson curve with rate = median count rate of data. |
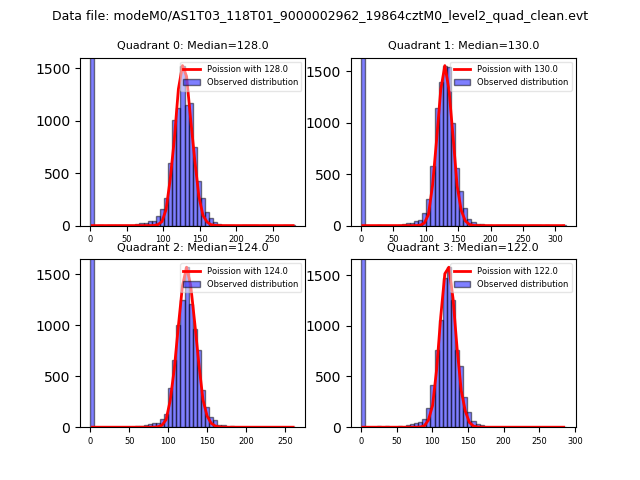 |
 |
| Quadrant-wise count rates Data is divided into 100 sec bins |
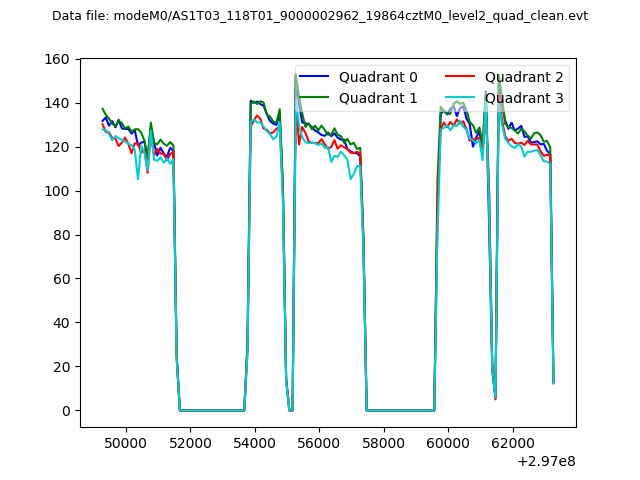 |
|
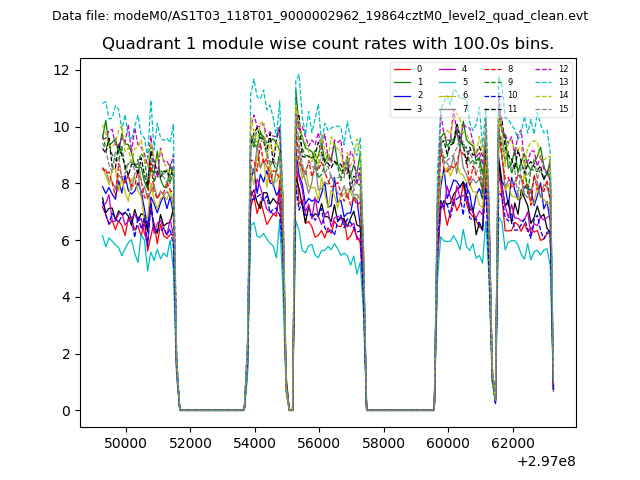
| Module-wise count rates for Quadrant A Data is divided into 100 sec bins |
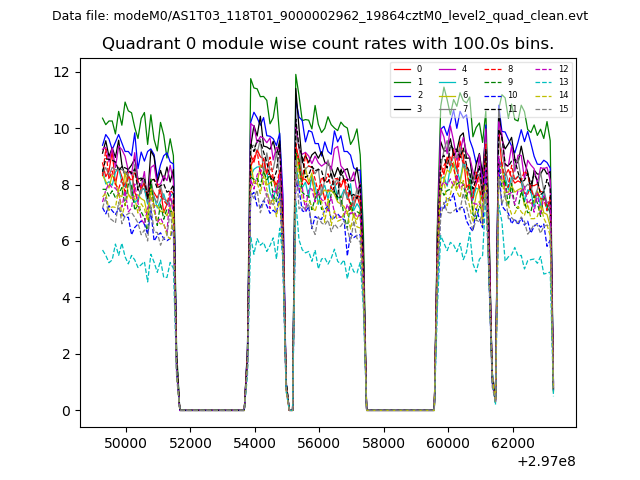 |
 |
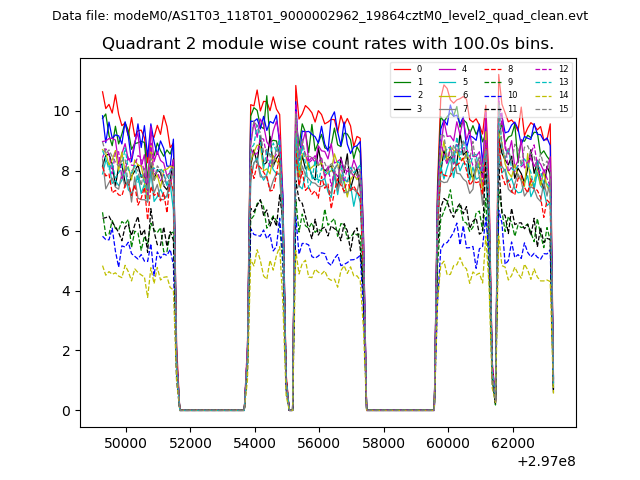
| Module-wise count rates for Quadrant B Data is divided into 100 sec bins |
 |
 |
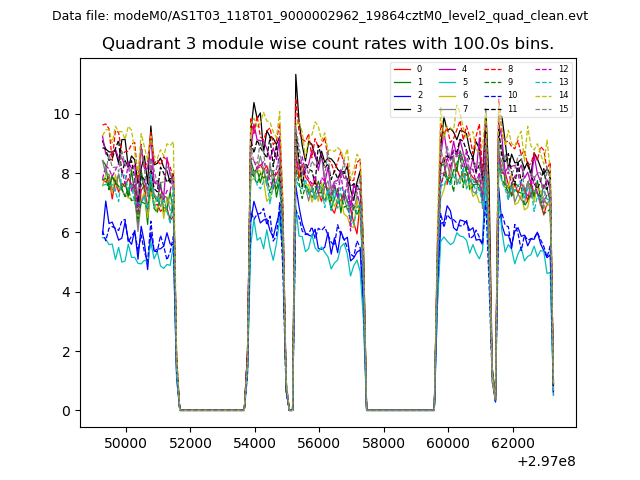
| Module-wise count rates for Quadrant C Data is divided into 100 sec bins |
 |
 |
| Module-wise count rates for Quadrant D Data is divided into 100 sec bins |
 |
 |
| Parameter | Plot |
|---|---|
| CZT HV Monitor | 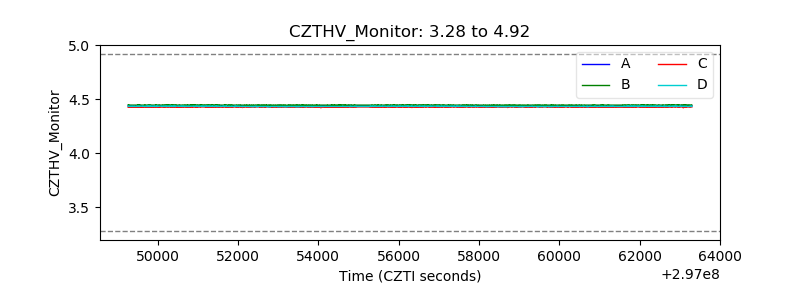 |
| D_VDD | 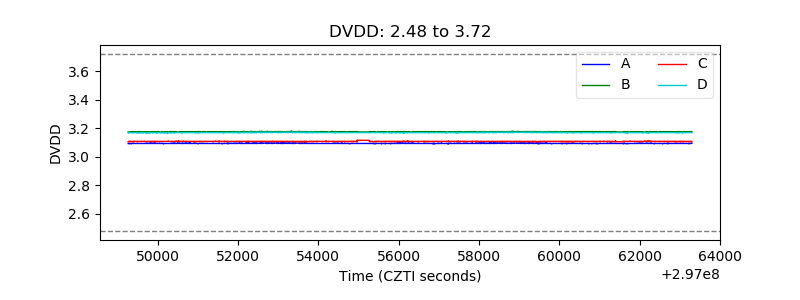 |
| Temperature 1 | 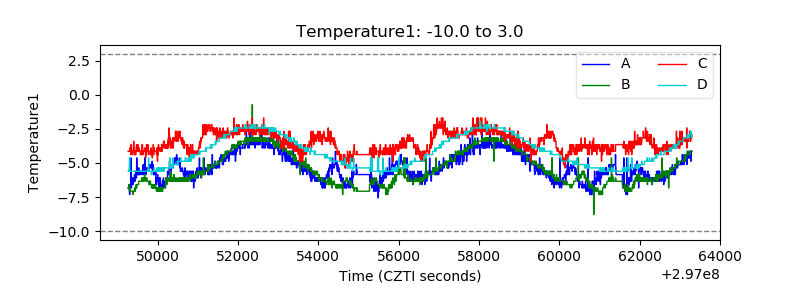 |
| Veto HV Monitor | 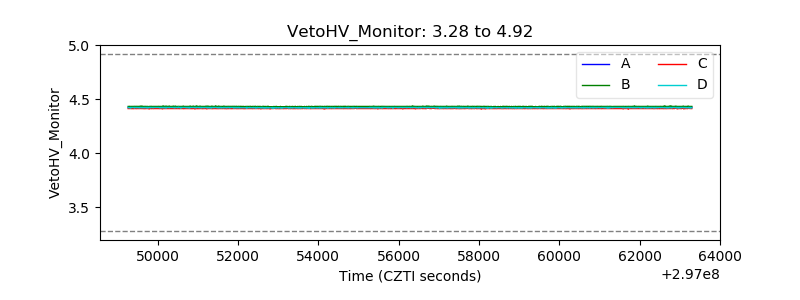 |
| Veto LLD | 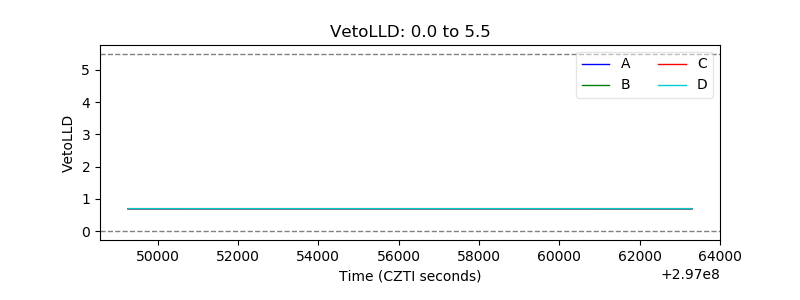 |
| Alpha Counter | 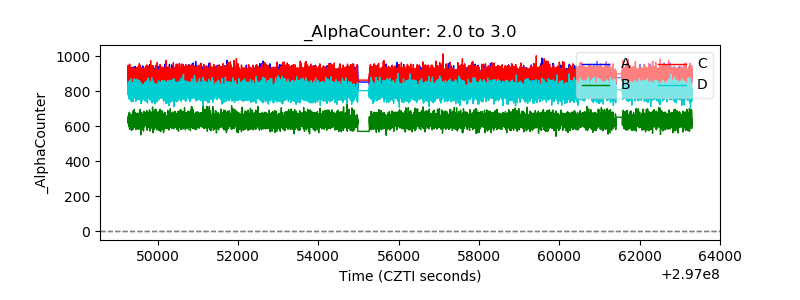 |
| _CPM_Rate | 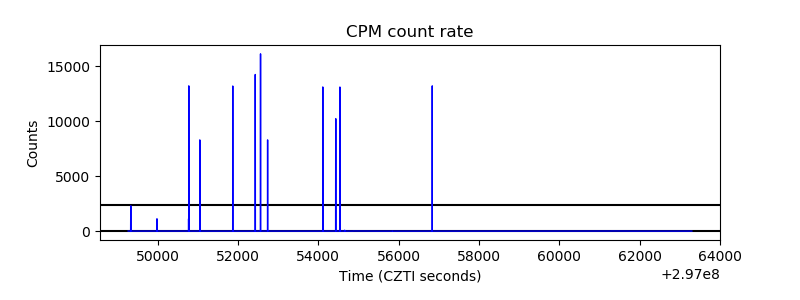 |
| CZT Counter | 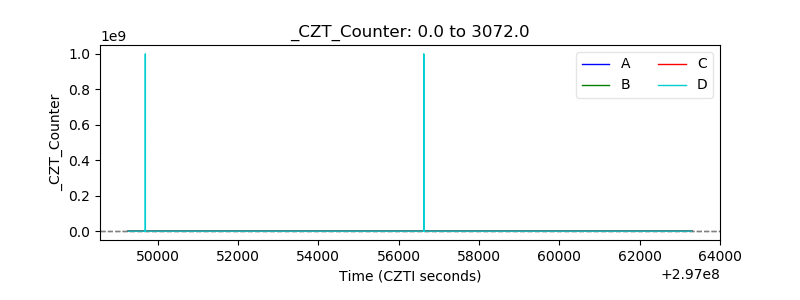 |
| +2.5 Volts monitor | 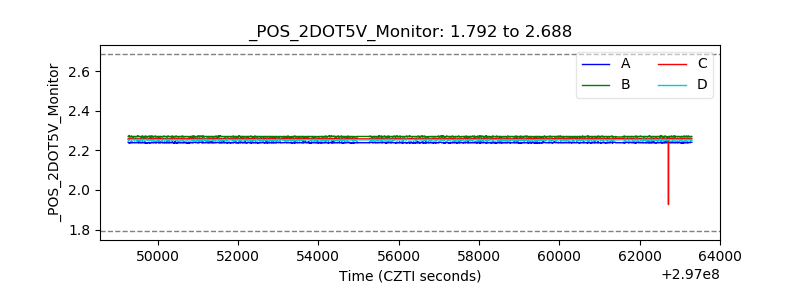 |
| +5 Volts monitor | 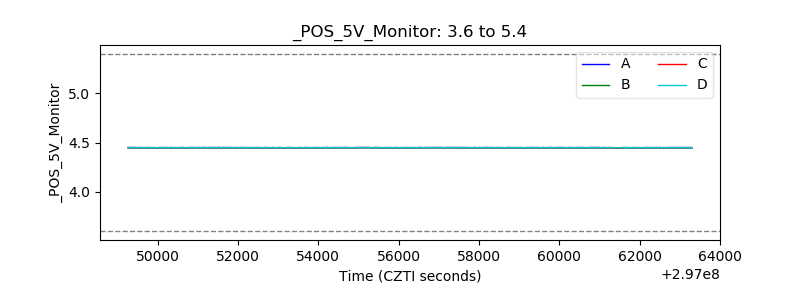 |
| _ROLL_ROT | 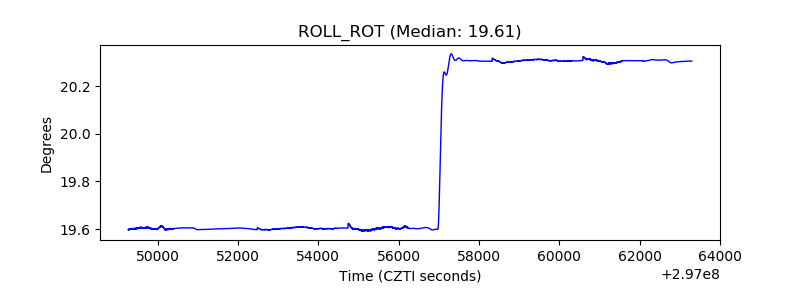 |
| _Roll_DEC | 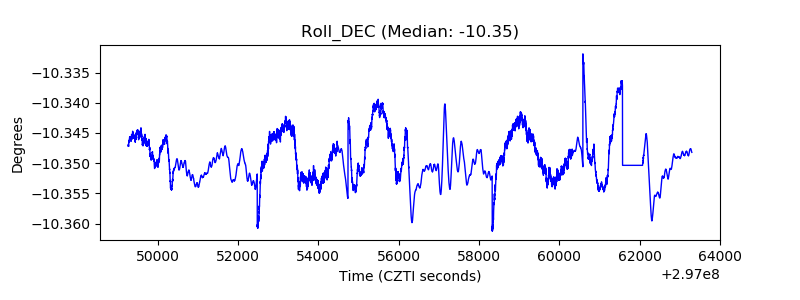 |
| _Roll_RA | 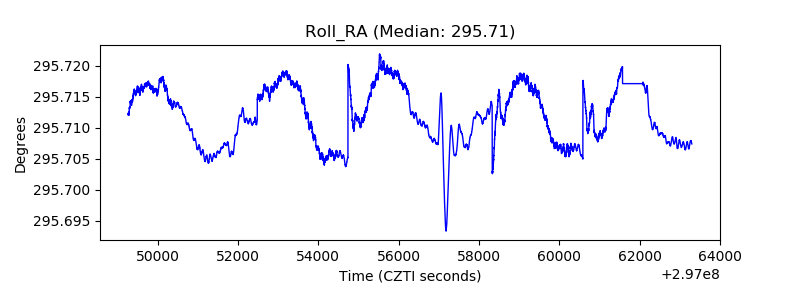 |
| Veto Counter | 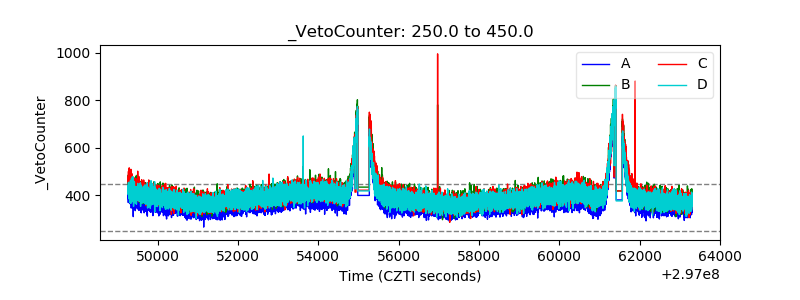 |