| Param | Original file | Final file |
|---|---|---|
| Filename | modeM0/AS1T03_118T01_9000002962_19867cztM0_level2.evt | modeM0/AS1T03_118T01_9000002962_19867cztM0_level2_quad_clean.evt |
| Size (bytes) | 1,543,242,240 | 202,095,360 |
| Size | 1.4 GB | 192.7 MB |
| Events in quadrant A | 11,507,476 | 1,238,130 |
| Events in quadrant B | 8,623,253 | 1,281,676 |
| Events in quadrant C | 13,142,814 | 1,200,781 |
| Events in quadrant D | 12,261,812 | 1,170,935 |
| Mode SS | |||
|---|---|---|---|
| Quadrant | BADHDUFLAG | Total packets | Discarded packets |
| A | 0 | 362 | 0 |
| B | 0 | 362 | 0 |
| C | 0 | 362 | 0 |
| D | 0 | 362 | 0 |
| Mode M9 | |||
|---|---|---|---|
| Quadrant | BADHDUFLAG | Total packets | Discarded packets |
| A | 0 | 18 | 0 |
| B | 0 | 18 | 0 |
| C | 0 | 18 | 0 |
| D | 0 | 18 | 0 |
| Mode M0 | |||
|---|---|---|---|
| Quadrant | BADHDUFLAG | Total packets | Discarded packets |
| A | 0 | 45838 | 3 |
| B | 0 | 36801 | 3 |
| C | 0 | 50489 | 3 |
| D | 0 | 48295 | 3 |
| Quadrant | Total seconds | Saturated seconds | Saturation percentage |
|---|---|---|---|
| A | 17820 | 923 | 5.179574% |
| B | 17821 | 223 | 1.251333% |
| C | 17821 | 1356 | 7.609001% |
| D | 17821 | 1145 | 6.425004% |
Noise dominated data is calculated using 1-second bins in cleaned event files. If a bin has >2000 counts, and if more than 50% of those come from <1% of pixels, then it is considered to be noise-dominated and hence unusable.
| Quadrant | # 1 sec bins | Bins with >0 counts | Bins with >2000 counts | High rate bins dominated by noise | Noise dominated (total time) | Noise dominated (detector-on time) | Marked lightcurve |
|---|---|---|---|---|---|---|---|
| A | 19595 | 17820 | 575 | 575 | 2.93% | 3.23% | 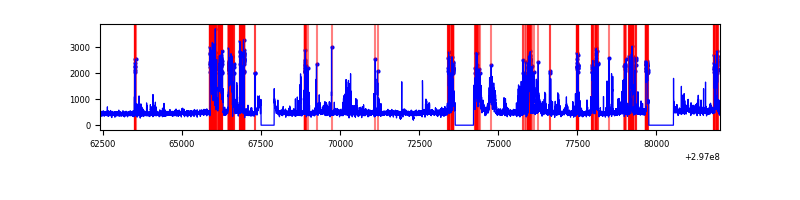 |
| B | 19596 | 17821 | 5 | 5 | 0.03% | 0.03% | 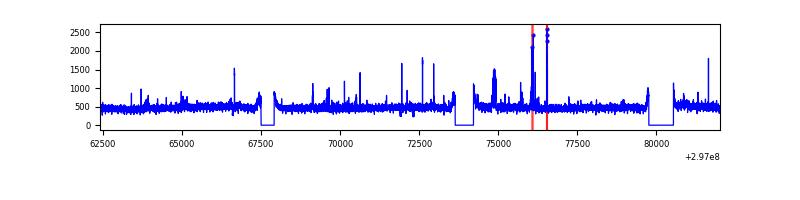 |
| C | 19596 | 17821 | 765 | 765 | 3.90% | 4.29% | 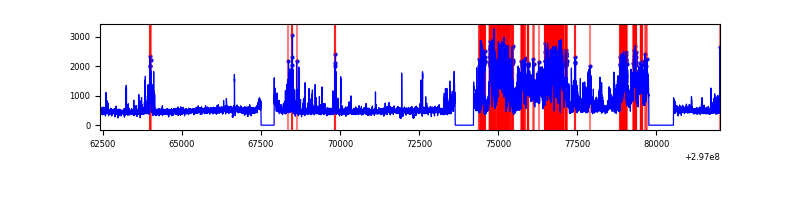 |
| D | 19596 | 17821 | 877 | 877 | 4.48% | 4.92% | 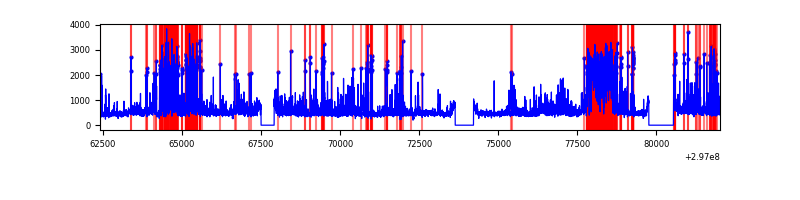 |
Top three noisy pixels from each quadrant. If the there are fewer than three noisy pixels in the level2.evt file, extra rows are filled as -1
| Pixel properties | Quadrant properties | ||||||
|---|---|---|---|---|---|---|---|
| Quadrant | DetID | PixID | Counts | Sigma | Mean | Median | Sigma |
| A | 14 | 238 | 3365872 | 7877.85 | 2115 | 2070 | 427.0 |
| A | 0 | 226 | 18222 | 37.83 | 2115 | 2070 | 427.0 |
| A | 3 | 137 | 17831 | 36.91 | 2115 | 2070 | 427.0 |
| B | 0 | 230 | 97899 | 234.19 | 2133 | 2077 | 409.2 |
| B | 7 | 220 | 55183 | 129.79 | 2133 | 2077 | 409.2 |
| B | 12 | 111 | 51250 | 120.18 | 2133 | 2077 | 409.2 |
| C | 9 | 221 | 4897254 | 10300.15 | 2028 | 2040 | 475.3 |
| C | 14 | 238 | 309546 | 647.03 | 2028 | 2040 | 475.3 |
| C | 7 | 220 | 30065 | 58.97 | 2028 | 2040 | 475.3 |
| D | 1 | 52 | 4321304 | 8647.12 | 2057 | 1995 | 499.5 |
| D | 2 | 234 | 74841 | 145.83 | 2057 | 1995 | 499.5 |
| D | 12 | 218 | 44215 | 84.52 | 2057 | 1995 | 499.5 |
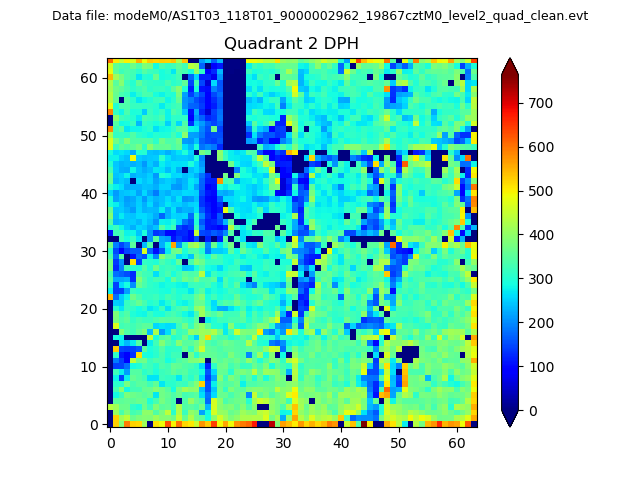
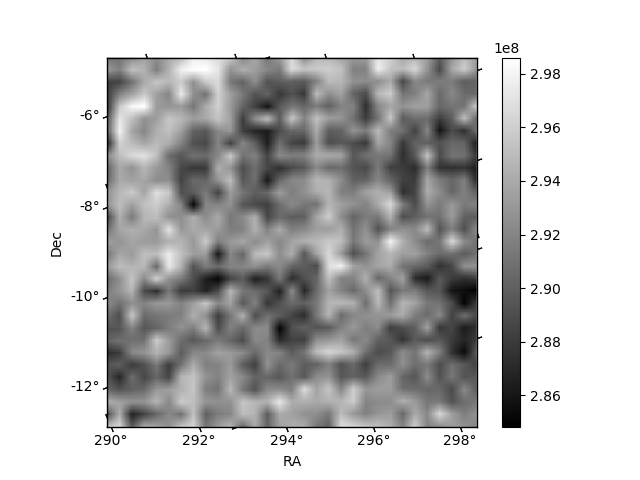
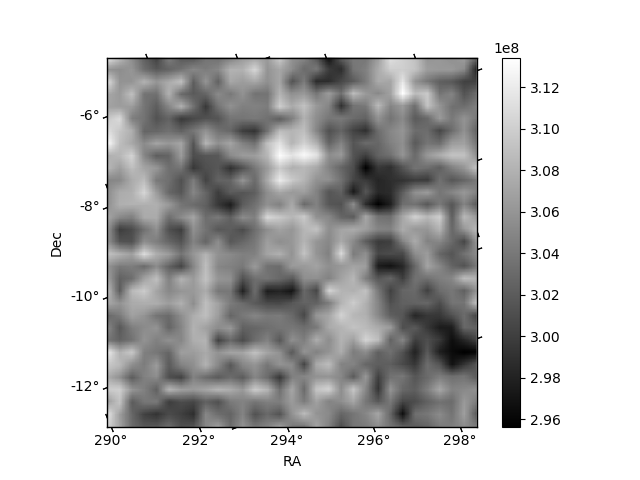
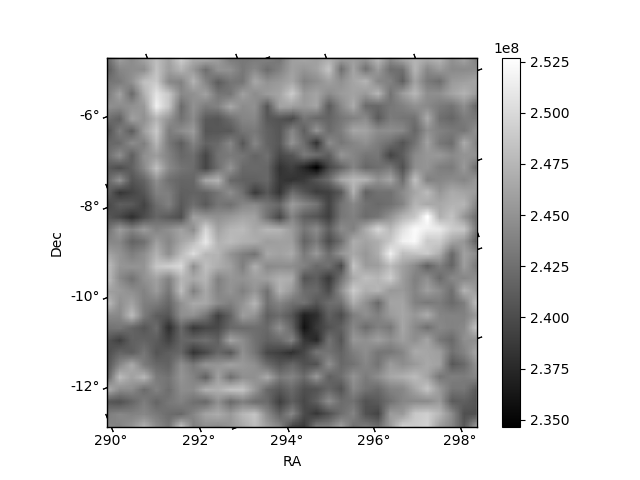
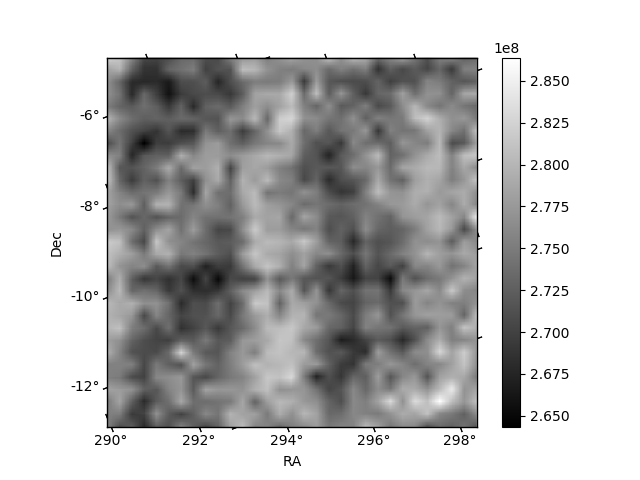
Histogram calculated using DETX and DETY for each event in the final _common_clean file
| Quadrant A | 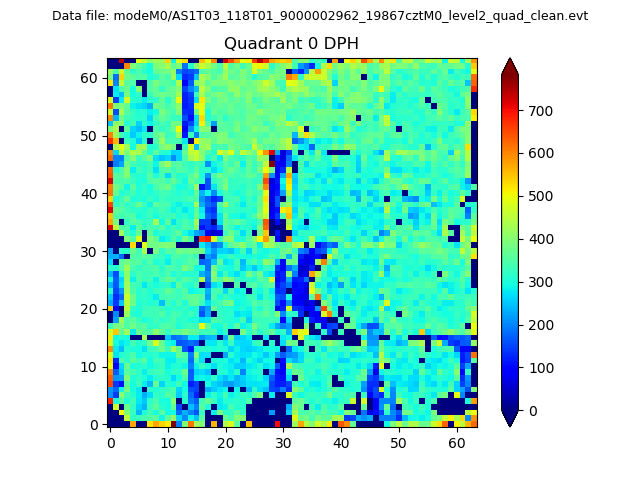 |
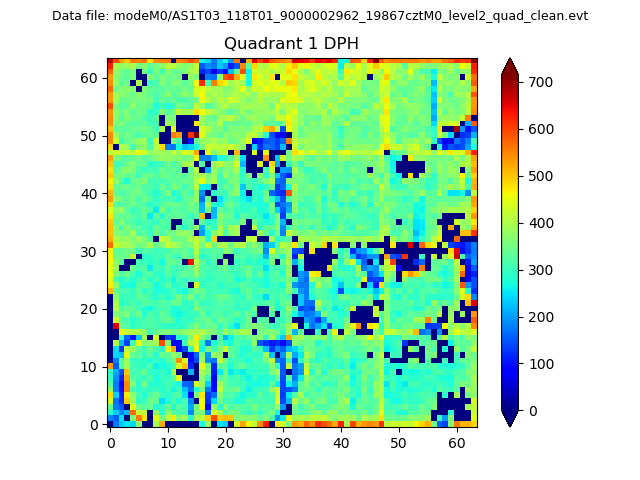 |
Quadrant B |
|---|---|---|---|
| Quadrant D | 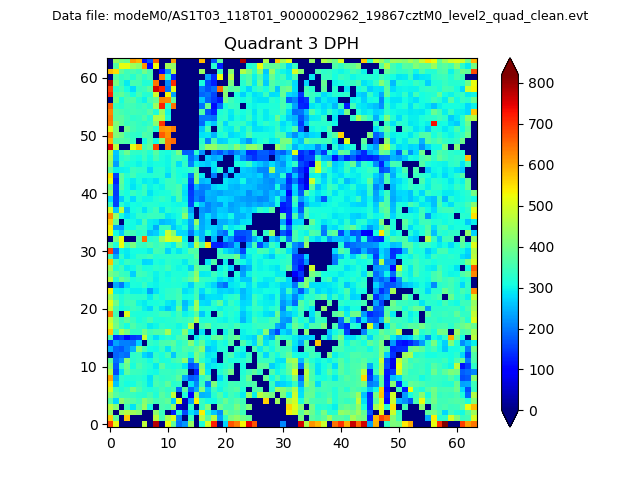 |
 |
Quadrant C |
| Plot type | Count rate plots | Images |
|---|---|---|
| Comparison with Poisson distribution Blue bars denote a histogram of data divided into 1 sec bins. Red curve is a Poisson curve with rate = median count rate of data. |
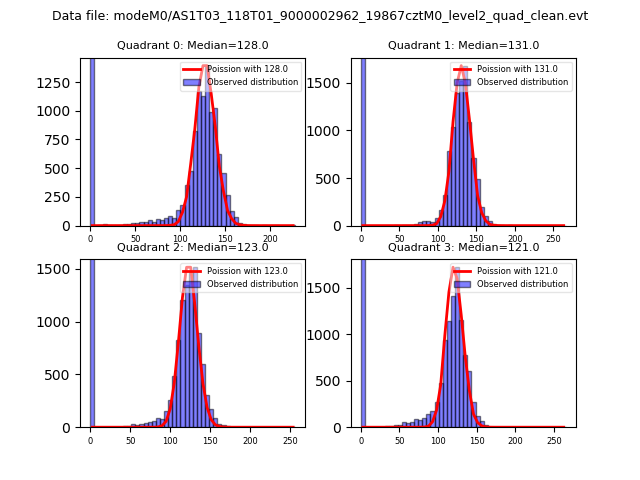 |
 |
| Quadrant-wise count rates Data is divided into 100 sec bins |
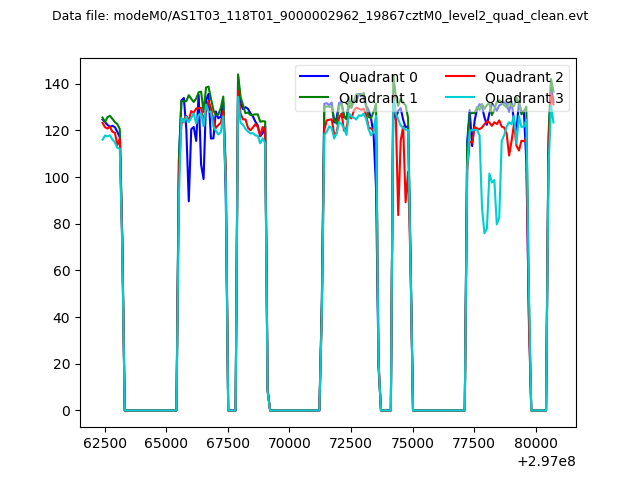 |
|
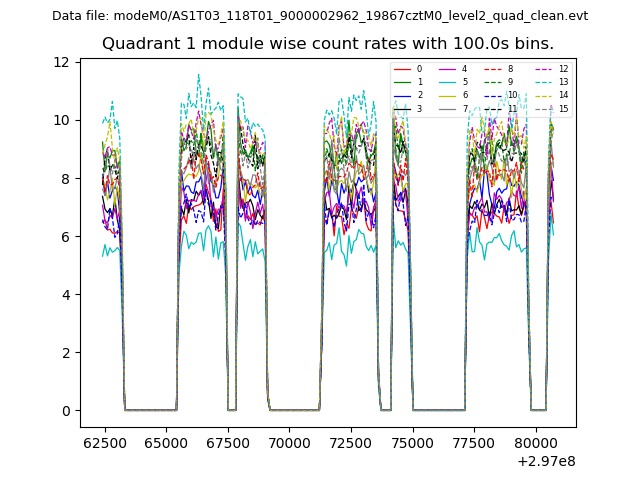
| Module-wise count rates for Quadrant A Data is divided into 100 sec bins |
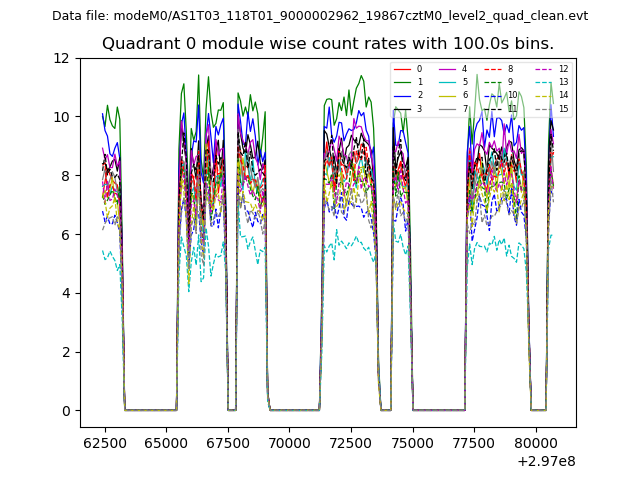 |
 |
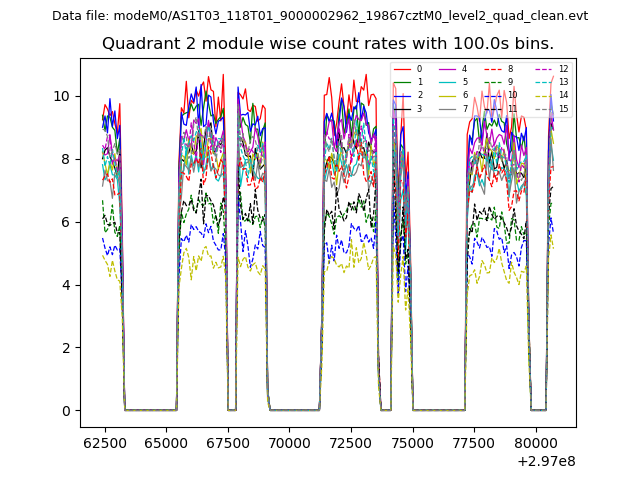
| Module-wise count rates for Quadrant B Data is divided into 100 sec bins |
 |
 |
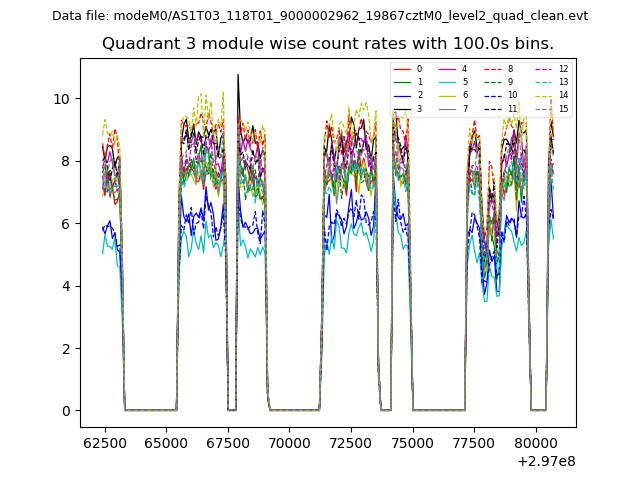
| Module-wise count rates for Quadrant C Data is divided into 100 sec bins |
 |
 |
| Module-wise count rates for Quadrant D Data is divided into 100 sec bins |
 |
 |
| Parameter | Plot |
|---|---|
| CZT HV Monitor | 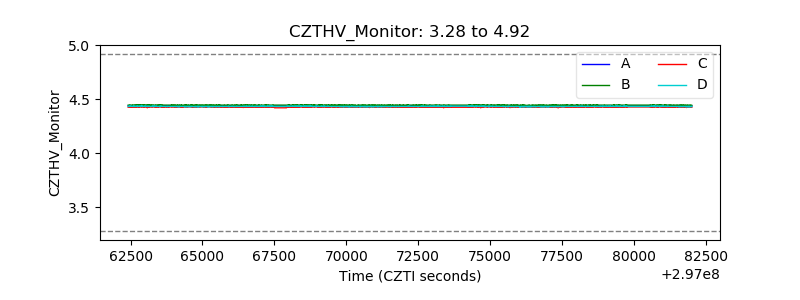 |
| D_VDD | 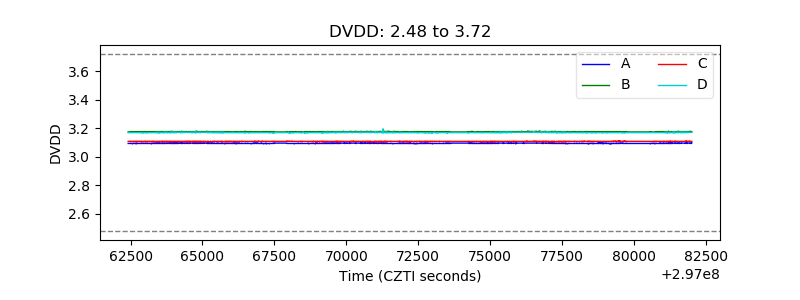 |
| Temperature 1 | 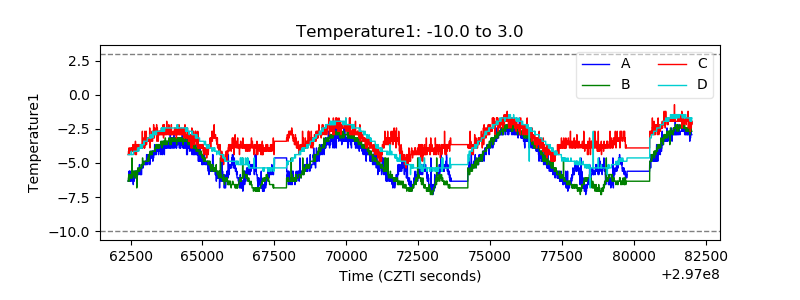 |
| Veto HV Monitor | 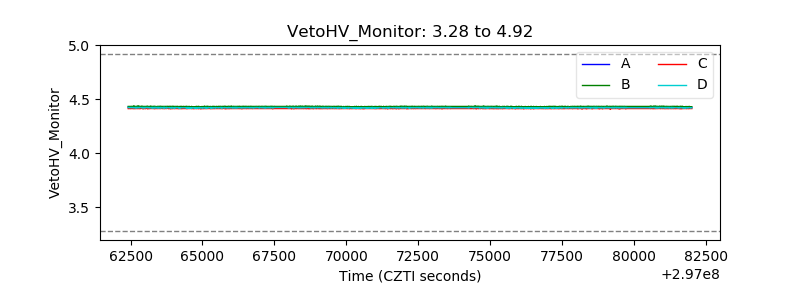 |
| Veto LLD | 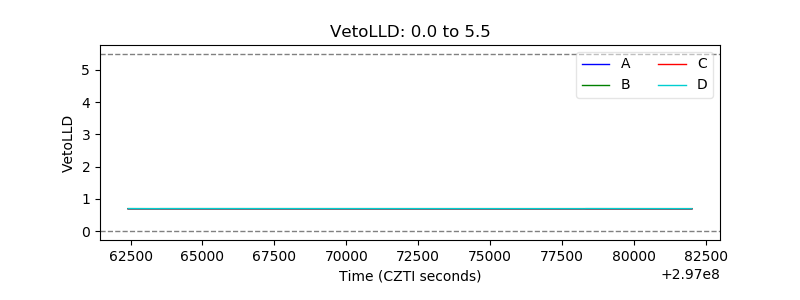 |
| Alpha Counter | 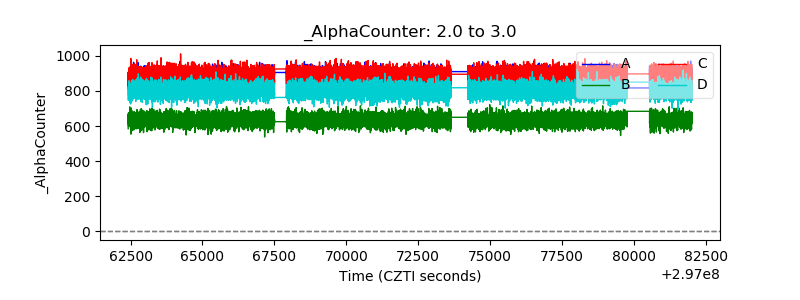 |
| _CPM_Rate | 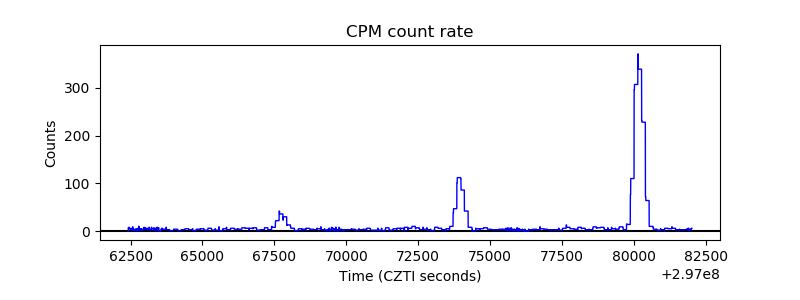 |
| CZT Counter | 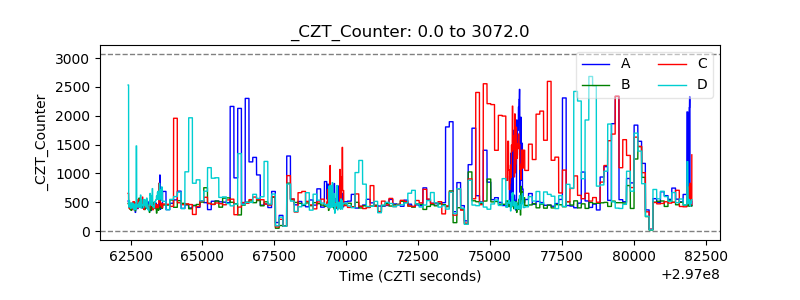 |
| +2.5 Volts monitor |  |
| +5 Volts monitor | 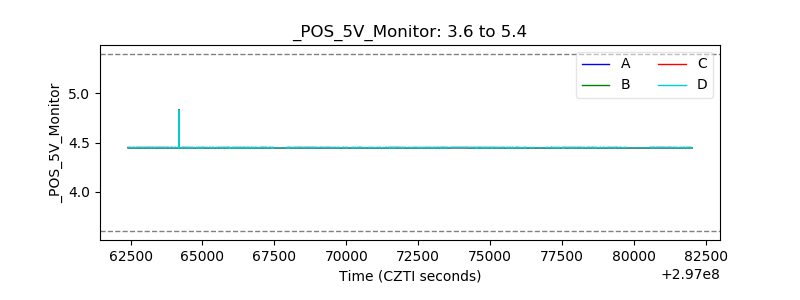 |
| _ROLL_ROT | 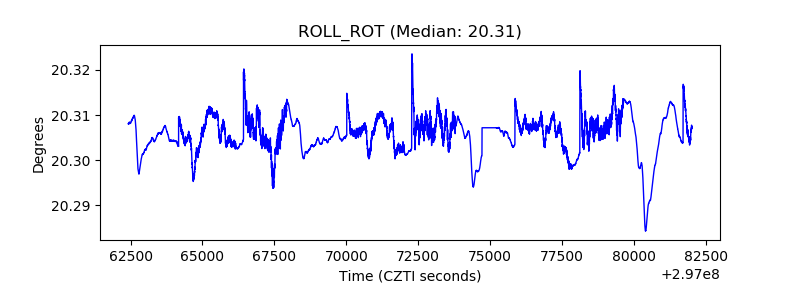 |
| _Roll_DEC |  |
| _Roll_RA | 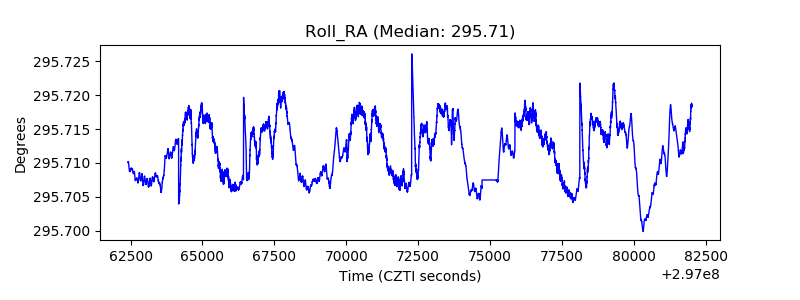 |
| Veto Counter | 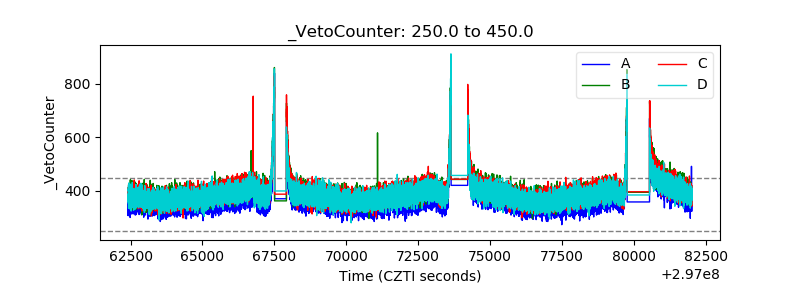 |