| Param | Original file | Final file |
|---|---|---|
| Filename | modeM0/AS1T03_118T01_9000002962_19869cztM0_level2.evt | modeM0/AS1T03_118T01_9000002962_19869cztM0_level2_quad_clean.evt |
| Size (bytes) | 636,672,960 | 66,343,680 |
| Size | 607.2 MB | 63.3 MB |
| Events in quadrant A | 5,736,390 | 384,907 |
| Events in quadrant B | 3,445,718 | 409,519 |
| Events in quadrant C | 4,425,582 | 377,540 |
| Events in quadrant D | 5,232,999 | 381,983 |
| Mode SS | |||
|---|---|---|---|
| Quadrant | BADHDUFLAG | Total packets | Discarded packets |
| A | 0 | 132 | 0 |
| B | 0 | 132 | 0 |
| C | 0 | 132 | 0 |
| D | 0 | 132 | 0 |
| Mode M9 | |||
|---|---|---|---|
| Quadrant | BADHDUFLAG | Total packets | Discarded packets |
| A | 0 | 15 | 0 |
| B | 0 | 16 | 0 |
| C | 0 | 16 | 0 |
| D | 0 | 16 | 0 |
| Mode M0 | |||
|---|---|---|---|
| Quadrant | BADHDUFLAG | Total packets | Discarded packets |
| A | 0 | 21464 | 2 |
| B | 0 | 14442 | 2 |
| C | 0 | 17429 | 2 |
| D | 0 | 19715 | 2 |
| Quadrant | Total seconds | Saturated seconds | Saturation percentage |
|---|---|---|---|
| A | 6517 | 691 | 10.603038% |
| B | 6517 | 90 | 1.381004% |
| C | 6517 | 331 | 5.079024% |
| D | 6517 | 684 | 10.495627% |
Noise dominated data is calculated using 1-second bins in cleaned event files. If a bin has >2000 counts, and if more than 50% of those come from <1% of pixels, then it is considered to be noise-dominated and hence unusable.
| Quadrant | # 1 sec bins | Bins with >0 counts | Bins with >2000 counts | High rate bins dominated by noise | Noise dominated (total time) | Noise dominated (detector-on time) | Marked lightcurve |
|---|---|---|---|---|---|---|---|
| A | 7582 | 6517 | 441 | 441 | 5.82% | 6.77% | 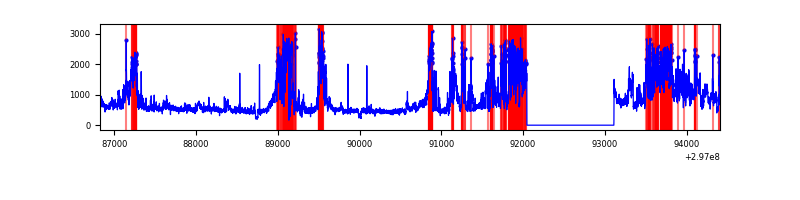 |
| B | 7582 | 6517 | 16 | 16 | 0.21% | 0.25% | 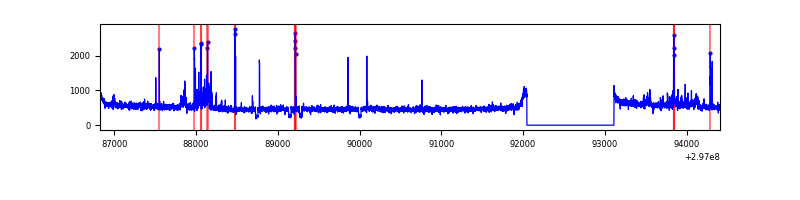 |
| C | 7582 | 6517 | 184 | 184 | 2.43% | 2.82% | 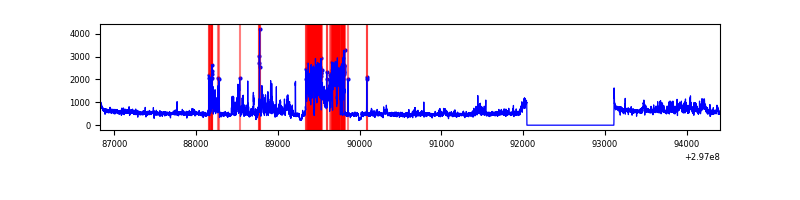 |
| D | 7582 | 6517 | 548 | 548 | 7.23% | 8.41% | 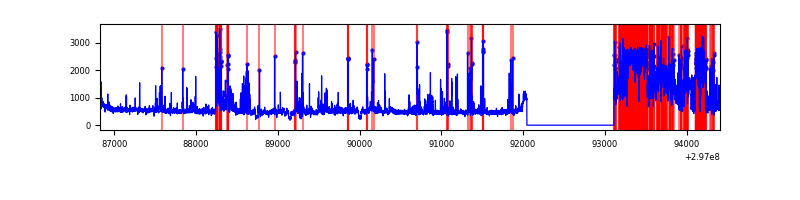 |
Top three noisy pixels from each quadrant. If the there are fewer than three noisy pixels in the level2.evt file, extra rows are filled as -1
| Pixel properties | Quadrant properties | ||||||
|---|---|---|---|---|---|---|---|
| Quadrant | DetID | PixID | Counts | Sigma | Mean | Median | Sigma |
| A | 14 | 238 | 2606919 | 16020.62 | 812 | 795 | 162.7 |
| A | 0 | 226 | 6906 | 37.57 | 812 | 795 | 162.7 |
| A | 3 | 137 | 6378 | 34.32 | 812 | 795 | 162.7 |
| B | 4 | 216 | 77349 | 486.38 | 830 | 810 | 157.4 |
| B | 7 | 220 | 70225 | 441.11 | 830 | 810 | 157.4 |
| B | 12 | 111 | 18876 | 114.8 | 830 | 810 | 157.4 |
| C | 9 | 221 | 1194151 | 6470.53 | 795 | 800 | 184.4 |
| C | 14 | 238 | 125363 | 675.4 | 795 | 800 | 184.4 |
| C | 3 | 233 | 8473 | 41.6 | 795 | 800 | 184.4 |
| D | 1 | 52 | 2131393 | 11363.24 | 773 | 752 | 187.5 |
| D | 2 | 184 | 86842 | 459.14 | 773 | 752 | 187.5 |
| D | 7 | 238 | 59555 | 313.61 | 773 | 752 | 187.5 |
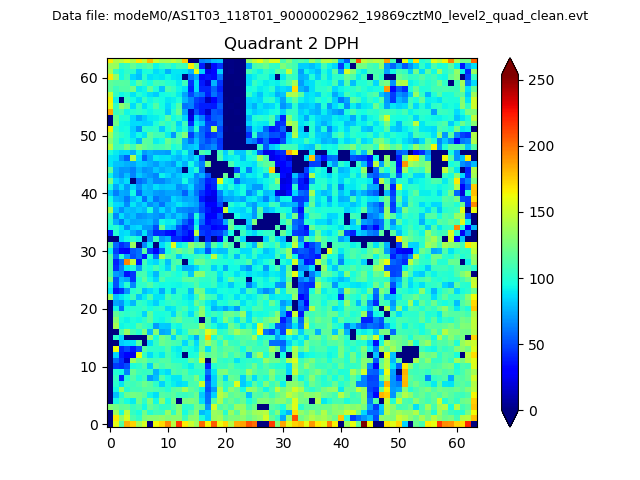
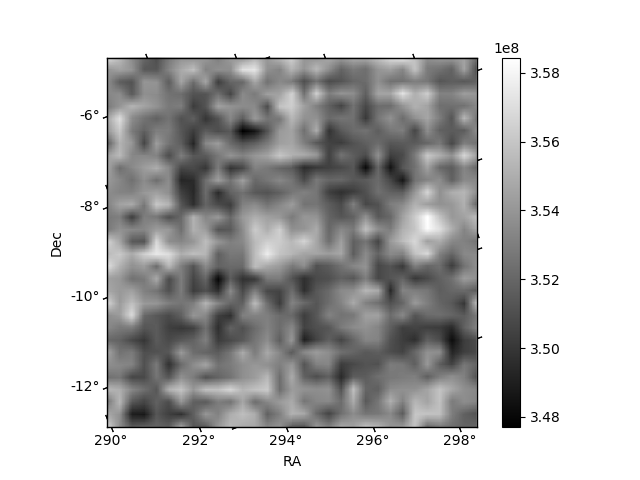
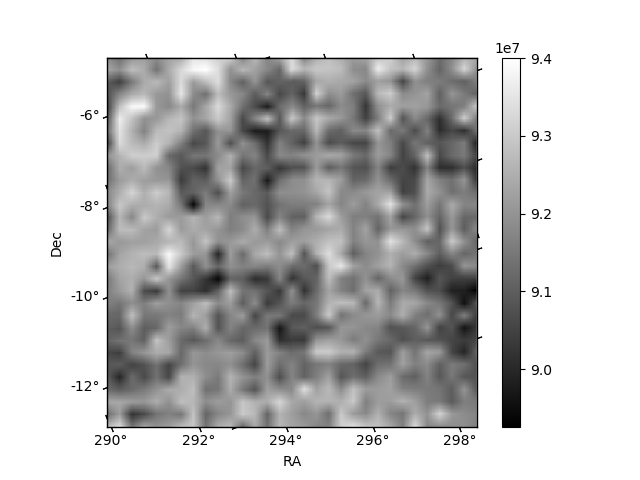
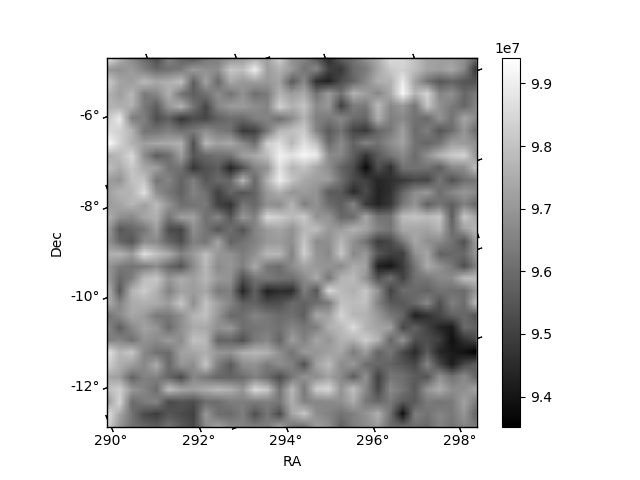
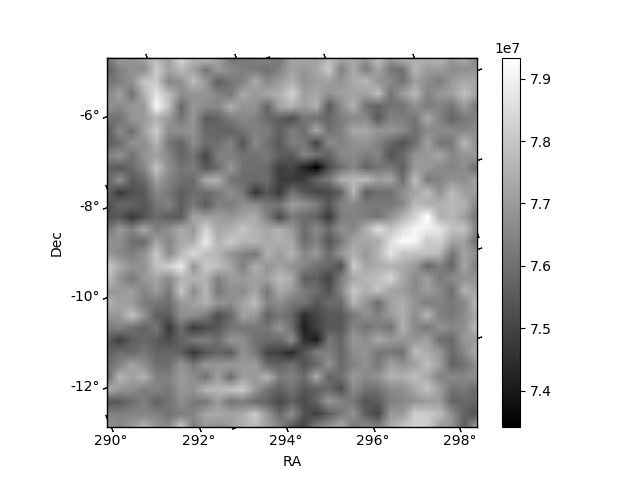
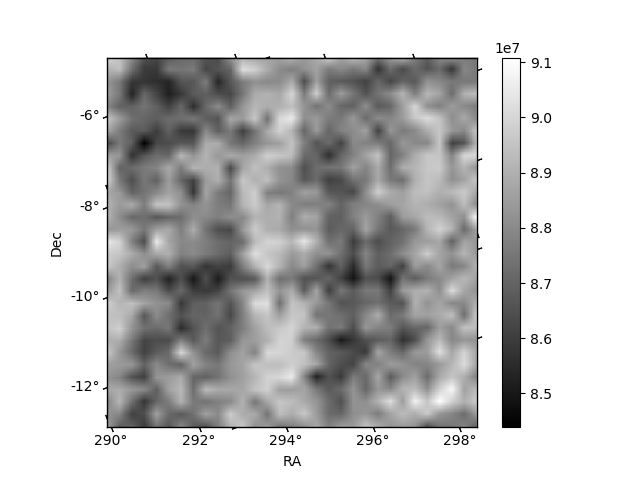
Histogram calculated using DETX and DETY for each event in the final _common_clean file
| Quadrant A | 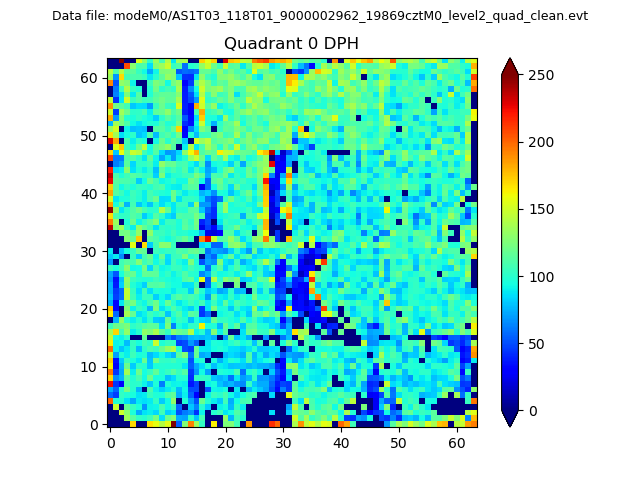 |
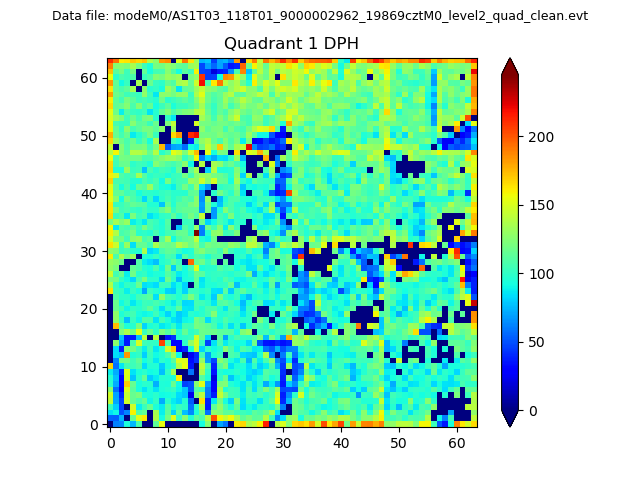 |
Quadrant B |
|---|---|---|---|
| Quadrant D | 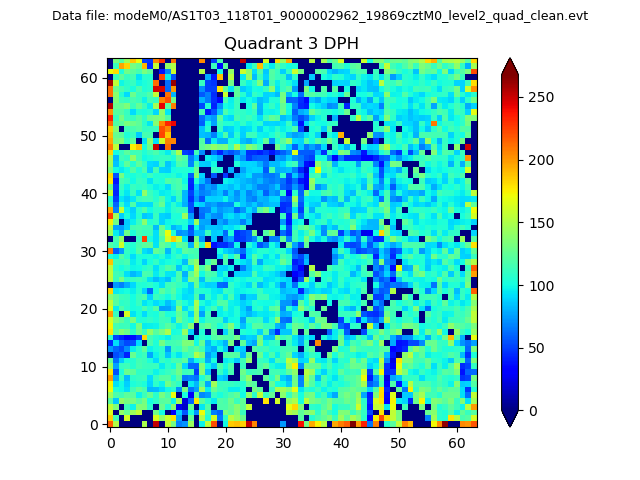 |
 |
Quadrant C |
| Plot type | Count rate plots | Images |
|---|---|---|
| Comparison with Poisson distribution Blue bars denote a histogram of data divided into 1 sec bins. Red curve is a Poisson curve with rate = median count rate of data. |
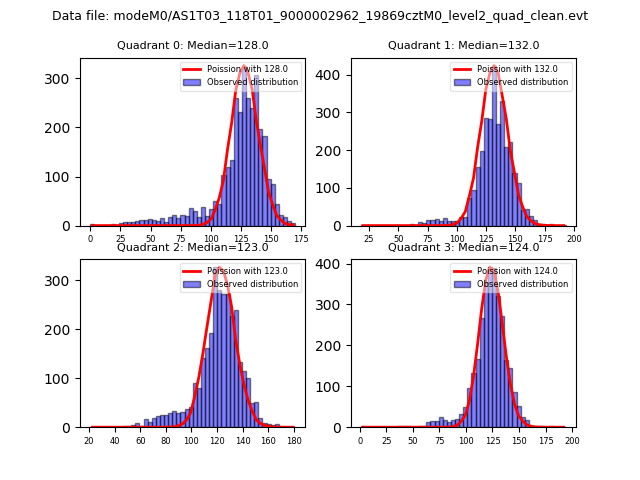 |
 |
| Quadrant-wise count rates Data is divided into 100 sec bins |
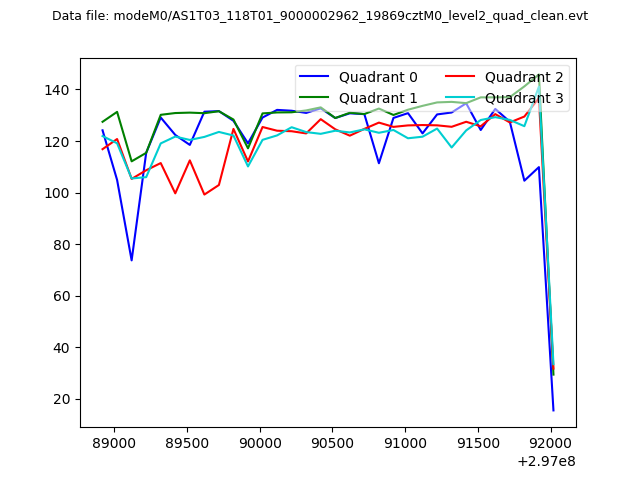 |
|
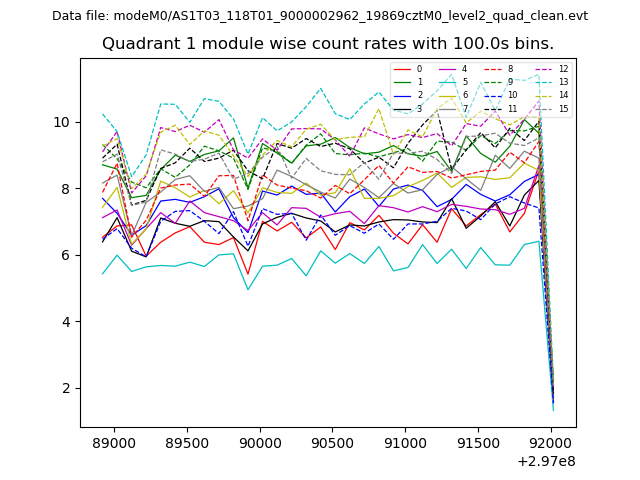
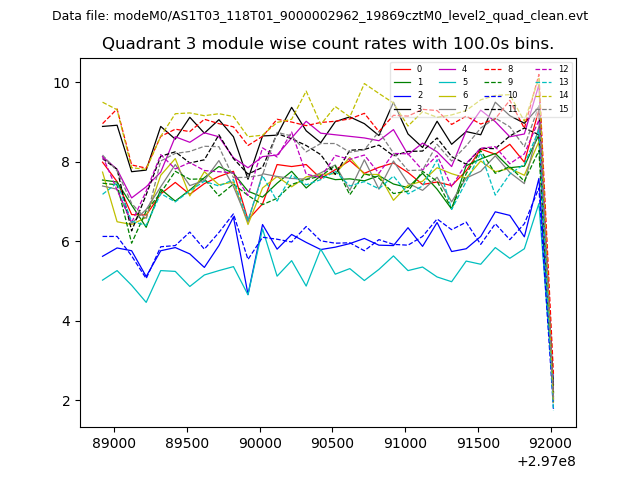
| Module-wise count rates for Quadrant A Data is divided into 100 sec bins |
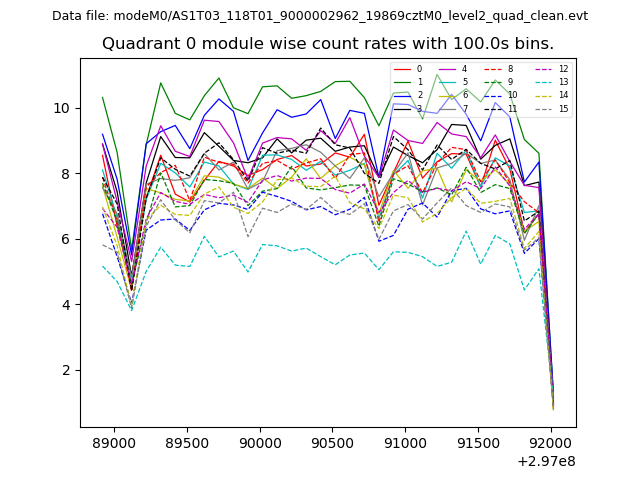 |
 |
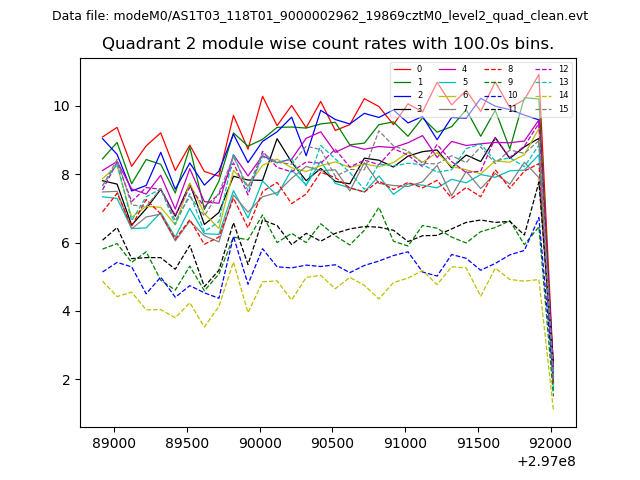
| Module-wise count rates for Quadrant B Data is divided into 100 sec bins |
 |
 |
| Module-wise count rates for Quadrant C Data is divided into 100 sec bins |
 |
 |
| Module-wise count rates for Quadrant D Data is divided into 100 sec bins |
 |
 |
| Parameter | Plot |
|---|---|
| CZT HV Monitor | 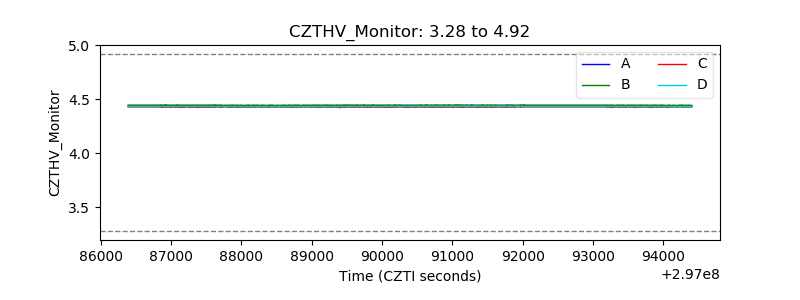 |
| D_VDD | 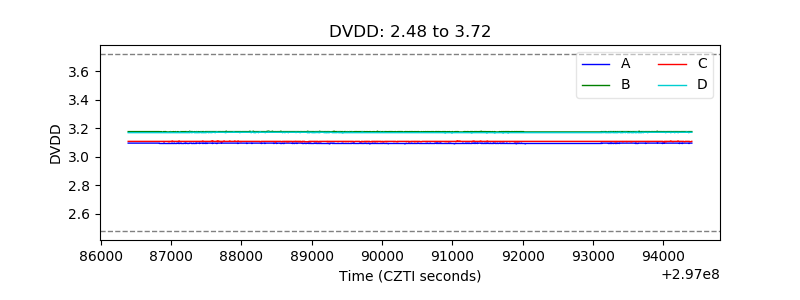 |
| Temperature 1 | 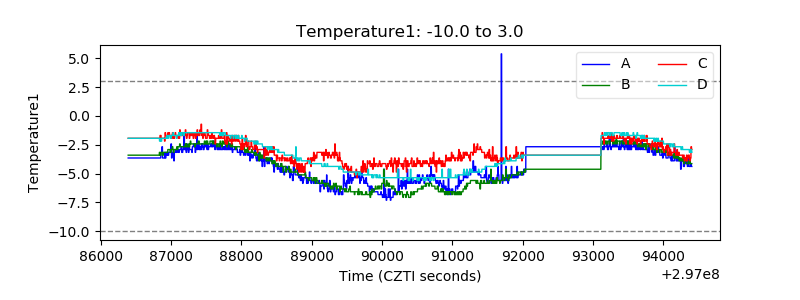 |
| Veto HV Monitor | 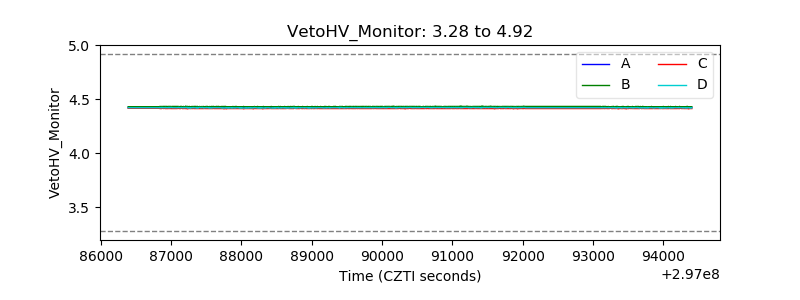 |
| Veto LLD | 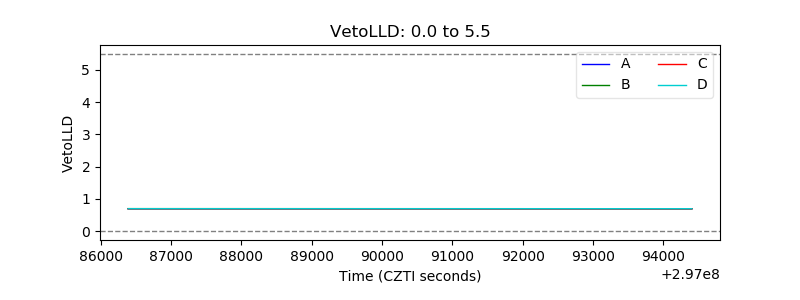 |
| Alpha Counter | 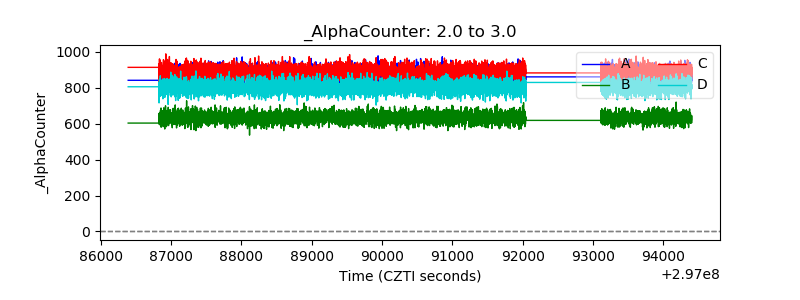 |
| _CPM_Rate | 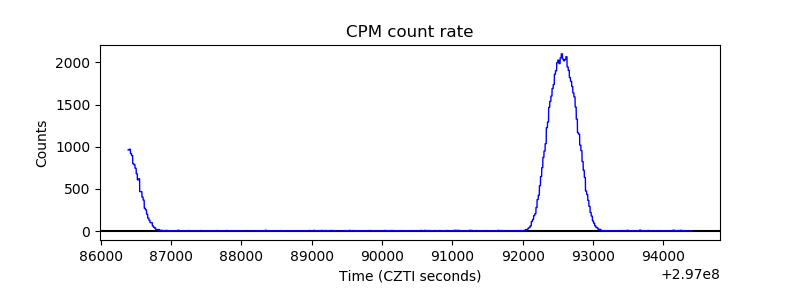 |
| CZT Counter | 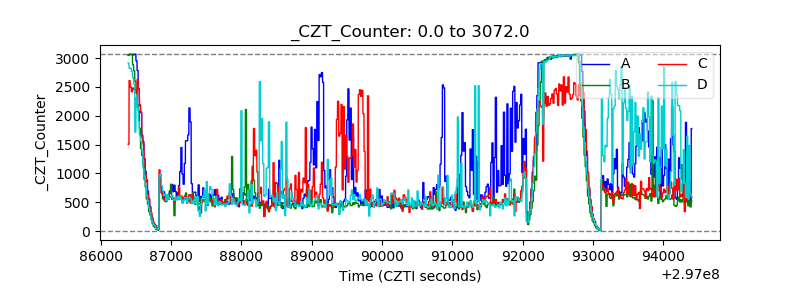 |
| +2.5 Volts monitor |  |
| +5 Volts monitor |  |
| _ROLL_ROT | 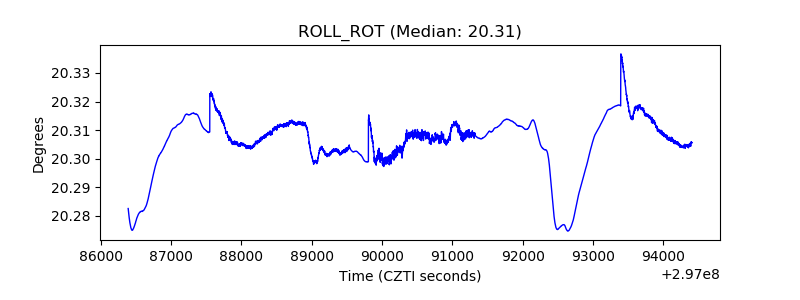 |
| _Roll_DEC | 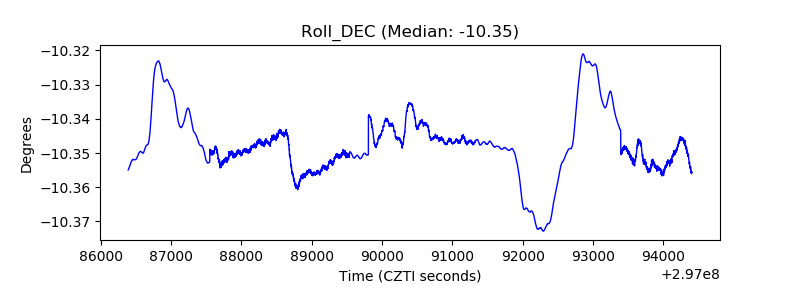 |
| _Roll_RA | 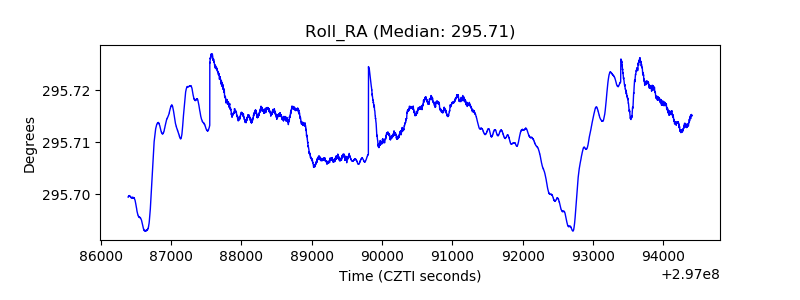 |
| Veto Counter | 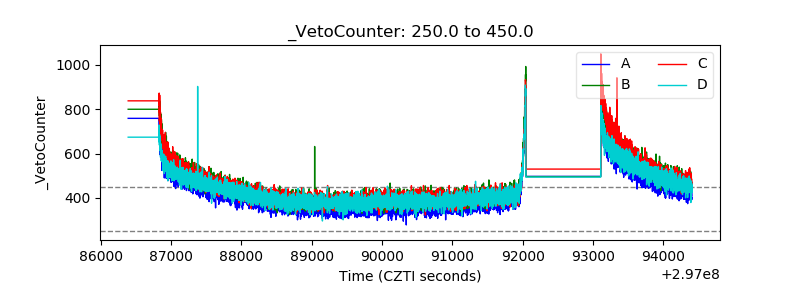 |