| Param | Original file | Final file |
|---|---|---|
| Filename | modeM0/AS1T03_118T01_9000002962_19871cztM0_level2.evt | modeM0/AS1T03_118T01_9000002962_19871cztM0_level2_quad_clean.evt |
| Size (bytes) | 686,416,320 | 73,232,640 |
| Size | 654.6 MB | 69.8 MB |
| Events in quadrant A | 5,414,333 | 459,325 |
| Events in quadrant B | 3,566,892 | 478,622 |
| Events in quadrant C | 4,353,600 | 446,632 |
| Events in quadrant D | 7,022,139 | 387,349 |
| Mode SS | |||
|---|---|---|---|
| Quadrant | BADHDUFLAG | Total packets | Discarded packets |
| A | 0 | 130 | 0 |
| B | 0 | 130 | 0 |
| C | 0 | 130 | 0 |
| D | 0 | 130 | 0 |
| Mode M9 | |||
|---|---|---|---|
| Quadrant | BADHDUFLAG | Total packets | Discarded packets |
| A | 0 | 12 | 0 |
| B | 0 | 13 | 0 |
| C | 0 | 13 | 0 |
| D | 0 | 13 | 0 |
| Mode M0 | |||
|---|---|---|---|
| Quadrant | BADHDUFLAG | Total packets | Discarded packets |
| A | 0 | 20531 | 2 |
| B | 0 | 14771 | 2 |
| C | 0 | 17397 | 3 |
| D | 0 | 25111 | 2 |
| Quadrant | Total seconds | Saturated seconds | Saturation percentage |
|---|---|---|---|
| A | 6375 | 497 | 7.796078% |
| B | 6375 | 128 | 2.007843% |
| C | 6374 | 203 | 3.184813% |
| D | 6374 | 1646 | 25.823659% |
Noise dominated data is calculated using 1-second bins in cleaned event files. If a bin has >2000 counts, and if more than 50% of those come from <1% of pixels, then it is considered to be noise-dominated and hence unusable.
| Quadrant | # 1 sec bins | Bins with >0 counts | Bins with >2000 counts | High rate bins dominated by noise | Noise dominated (total time) | Noise dominated (detector-on time) | Marked lightcurve |
|---|---|---|---|---|---|---|---|
| A | 7540 | 6375 | 299 | 299 | 3.97% | 4.69% | 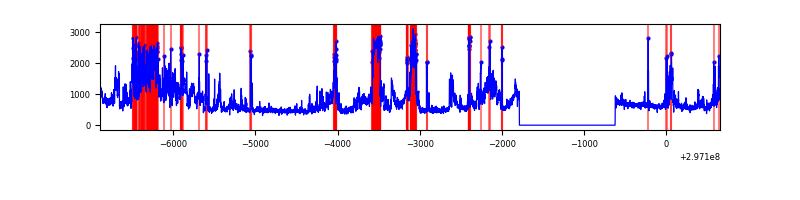 |
| B | 7540 | 6375 | 16 | 16 | 0.21% | 0.25% | 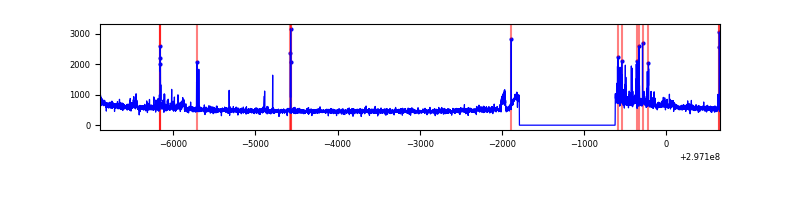 |
| C | 7539 | 6374 | 32 | 32 | 0.42% | 0.50% | 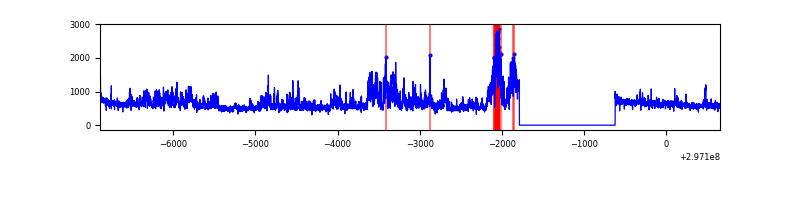 |
| D | 7539 | 6374 | 1465 | 1465 | 19.43% | 22.98% | 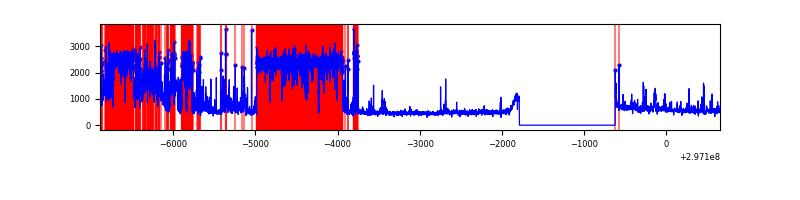 |
Top three noisy pixels from each quadrant. If the there are fewer than three noisy pixels in the level2.evt file, extra rows are filled as -1
| Pixel properties | Quadrant properties | ||||||
|---|---|---|---|---|---|---|---|
| Quadrant | DetID | PixID | Counts | Sigma | Mean | Median | Sigma |
| A | 14 | 238 | 2200540 | 13284.38 | 833 | 818 | 165.6 |
| A | 0 | 226 | 7111 | 38.0 | 833 | 818 | 165.6 |
| A | 3 | 137 | 6300 | 33.11 | 833 | 818 | 165.6 |
| B | 7 | 220 | 96886 | 606.25 | 846 | 829 | 158.4 |
| B | 4 | 216 | 34260 | 211.0 | 846 | 829 | 158.4 |
| B | 0 | 244 | 29968 | 183.91 | 846 | 829 | 158.4 |
| C | 9 | 221 | 1048186 | 5549.31 | 812 | 820 | 188.7 |
| C | 14 | 238 | 128552 | 676.77 | 812 | 820 | 188.7 |
| C | 9 | 54 | 6985 | 32.66 | 812 | 820 | 188.7 |
| D | 1 | 52 | 4033365 | 22543.17 | 743 | 727 | 178.9 |
| D | 2 | 184 | 80790 | 447.57 | 743 | 727 | 178.9 |
| D | 7 | 238 | 60476 | 334.01 | 743 | 727 | 178.9 |
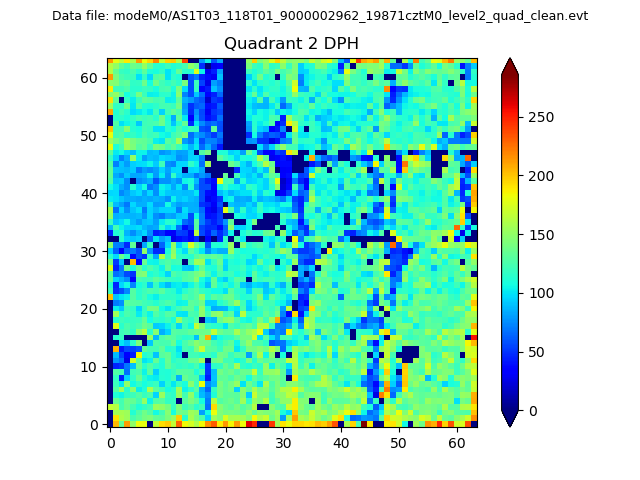
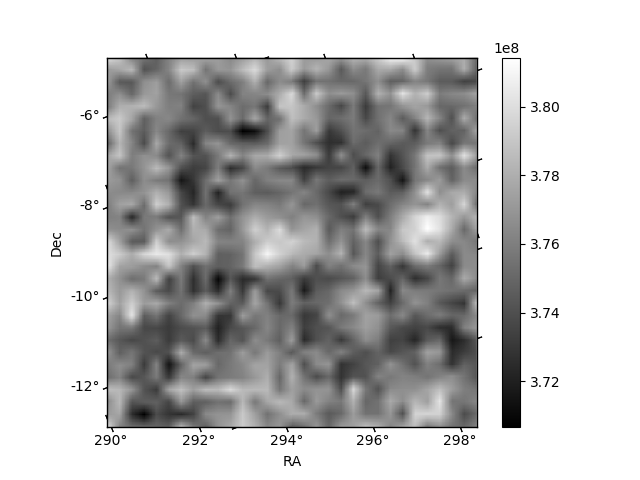
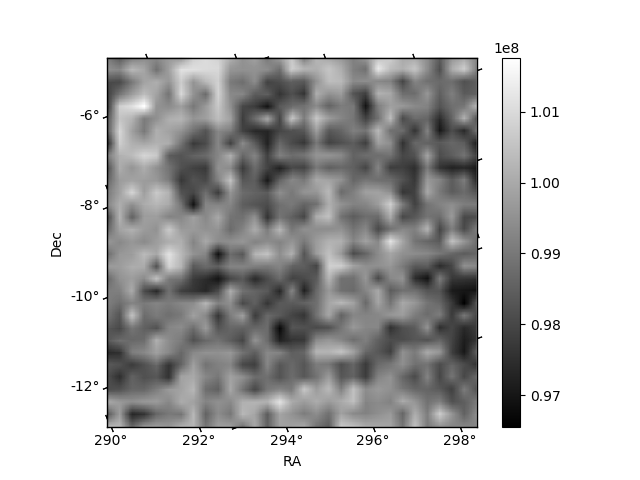
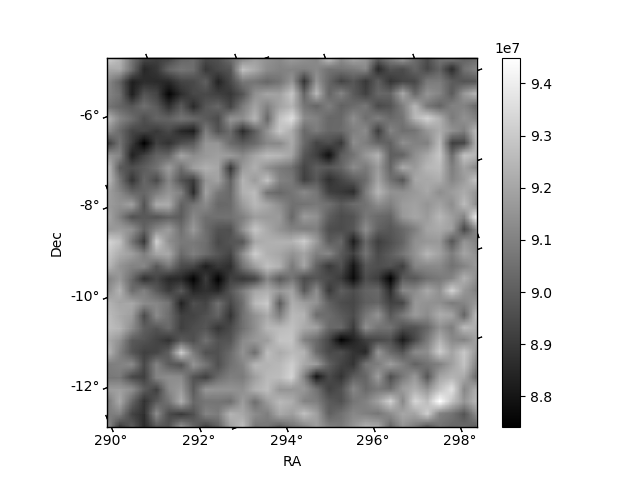
Histogram calculated using DETX and DETY for each event in the final _common_clean file
| Quadrant A | 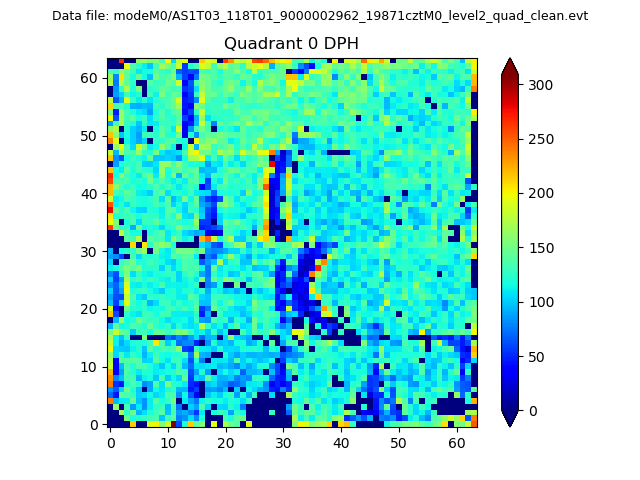 |
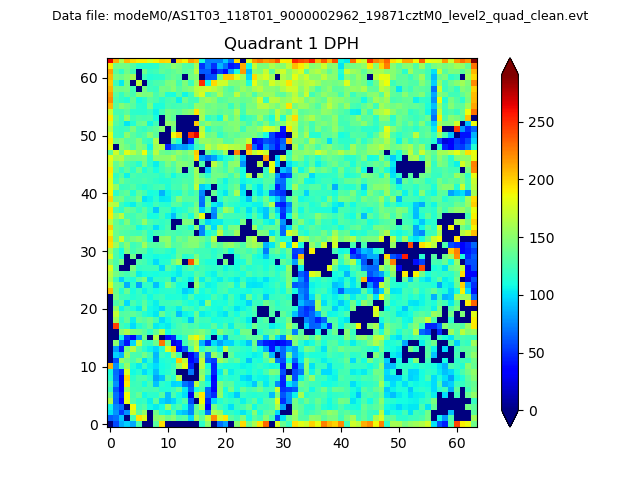 |
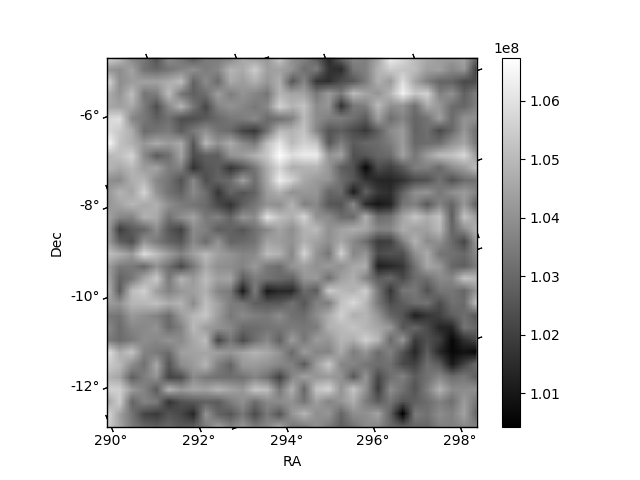
Quadrant B |
|---|---|---|---|
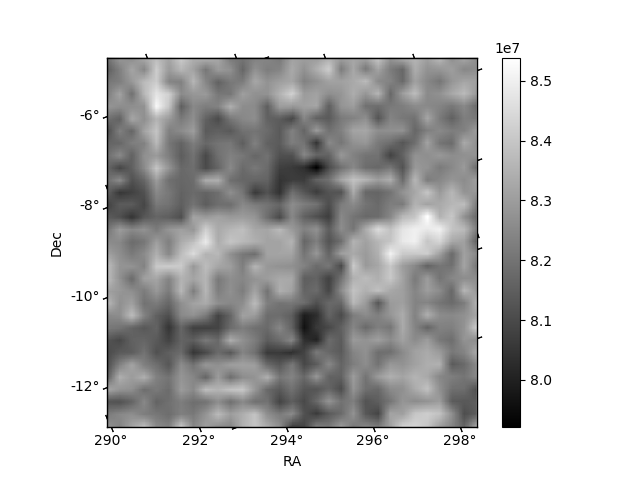
| Quadrant D | 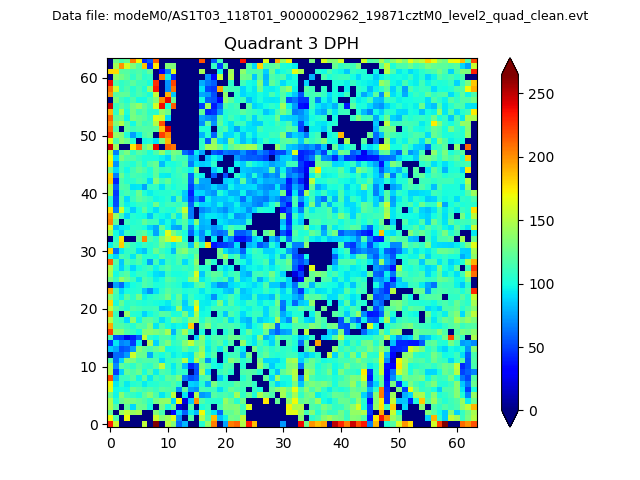 |
 |
Quadrant C |
| Plot type | Count rate plots | Images |
|---|---|---|
| Comparison with Poisson distribution Blue bars denote a histogram of data divided into 1 sec bins. Red curve is a Poisson curve with rate = median count rate of data. |
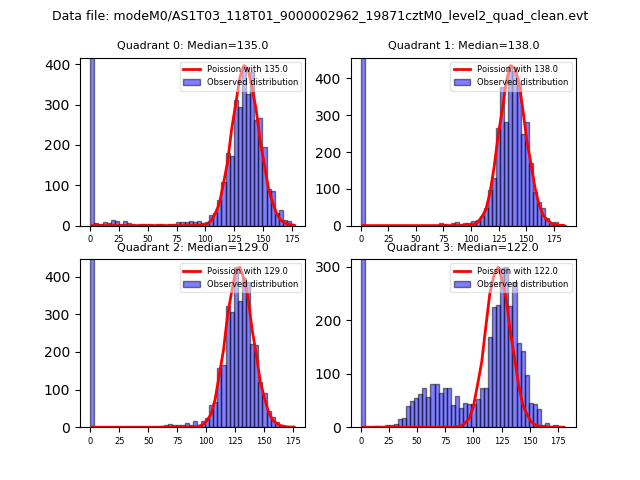 |
 |
| Quadrant-wise count rates Data is divided into 100 sec bins |
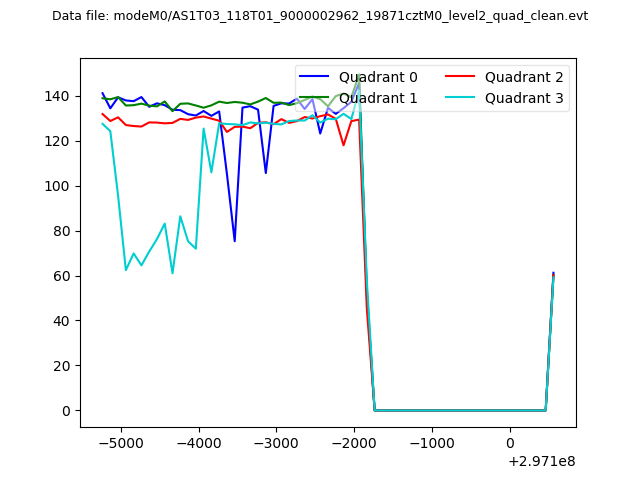 |
|
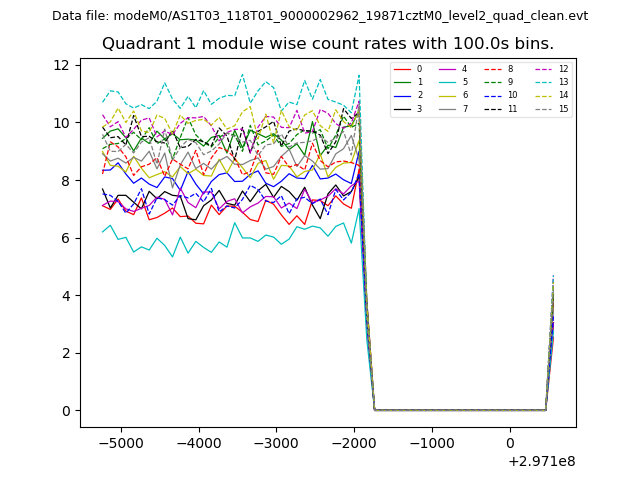
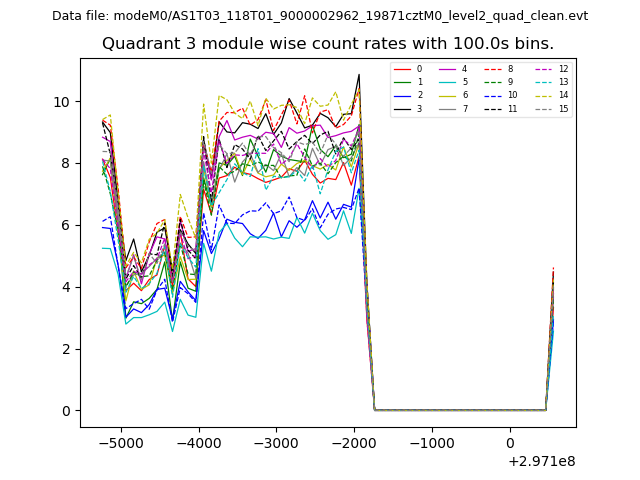
| Module-wise count rates for Quadrant A Data is divided into 100 sec bins |
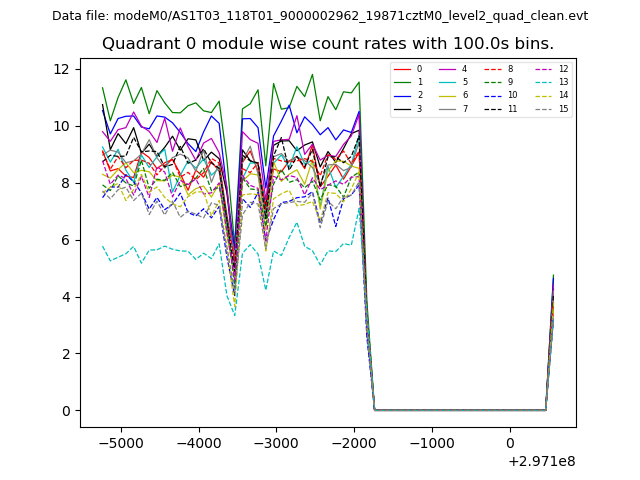 |
 |
| Module-wise count rates for Quadrant B Data is divided into 100 sec bins |
 |
 |
| Module-wise count rates for Quadrant C Data is divided into 100 sec bins |
 |
 |
| Module-wise count rates for Quadrant D Data is divided into 100 sec bins |
 |
 |
| Parameter | Plot |
|---|---|
| CZT HV Monitor |  |
| D_VDD | 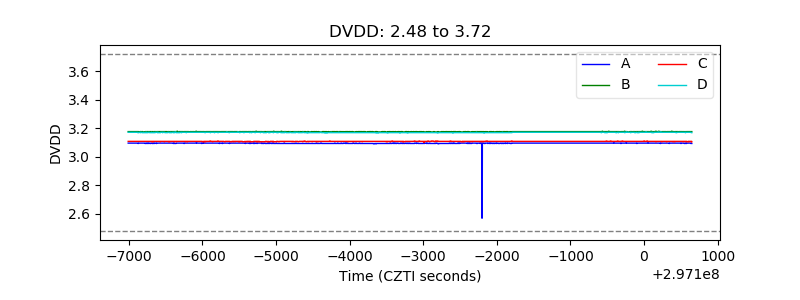 |
| Temperature 1 | 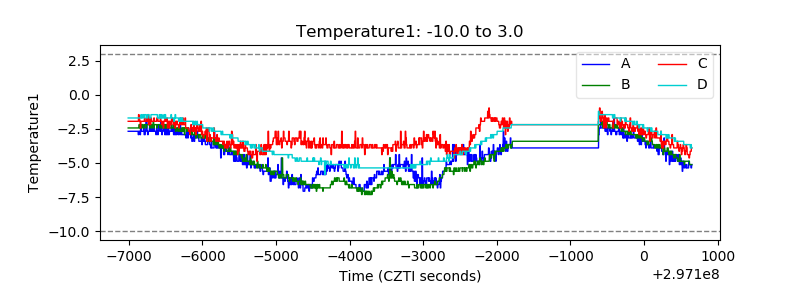 |
| Veto HV Monitor | 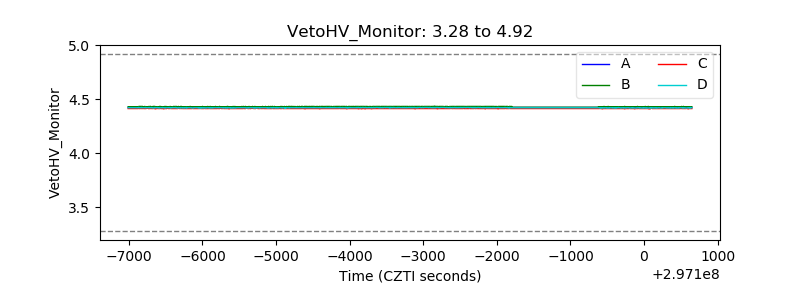 |
| Veto LLD | 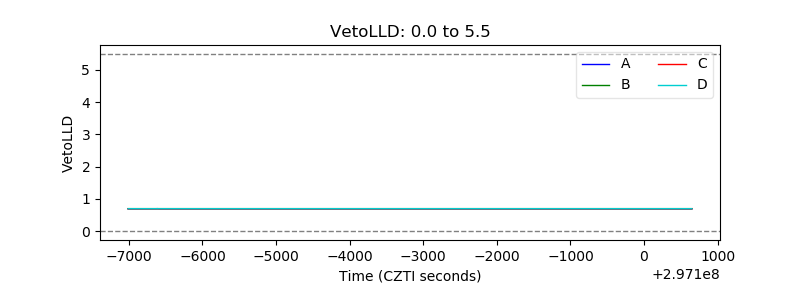 |
| Alpha Counter | 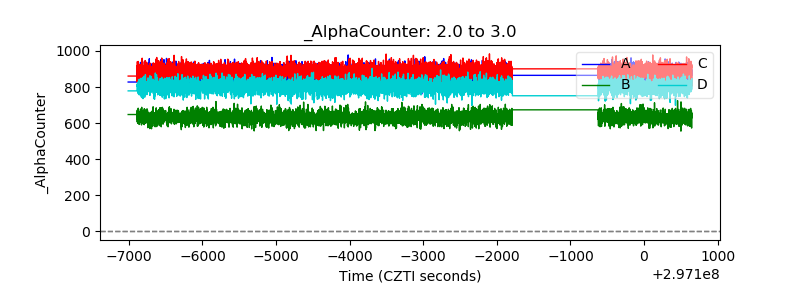 |
| _CPM_Rate | 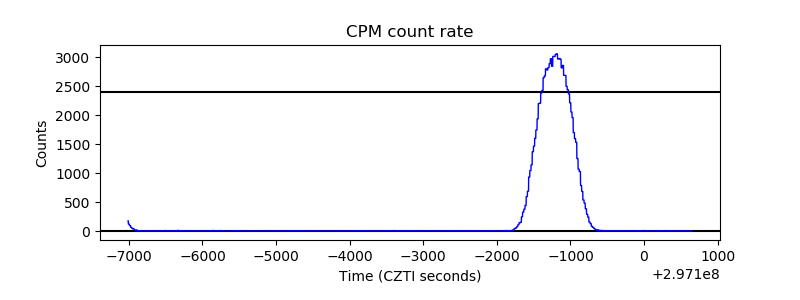 |
| CZT Counter | 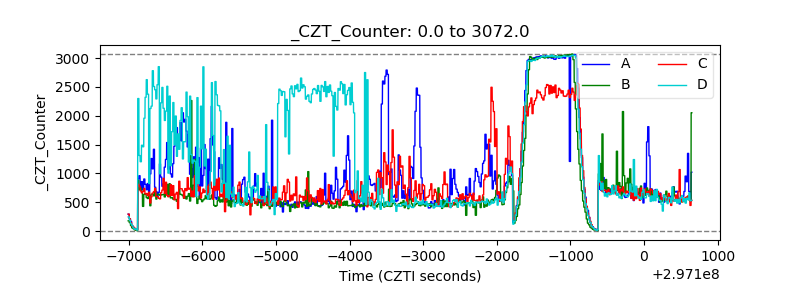 |
| +2.5 Volts monitor | 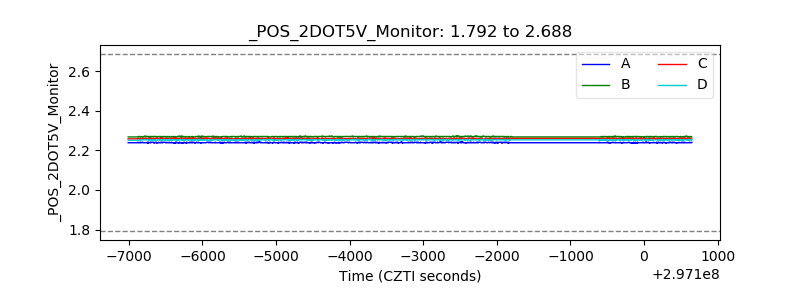 |
| +5 Volts monitor |  |
| _ROLL_ROT | 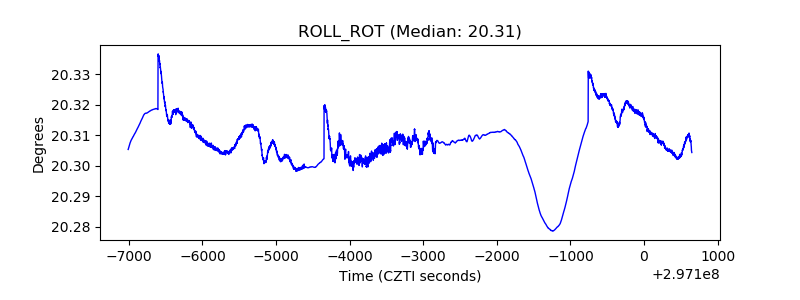 |
| _Roll_DEC | 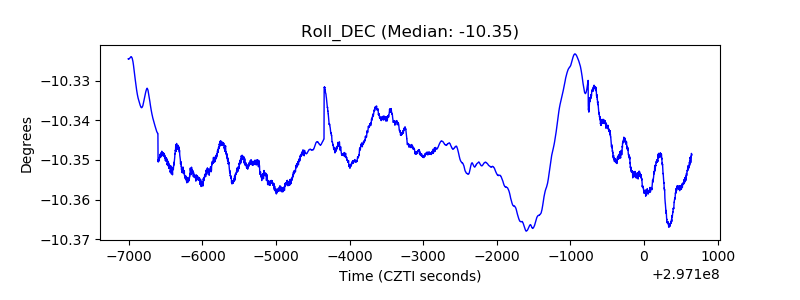 |
| _Roll_RA | 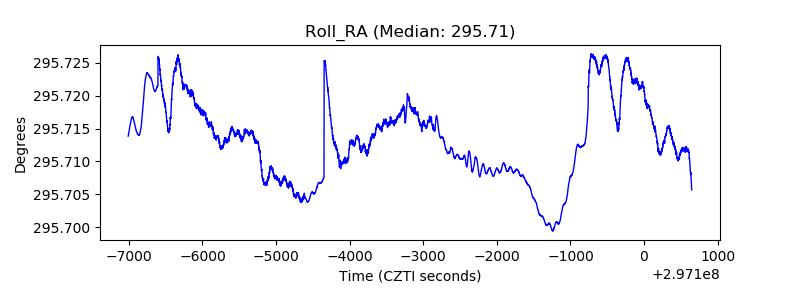 |
| Veto Counter | 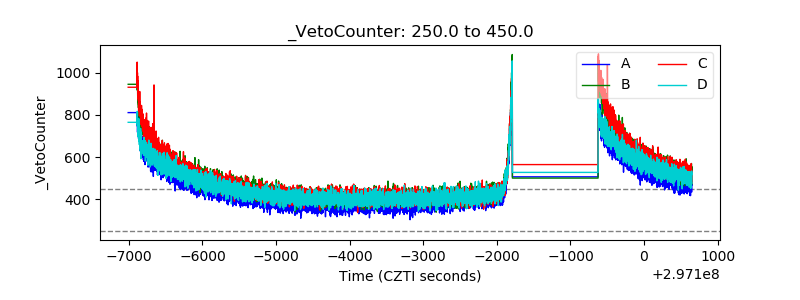 |