| Param | Original file | Final file |
|---|---|---|
| Filename | modeM0/AS1T03_118T01_9000002962_19872cztM0_level2.evt | modeM0/AS1T03_118T01_9000002962_19872cztM0_level2_quad_clean.evt |
| Size (bytes) | 497,926,080 | 90,938,880 |
| Size | 474.9 MB | 86.7 MB |
| Events in quadrant A | 3,683,082 | 591,667 |
| Events in quadrant B | 3,532,144 | 600,198 |
| Events in quadrant C | 3,677,966 | 569,037 |
| Events in quadrant D | 3,759,381 | 553,510 |
| Mode SS | |||
|---|---|---|---|
| Quadrant | BADHDUFLAG | Total packets | Discarded packets |
| A | 0 | 128 | 0 |
| B | 0 | 128 | 0 |
| C | 0 | 128 | 0 |
| D | 0 | 128 | 0 |
| Mode M9 | |||
|---|---|---|---|
| Quadrant | BADHDUFLAG | Total packets | Discarded packets |
| A | 0 | 13 | 0 |
| B | 0 | 14 | 0 |
| C | 0 | 14 | 0 |
| D | 0 | 14 | 0 |
| Mode M0 | |||
|---|---|---|---|
| Quadrant | BADHDUFLAG | Total packets | Discarded packets |
| A | 0 | 15111 | 2 |
| B | 0 | 14487 | 2 |
| C | 0 | 14998 | 2 |
| D | 0 | 15193 | 2 |
| Quadrant | Total seconds | Saturated seconds | Saturation percentage |
|---|---|---|---|
| A | 6297 | 59 | 0.936954% |
| B | 6297 | 99 | 1.572177% |
| C | 6297 | 92 | 1.461013% |
| D | 6297 | 134 | 2.127997% |
Noise dominated data is calculated using 1-second bins in cleaned event files. If a bin has >2000 counts, and if more than 50% of those come from <1% of pixels, then it is considered to be noise-dominated and hence unusable.
| Quadrant | # 1 sec bins | Bins with >0 counts | Bins with >2000 counts | High rate bins dominated by noise | Noise dominated (total time) | Noise dominated (detector-on time) | Marked lightcurve |
|---|---|---|---|---|---|---|---|
| A | 7597 | 6313 | 13 | 13 | 0.17% | 0.21% | 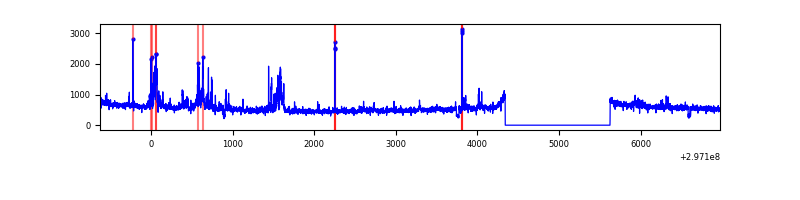 |
| B | 7597 | 6313 | 15 | 15 | 0.20% | 0.24% | 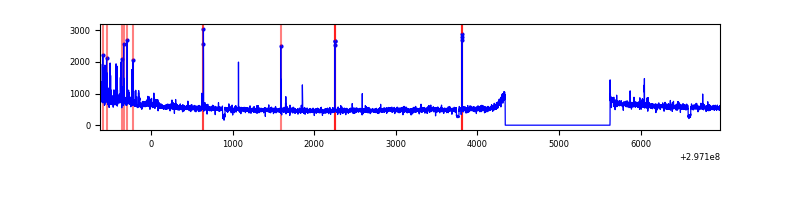 |
| C | 7597 | 6313 | 9 | 9 | 0.12% | 0.14% | 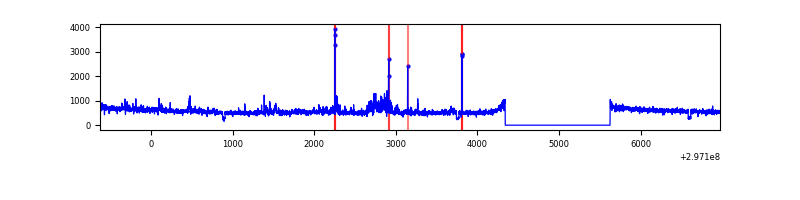 |
| D | 7597 | 6313 | 106 | 106 | 1.40% | 1.68% | 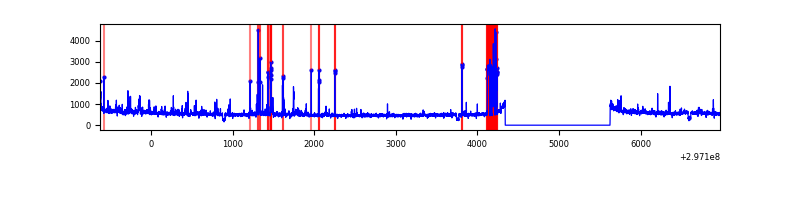 |
Top three noisy pixels from each quadrant. If the there are fewer than three noisy pixels in the level2.evt file, extra rows are filled as -1
| Pixel properties | Quadrant properties | ||||||
|---|---|---|---|---|---|---|---|
| Quadrant | DetID | PixID | Counts | Sigma | Mean | Median | Sigma |
| A | 14 | 238 | 363158 | 2113.15 | 863 | 849 | 171.5 |
| A | 0 | 226 | 7508 | 38.84 | 863 | 849 | 171.5 |
| A | 3 | 137 | 6526 | 33.11 | 863 | 849 | 171.5 |
| B | 7 | 220 | 73898 | 455.23 | 862 | 844 | 160.5 |
| B | 0 | 229 | 24355 | 146.51 | 862 | 844 | 160.5 |
| B | 0 | 197 | 22575 | 135.41 | 862 | 844 | 160.5 |
| C | 9 | 221 | 283601 | 1462.22 | 834 | 843 | 193.4 |
| C | 14 | 238 | 132655 | 681.64 | 834 | 843 | 193.4 |
| C | 9 | 54 | 7181 | 32.78 | 834 | 843 | 193.4 |
| D | 1 | 52 | 364832 | 1825.82 | 834 | 814 | 199.4 |
| D | 7 | 238 | 102723 | 511.15 | 834 | 814 | 199.4 |
| D | 7 | 96 | 71599 | 355.04 | 834 | 814 | 199.4 |
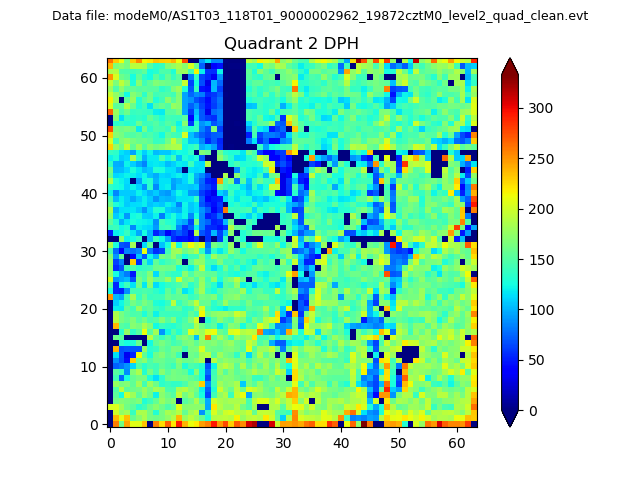
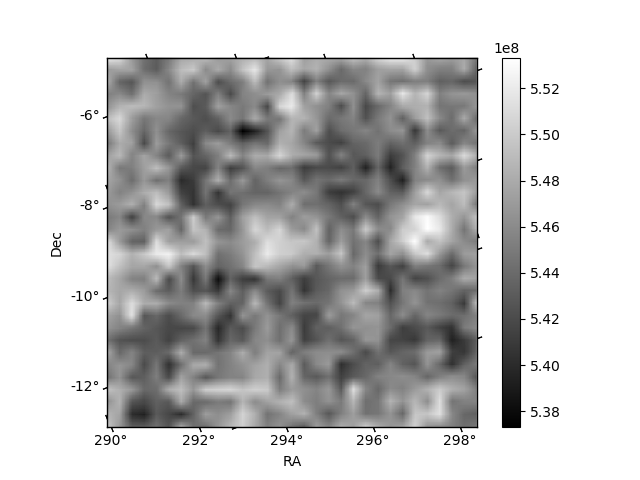
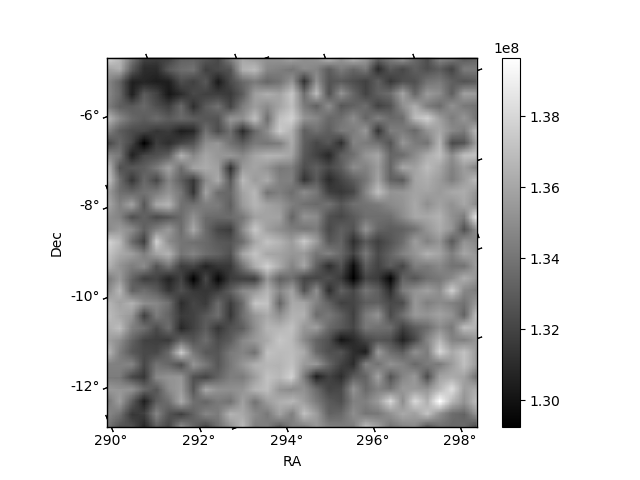
Histogram calculated using DETX and DETY for each event in the final _common_clean file
| Quadrant A | 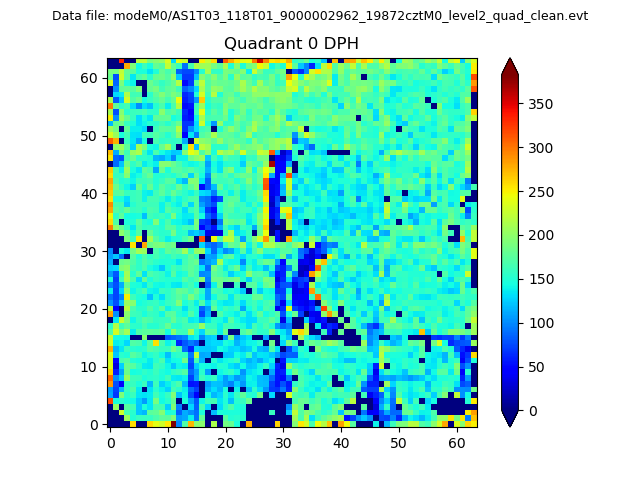 |
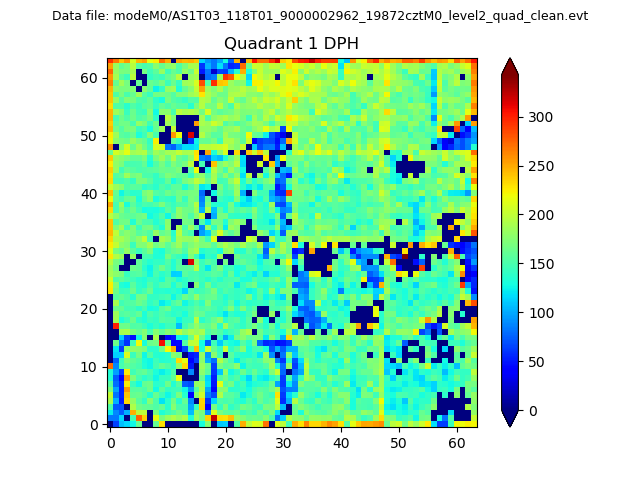 |
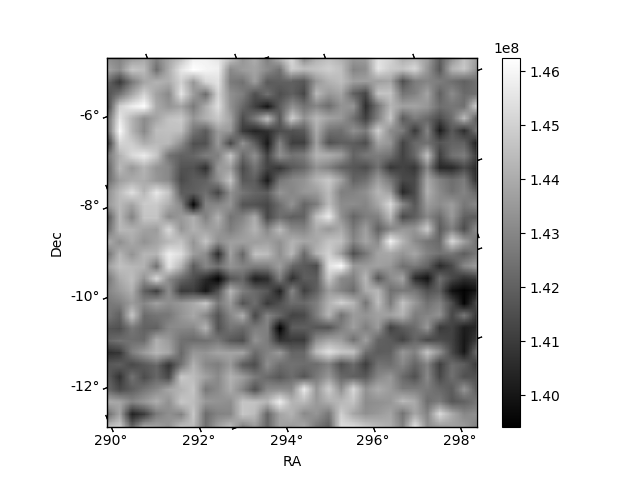
Quadrant B |
|---|---|---|---|
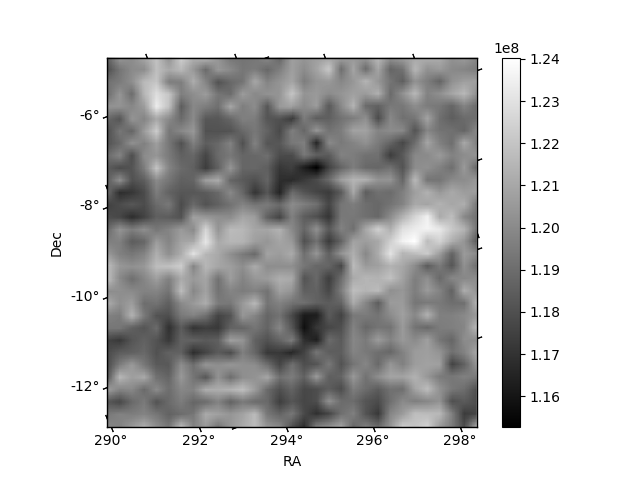
| Quadrant D | 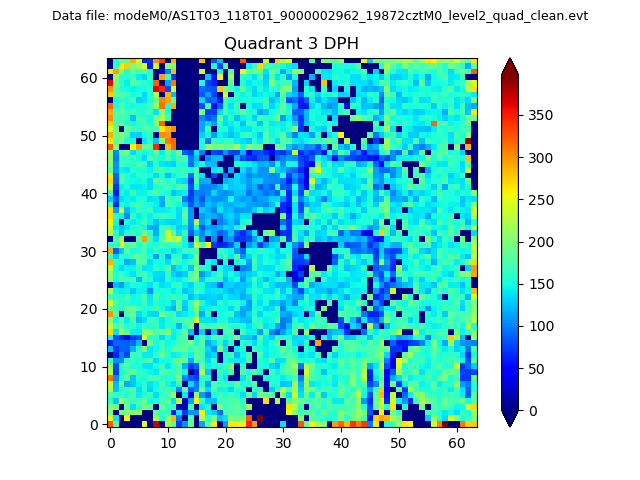 |
 |
Quadrant C |
| Plot type | Count rate plots | Images |
|---|---|---|
| Comparison with Poisson distribution Blue bars denote a histogram of data divided into 1 sec bins. Red curve is a Poisson curve with rate = median count rate of data. |
 |
 |
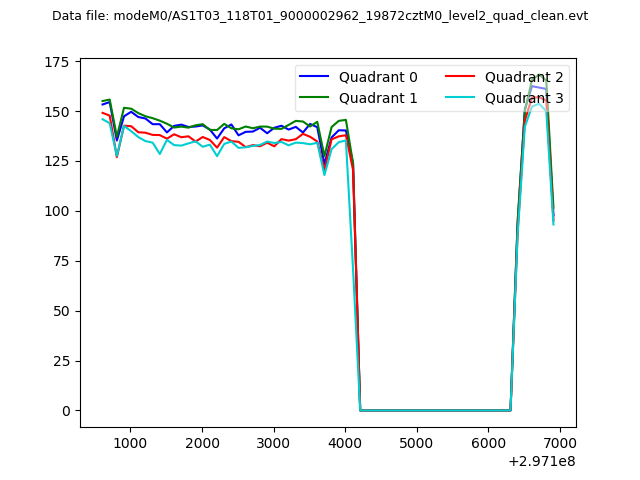
| Quadrant-wise count rates Data is divided into 100 sec bins |
 |
|
| Module-wise count rates for Quadrant A Data is divided into 100 sec bins |
 |
 |
| Module-wise count rates for Quadrant B Data is divided into 100 sec bins |
 |
 |
| Module-wise count rates for Quadrant C Data is divided into 100 sec bins |
 |
 |
| Module-wise count rates for Quadrant D Data is divided into 100 sec bins |
 |
 |
| Parameter | Plot |
|---|---|
| CZT HV Monitor | 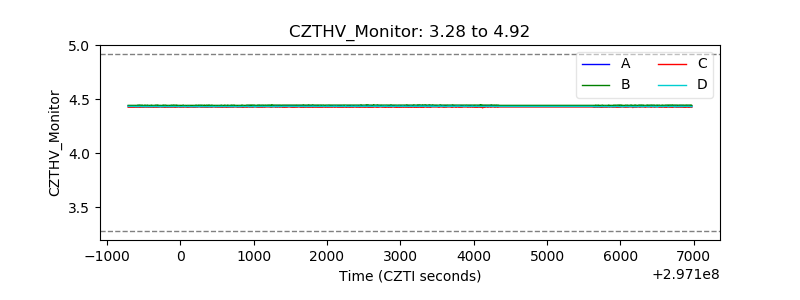 |
| D_VDD | 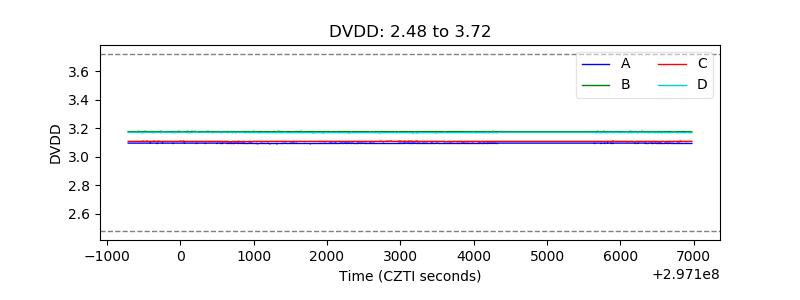 |
| Temperature 1 | 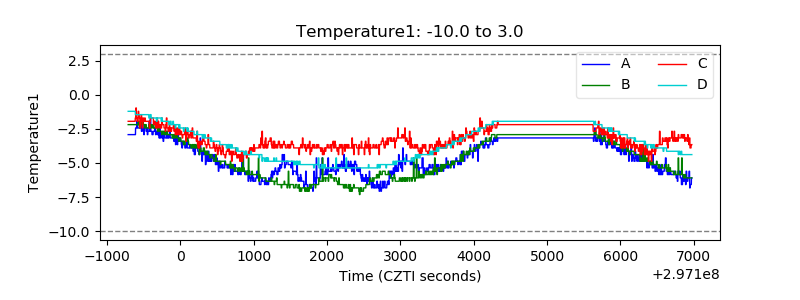 |
| Veto HV Monitor | 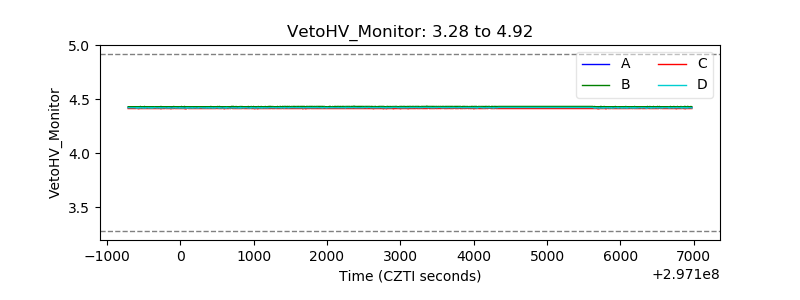 |
| Veto LLD | 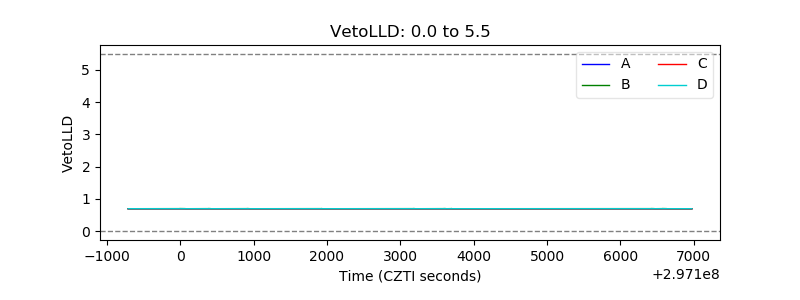 |
| Alpha Counter | 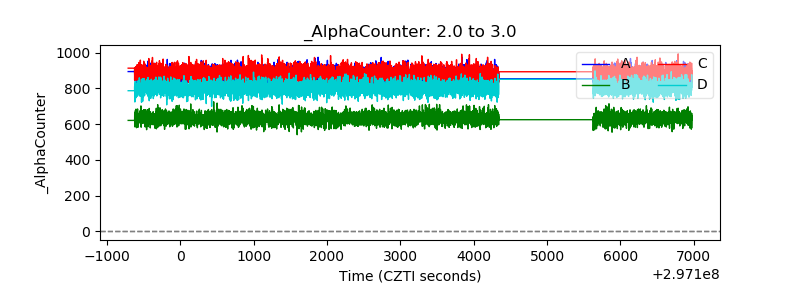 |
| _CPM_Rate | 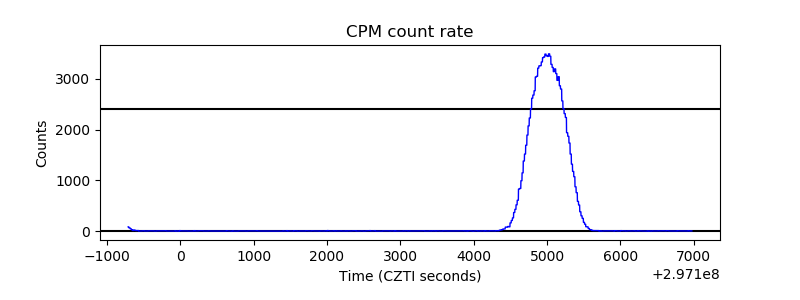 |
| CZT Counter | 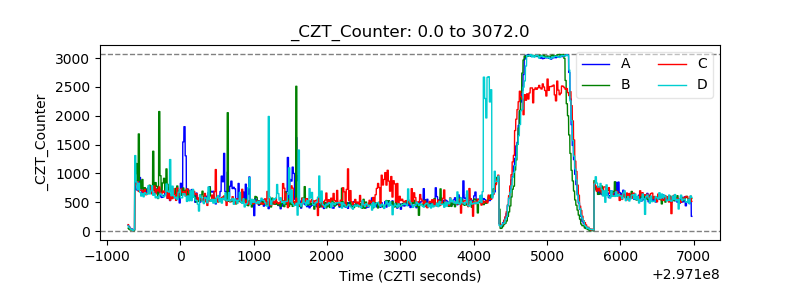 |
| +2.5 Volts monitor |  |
| +5 Volts monitor |  |
| _ROLL_ROT |  |
| _Roll_DEC | 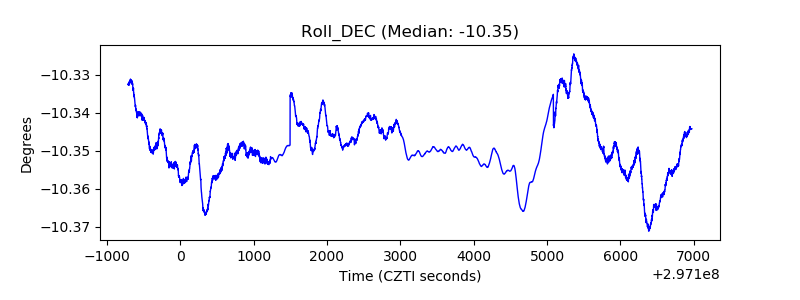 |
| _Roll_RA | 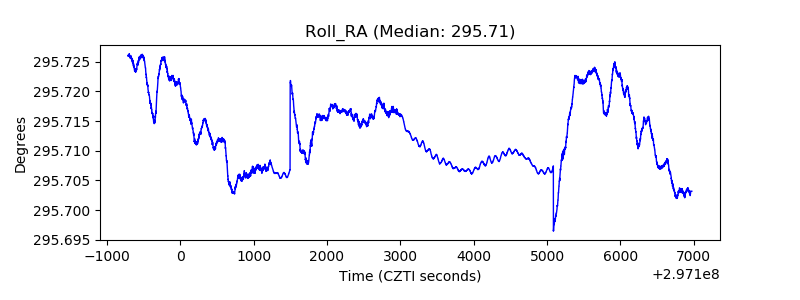 |
| Veto Counter |  |