| Param | Original file | Final file |
|---|---|---|
| Filename | modeM0/AS1T03_118T01_9000002962_19873cztM0_level2.evt | modeM0/AS1T03_118T01_9000002962_19873cztM0_level2_quad_clean.evt |
| Size (bytes) | 489,263,040 | 103,055,040 |
| Size | 466.6 MB | 98.3 MB |
| Events in quadrant A | 3,551,146 | 678,612 |
| Events in quadrant B | 3,519,630 | 694,228 |
| Events in quadrant C | 3,520,851 | 662,830 |
| Events in quadrant D | 3,789,698 | 637,533 |
| Mode SS | |||
|---|---|---|---|
| Quadrant | BADHDUFLAG | Total packets | Discarded packets |
| A | 0 | 132 | 0 |
| B | 0 | 132 | 0 |
| C | 0 | 132 | 0 |
| D | 0 | 132 | 0 |
| Mode M9 | |||
|---|---|---|---|
| Quadrant | BADHDUFLAG | Total packets | Discarded packets |
| A | 0 | 27 | 0 |
| B | 0 | 27 | 0 |
| C | 0 | 27 | 0 |
| D | 0 | 27 | 0 |
| Mode M0 | |||
|---|---|---|---|
| Quadrant | BADHDUFLAG | Total packets | Discarded packets |
| A | 0 | 14518 | 2 |
| B | 0 | 14539 | 2 |
| C | 0 | 14443 | 2 |
| D | 0 | 15290 | 2 |
| Quadrant | Total seconds | Saturated seconds | Saturation percentage |
|---|---|---|---|
| A | 6422 | 83 | 1.292432% |
| B | 6423 | 125 | 1.946131% |
| C | 6423 | 139 | 2.164098% |
| D | 6423 | 180 | 2.802429% |
Noise dominated data is calculated using 1-second bins in cleaned event files. If a bin has >2000 counts, and if more than 50% of those come from <1% of pixels, then it is considered to be noise-dominated and hence unusable.
| Quadrant | # 1 sec bins | Bins with >0 counts | Bins with >2000 counts | High rate bins dominated by noise | Noise dominated (total time) | Noise dominated (detector-on time) | Marked lightcurve |
|---|---|---|---|---|---|---|---|
| A | 9062 | 6424 | 4 | 4 | 0.04% | 0.06% | 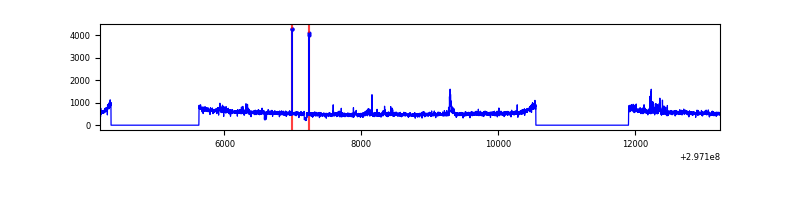 |
| B | 9063 | 6424 | 6 | 6 | 0.07% | 0.09% | 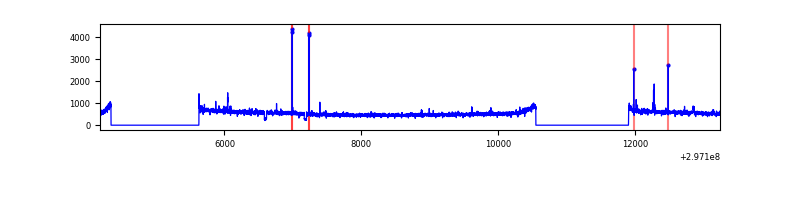 |
| C | 9063 | 6424 | 4 | 4 | 0.04% | 0.06% | 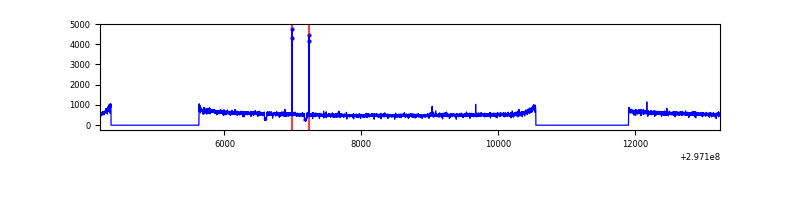 |
| D | 9063 | 6424 | 113 | 113 | 1.25% | 1.76% | 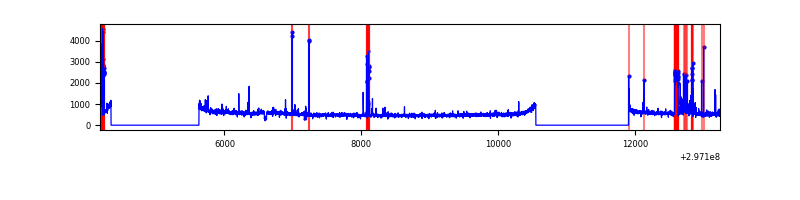 |
Top three noisy pixels from each quadrant. If the there are fewer than three noisy pixels in the level2.evt file, extra rows are filled as -1
| Pixel properties | Quadrant properties | ||||||
|---|---|---|---|---|---|---|---|
| Quadrant | DetID | PixID | Counts | Sigma | Mean | Median | Sigma |
| A | 14 | 238 | 120527 | 673.75 | 885 | 869 | 177.6 |
| A | 12 | 16 | 14956 | 79.32 | 885 | 869 | 177.6 |
| A | 11 | 29 | 12833 | 67.36 | 885 | 869 | 177.6 |
| B | 12 | 111 | 19416 | 111.26 | 889 | 868 | 166.7 |
| B | 11 | 111 | 17341 | 98.81 | 889 | 868 | 166.7 |
| B | 14 | 111 | 15088 | 85.3 | 889 | 868 | 166.7 |
| C | 14 | 238 | 136304 | 673.13 | 863 | 870 | 201.2 |
| C | 9 | 221 | 20717 | 98.64 | 863 | 870 | 201.2 |
| C | 13 | 61 | 5822 | 24.61 | 863 | 870 | 201.2 |
| D | 1 | 52 | 355491 | 1714.46 | 862 | 842 | 206.9 |
| D | 7 | 238 | 108246 | 519.22 | 862 | 842 | 206.9 |
| D | 7 | 96 | 47569 | 225.89 | 862 | 842 | 206.9 |
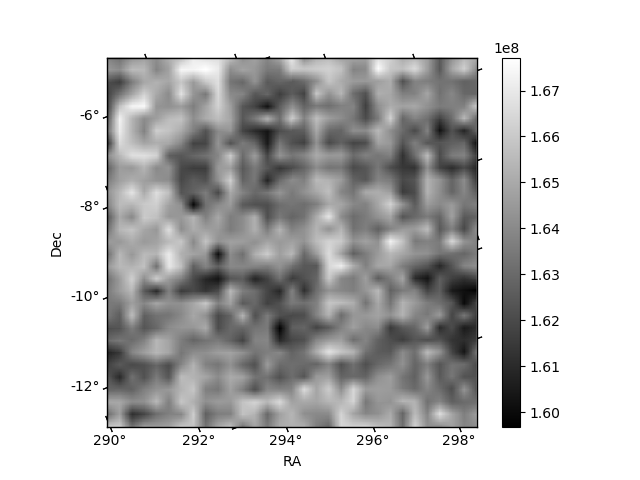
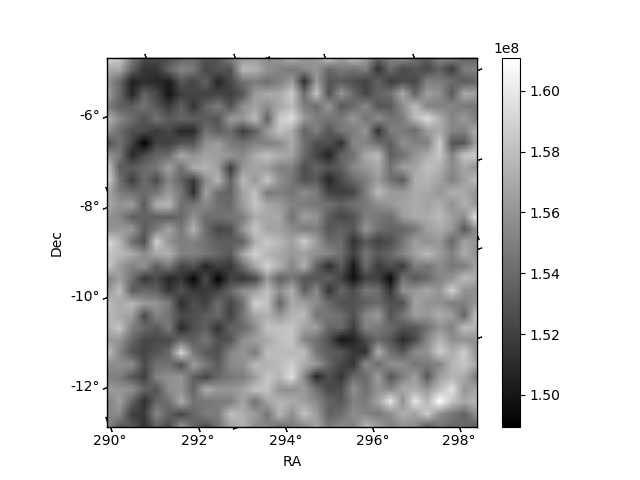
Histogram calculated using DETX and DETY for each event in the final _common_clean file
| Quadrant A | 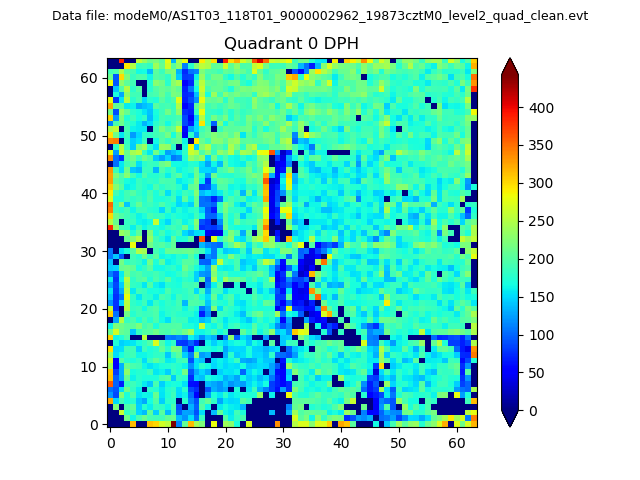 |
 |
Quadrant B |
|---|---|---|---|
| Quadrant D |  |
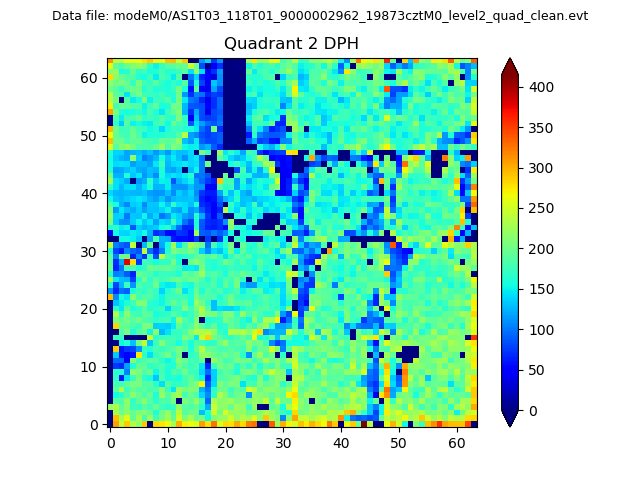 |
Quadrant C |
| Plot type | Count rate plots | Images |
|---|---|---|
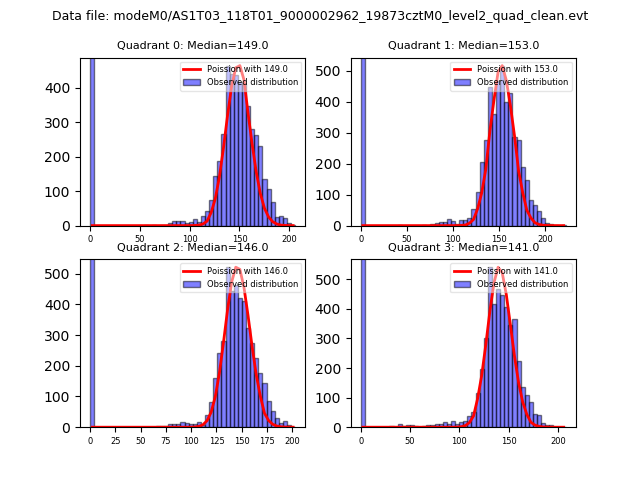
| Comparison with Poisson distribution Blue bars denote a histogram of data divided into 1 sec bins. Red curve is a Poisson curve with rate = median count rate of data. |
 |
 |
| Quadrant-wise count rates Data is divided into 100 sec bins |
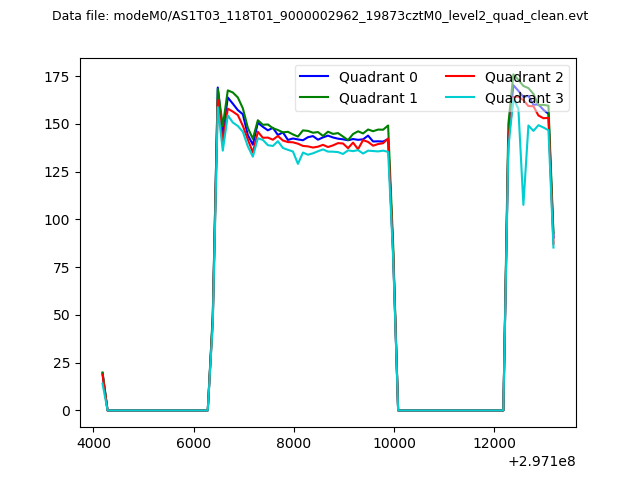 |
|
| Module-wise count rates for Quadrant A Data is divided into 100 sec bins |
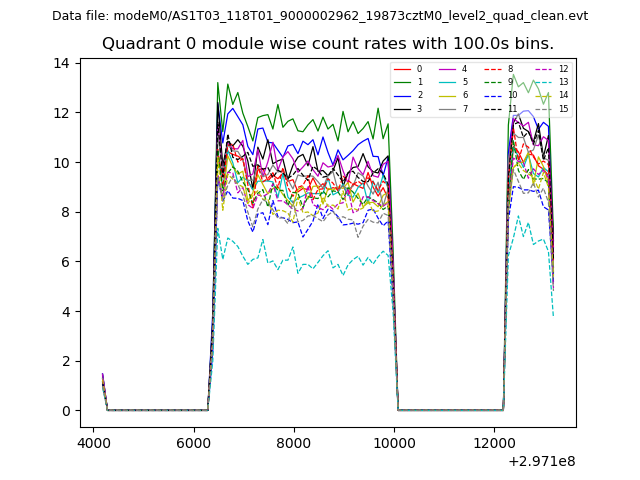 |
 |
| Module-wise count rates for Quadrant B Data is divided into 100 sec bins |
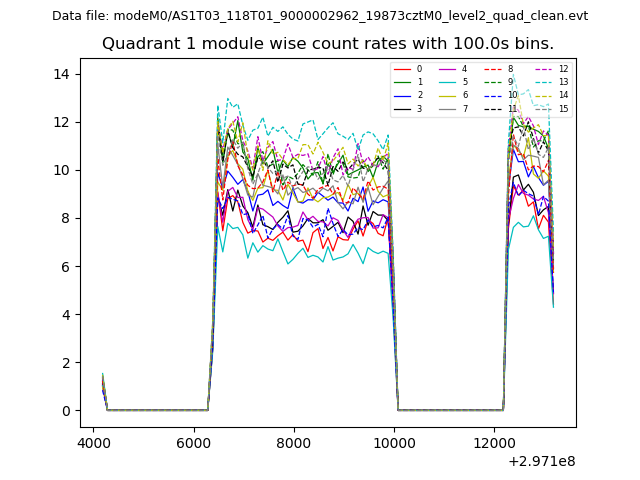 |
 |
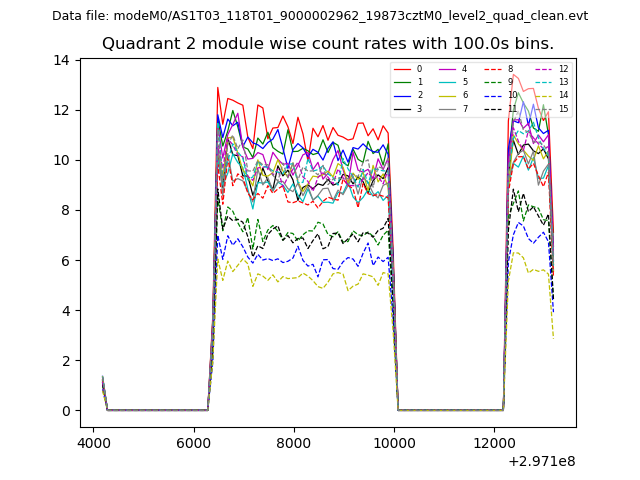
| Module-wise count rates for Quadrant C Data is divided into 100 sec bins |
 |
 |
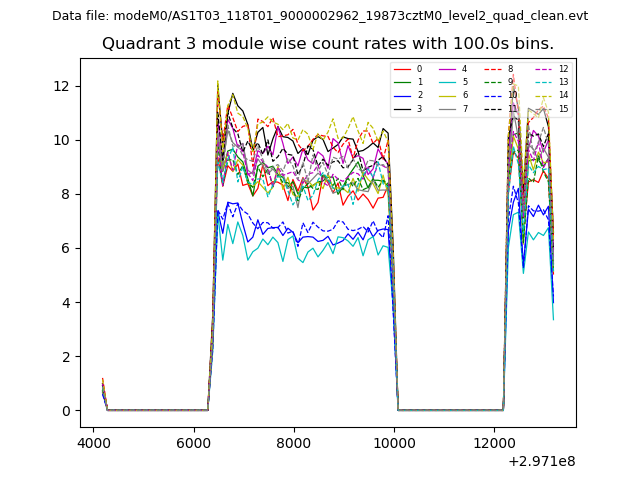
| Module-wise count rates for Quadrant D Data is divided into 100 sec bins |
 |
 |
| Parameter | Plot |
|---|---|
| CZT HV Monitor |  |
| D_VDD | 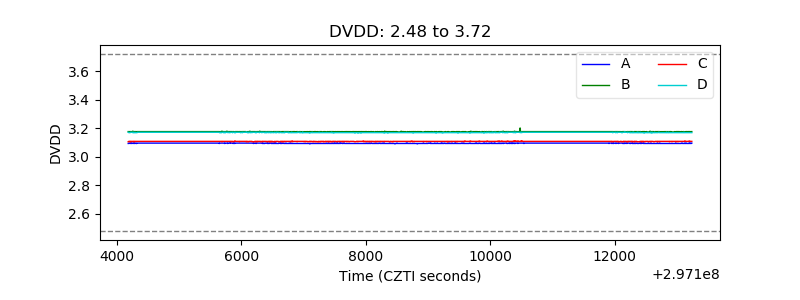 |
| Temperature 1 | 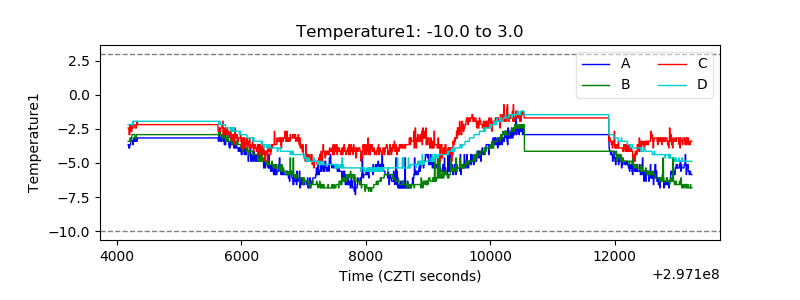 |
| Veto HV Monitor | 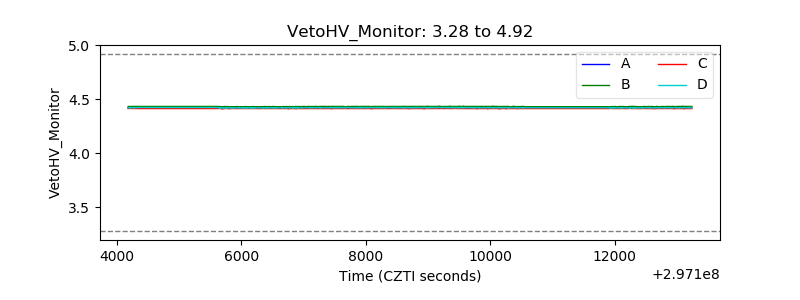 |
| Veto LLD | 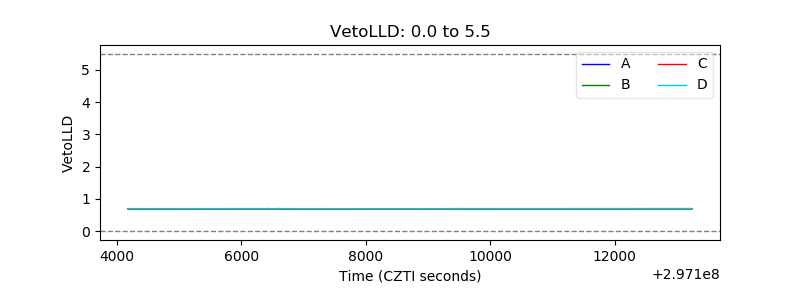 |
| Alpha Counter | 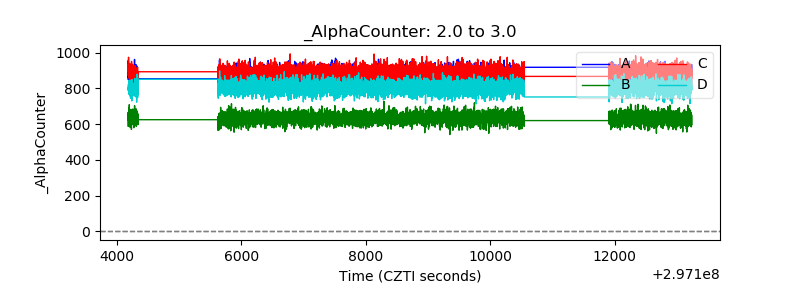 |
| _CPM_Rate | 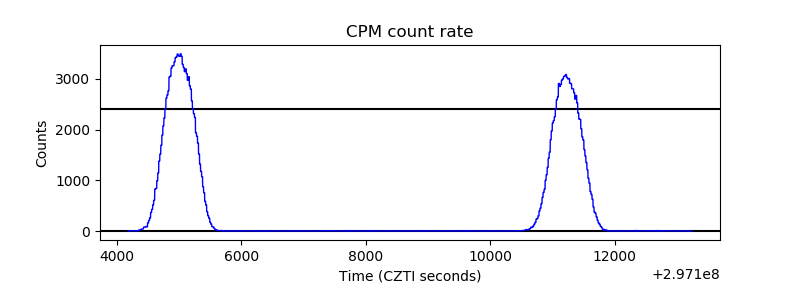 |
| CZT Counter | 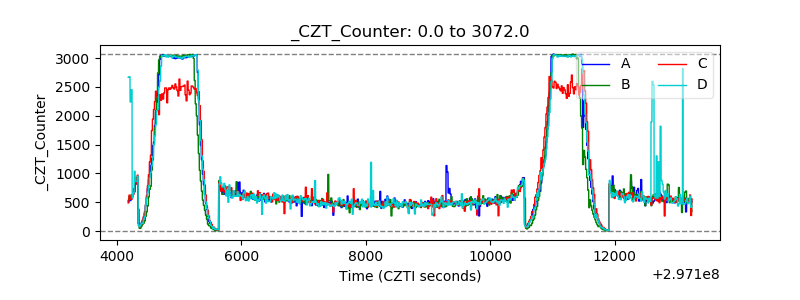 |
| +2.5 Volts monitor |  |
| +5 Volts monitor |  |
| _ROLL_ROT | 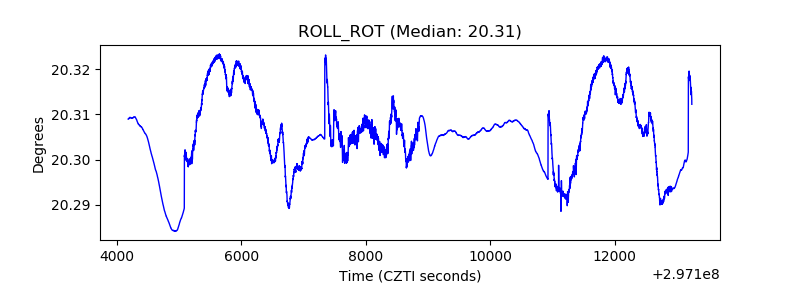 |
| _Roll_DEC | 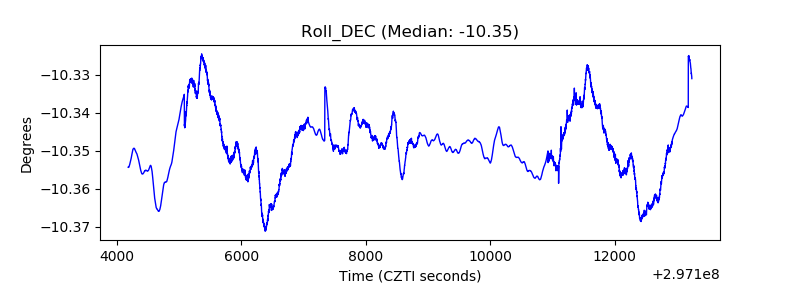 |
| _Roll_RA | 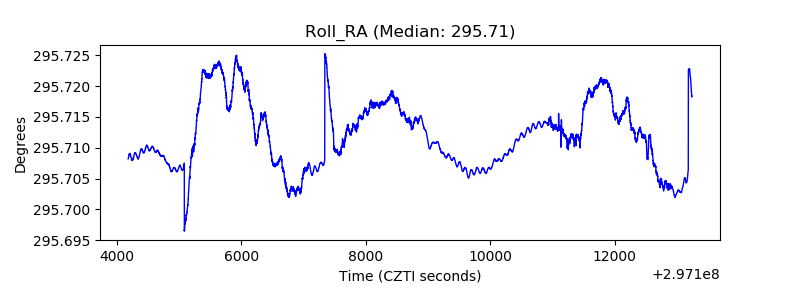 |
| Veto Counter | 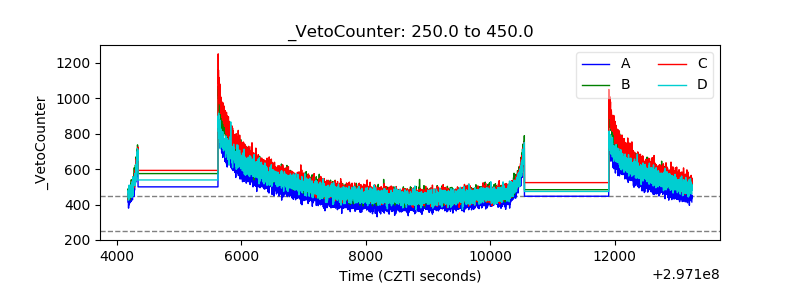 |